SPY: New Turn of Events. From exp. ;) I am telling you, this might go up higher. I have no explaination but been there done that :D
ETF market

Long Position on QQQ – 16th May 2025 AnalysisTrading Idea: Long Position on QQQ – 16th May 2025
This chart illustrates a long position on QQQ, in the Daily Time Frame. Overall, the market structure is bullish. It is expected to retest 493 to 500, before going further high. Also, if any liquidity is targeted, then 475 should be the spot.
Analysis:
• Market Structure: The overall market structure is Bullish. Since it has given good breakout above recent high above 20 EMA (i.e. on 25th March 2025), it is the expectation that the market will retest this level, near 493 to 500.
• Liquidity Target: It is also expected that big players can target liquidity near 475 level, which was the recent breakout level.
• Trend Change: Anything below 475, could be considered in weakness in trend and possibly slow down the recovery to all time high.
Trade plan1:
• Entry: Near 500
• Stop Loss: 490
• Take Profit: Around 530
• Risk-Reward: 1:4
Trade plan2:
• Entry: Near $480
• Stop Loss: Near $470
• Take Profit: Around $530
• Risk-Reward: 1:5
Disclaimer:
The information provided in this chart is for educational and informational purposes only and should not be considered as investment advice. Trading and investing involve substantial risk and are not suitable for every investor. You should carefully consider your financial situation and consult with a financial advisor before making any investment decisions. The creator of this chart does not guarantee any specific outcome or profit and is not responsible for any losses incurred as a result of using this information. Past performance is not indicative of future results. Use this information at your own risk. This chart has been created for my own improvement in Trading and Investment Analysis. Please do your own analysis before any investments.

Gold Miners (GDX) at Key Support, Set for Potential Upside MoveThe Gold Miners ETF (GDX) is showing promising signs for investors as it approaches a critical support zone. Since the low on December 30, 2024, GDX has been tracing a five-wave impulse pattern. This is a hallmark of bullish momentum in Elliott Wave analysis. The first wave (wave (1)) peaked at $42.66, followed by a pullback to $38.58 in wave (2). From there, GDX surged in wave (3) to $53.25, as seen on the one-hour chart below. Currently, the ETF is in a corrective wave (4), unfolding as a zigzag pattern, which is nearing completion.
The zigzag’s wave A dropped to $46.73, with its internal structure showing five sub-waves. Wave ((i)) at $50.95, a rally to $52.99 in wave ((ii)), a decline to $47.77 in wave ((iii)), a bounce to $50.09 in wave ((iv)), and a final dip to $46.73 in wave ((v)). Wave B then rallied to $51.39, also as a zigzag, with sub-waves ((a)) at $49.1, ((b)) at $48.05, and ((c)) at $51.39. Now, wave C is underway, with wave ((i)) at $48.72, wave ((ii)) at $50.48, and wave ((iii)) at $44.45. Wave ((iv)) is expected to conclude soon, leading to a final drop in wave ((v)) to the $40.81–$44.86 blue box range.
This blue box area represents a key support zone where buying interest is likely to emerge. Investors should watch this range closely, as it could mark the end of the correction and the start of the next leg higher in wave (5). With GDX poised at this critical juncture, the setup favors taking long positions in anticipation of a bullish reversal.

$QQQ Over $523.5 for a retest of Highs. Lower High Setup?As you can see on the notes in the chart, several 5 counts lead to sell offs in the last Quarter. Will this trend continue or will we run it to a 9 Count again? 3 Days left. Watch these levels as I have a possible selloff to May open Price. This would effectively follow my 10D chart forecast of new lows in the next 30-40 trading days, if not 20 for significant damage either way. I will continue to update as we go.

Nightly $SPY / $SPX Scenarios for May 16, 2025🔮 Nightly AMEX:SPY / SP:SPX Scenarios for May 16, 2025 🔮
🌍 Market-Moving News 🌍
📉 Jamie Dimon Warns of Possible Recession
JPMorgan Chase CEO Jamie Dimon cautioned that a U.S. recession remains a real possibility amid ongoing uncertainty from the Trump administration's tariff policies. Speaking at JPMorgan’s Global Markets Conference in Paris, Dimon stated that while he hopes a recession can be avoided, it should not be ruled out.
💵 Stablecoin Legislation May Bolster U.S. Dollar
U.S. policymakers are advancing legislation to regulate dollar-linked stablecoins, aiming to reinforce the strength and global status of the U.S. dollar. The proposed Guiding and Establishing National Innovation for U.S. Stablecoins Act of 2025 (GENIUS Act) seeks to regulate stablecoins and their issuers, potentially anchoring the dollar's influence in the global financial ecosystem.
🏠 The Great Property Sell Fest Begins in India
The Great Property Sell Fest, a first-of-its-kind property festival in the Indian real estate market, is scheduled to take place from May 16 to 18, 2025. The event will be hosted across key locations including Gurugram, Noida, and Panipat, offering a unique platform for homeowners looking to sell their properties at premium prices.
📊 Key Data Releases 📊
📅 Friday, May 16:
8:30 AM ET: U.S. Import and Export Price Indexes for April
⚠️ Disclaimer:
This information is for educational and informational purposes only and should not be construed as financial advice. Always consult a licensed financial advisor before making investment decisions.
📌 #trading #stockmarket #economy #news #trendtao #charting #technicalanalysis


RSP Spiral cycle peak 5/16 EXIT The chart posted is the RSP SP 500 EQUAL WEIGHTED the two high based on spirals are due to peak on Friday late . We should have a short term top and the begin a pullback for wave 4 . Best of trades WAVETIMER

XLY eyes on $198: Major resistance zone for recovery wave XLYXLY is a key etf/index to evaluate tariff sentiment.
Currently fighting a major resistance $197.88-193.23
Look for a Break-and-Run or Reject hard from here.

$DIA Analysis, Key Levels & Targets for Day Traders // May 15 25AMEX:DIA Analysis, Key Levels & Targets for Day Traders // May 15 25
Let's go, we had PPI in premarket w// Powell... Today's range looks fun.

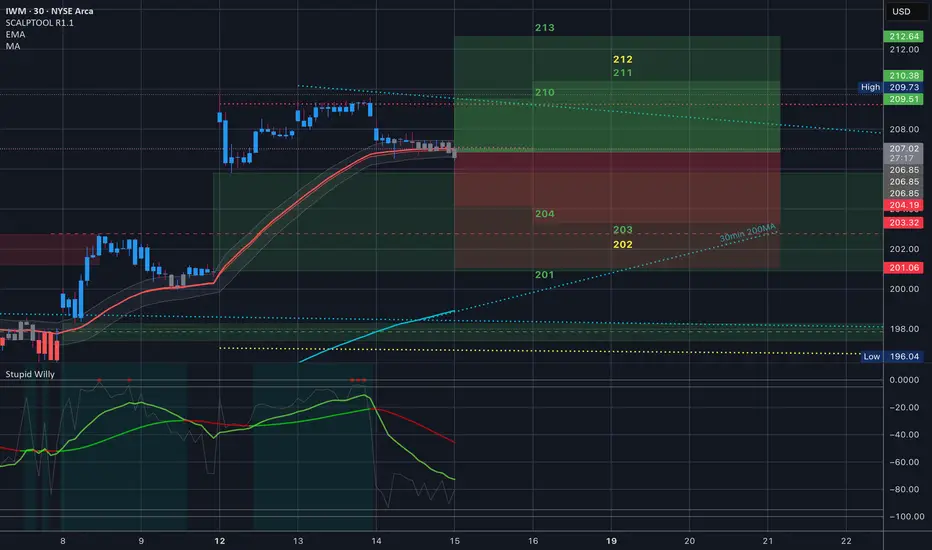
$IWM Analysis, Key Levels & Targets for Day Traders // May 15 25AMEX:IWM Analysis, Key Levels & Targets for Day Traders // May 15 25
Let's go, we had PPI in premarket w// Powell... Today's range looks fun.
$QQQ Analysis, Key Levels & Targets for Day Traders // May 15 25NASDAQ:QQQ Analysis, Key Levels & Targets for Day Traders // May 15 25
Let's go, we had PPI in premarket w// Powell... Today's range looks fun.

$SPY Analysis, Key Levels & Targets for Day Traders // May 15 25AMEX:SPY Analysis, Key Levels & Targets for Day Traders // May 15 25
Let's go, we had PPI in premarket w// Powell... Today's range looks fun.

SPY/QQQ Plan Your Trade For 5-15 : CRUSH PatternToday's CRUSH pattern could play out as a very big downward price move if the 578-580 level is broken. CRUSH patterns are usually very large-range price bars. Yes, they can be to the upside as well (depending on recent trending).
A CRUSH pattern is usually in the opposite direction of recent trends. Thus, I believe today's CRUSH pattern will be to the downside.
Although I believe today could be very exciting for traders, I urge all traders move with caution in the early 30min to 60min of trading today. I believe the SPY/QQQ will attempt to establish a range (early trading range), then work to break away from that range.
Traders should be very cautious of getting married into a direction/position in early trading. Let the market tell you where it wants to go.
Gold and Silver appear to have setup the Ultimate Low overnight. Now, we'll see if metals can move higher throughout the rest of this week and build a base for the next phase higher.
BTCUSD seems to have started to roll over (top), but I urge traders to stay cautious of the current upward FLAGGING trend. Until BTCUSD breaks below $96-97k, I would still consider it to be trending upward.
Going to be a busy day for me. Stay safe as I'll be on the road most of the morning.
GET SOME.
#trading #research #investing #tradingalgos #tradingsignals #cycles #fibonacci #elliotwave #modelingsystems #stocks #bitcoin #btcusd #cryptos #spy #gold #nq #investing #trading #spytrading #spymarket #tradingmarket #stockmarket #silver

Staring Down A Market Crash - $400 Target for SPY"B" waves are phonies. They are sucker plays, bull traps, speculators' paradise, orgies of odd-lotter mentality or expressions of dumb institutional complacency (or both). They often involve a focus on a narrow list of stocks, are often "unconfirmed" by other averages, are rarely technically strong, and are virtually always doomed to complete retracement by wave C. If the analyst can easily say to himself, "There is something wrong with this market," chances are it's a "B" wave.”
— The Elliott Wave Principle
In my last major idea for SPY, I predicted a bear market rally would take the price to $580 by early May. Now that we have arrived at the target, I am writing again to call for a major market reversal — a crash that will take SPY down to $400–$450 in the coming weeks. There are several factors that I am basing my assumptions on, and I will break them down briefly.
Before I do that, I would like to add to the quote above that I find B waves to be one of the most fascinating market phases. In larger degrees it is interesting to observe how sentiment changes over time and how price action can trick even seasoned traders into thinking the bear market has been vanquished, when in reality the worst lies ahead. In this instance, the collective euphoria is understandable; the trade war seems to be in retreat and inflation has remained tame. What is left to worry about? Who knows — but what I can say is that there are signs that there is still fear in the market and indices are currently at a level where they will be highly sensitive to any bad news.
Here is how I’m counting Wave (B) on the 200R ($2) chart. The price retraced to nearly 0.618 of A (0.382 level on the fib extension) and entered Wave C. I will admit that the PA in Wave C was confusing at first. As I mentioned in my previous idea, I expected the price in Wave (B) to rise to around 75% of Wave (A) and would spike above the daily 50/100/200 MAs. However, the uptrend was choppy and slow — held back by low volume and multiple traps for both sides. Fortunately, the further a trend moves along, the more clear it becomes. I am now counting Wave C of (B) as an ending diagonal, which is common in C waves.
In the diagonal, the price rose in five distinct waves once it entered the channel, with Wave (v) throwing over the top and being met with heavy resistance, which happens to be at the 1.618 extension of Wave A. While this is nearly a perfect diagonal per the rules, one issue I will point out is that Wave (iv) stopped just short of Wave (i) territory. Typically in a diagonal it should retrace into Wave (i); however, I’ll consider this to be close enough.
If the price were to move higher, the next target would be the 2.00 extension of A ($612.70). This would be near the previous ATH, which would signal a flat correction. While this is not impossible, I am going to stick with my initial instinct that the price will reverse around this level when other market indicators are taken into consideration. More on that later.
On the weekly chart, there is volume divergence and a major gap that was started this week at $570. Additionally, if Wave (B) were to end this week, it may end up with less volume than Wave (A). Since Wave (A) lasted for 8 weeks (a Fibonacci number), my box for Wave (C) is the next highest in the sequence — 13. This is just a guess, but if we were to see a similar pattern play out, AMEX:SPY should bottom out in late July or early August. The Weekly 200MA should be an important area of support, so be sure to keep an eye on that.
Also, do not forget to check the Monthly chart. Here we can see that April has a very long downside wick. I would expect to see this get filled in.
Lastly, on the daily chart, here is a recap of where we are in relation to my previous idea calling for $580 on SPY. As I predicted, the price popped above the 100MA and is finding resistance. The 100MA is ready to cross the 200MA, which can be thought of as a second death cross, if you will. I also have boxes here to show the unfilled gaps to the downside. With the trend being this exhausted, I would expect to see both get filled in soon.
Bearing all of this in mind, some people may argue that the technicals do not matter in this environment. After all, some of the headwinds that caused the first crash have dissipated and recession fears seem to be waning. While I won’t argue against any of that, there are other signs that the market is not out of the woods yet. Looking beyond SPY, TVC:US10Y has been on the rise and is on track to make a higher high. I’m targeting 5% over the coming weeks. I have another idea that looks more closely into this so I won’t elaborate any further in this post; however, this is one sign that institutions are risk-averse when it comes to the US economy.
The other component of this assessment is that the dollar appears to be heading lower. The chart above is inverted to more easily show what appears to be a classic impulse wave structure entering Wave 5, which could take TVC:DXY to the 1.618 extension of Wave 1 — around $96.68. If this were to play out, the dollar index would reach its lowest level since March 2022. This could spur a debt crisis where the Fed will have to make difficult decisions. If they start cutting rates to lower yields, it could also add further downside pressure to the dollar, which could make finding the right balance difficult. Keeping rates higher for longer and buying back Treasuries would be the preferred route, but Powell could face mounting political pressure to start making cuts if it seems the situation is getting out of hand, and could lead to more trouble down the road. This strain could be a possible fundamental backing for a stock market sell-off, so it is important to pay attention to.
Lastly, the final signs that indicate to me that a reversal is coming soon is that this uptrend is losing breadth. This is evident when looking at indices that are not weighted so heavily by mega cap tech stocks, such as TVC:DJI and $RUT. It was striking to see AMEX:DIA and AMEX:IWM down Tuesday and Wednesday while AMEX:SPY and NASDAQ:QQQ inched higher. On AMEX:DIA , the 100MA is starting to cross the 200MA and volume is picking up. Once tech starts selling off, we will see the other major indexes tumble.
I could keep going on and on, but you get the point. Here is TVC:VIX at a critical support level and starting to reverse higher. One last comment on B waves is that it is dangerous to follow the herd during times like these. Trust the technicals, and when something seems off — trust your instincts. We will never know what news is around the corner, but financial markets are so vast that we should assume that all factors known and unknown to the general public are being priced in real time.
As the next phase of the downtrend gets going, it will be easier to predict the bottom with greater accuracy. For now, I’m keeping the range wide and will look for $400–$450. As always, thank you for reading and let me know what you think.

Magnificent Seven: Still Magnificent? Or Diverging for Good?The Nasdaq 100 has bounced, but under the surface, the “Magnificent Seven” are no longer marching in sync.
And this divergence matters, especially if you’re trading QQQ or using it as a momentum proxy.
⚔️ Leadership Rotation in Real Time
- Nvidia (NVDA): Still a beast. Making fresh highs, clear institutional momentum.
- Microsoft (MSFT): Quiet strength — not flashy, but technically clean.
- Meta, Amazon: Holding up, consolidating after major runs.
- Apple (AAPL) and Tesla (TSLA): Weak links. AAPL can't find a bid. TSLA is stuck below major resistance.
Trading QQQ directly?
Consider weighting your thesis by what’s working under the hood.
- QQQ reclaimed the 200-day MA with the May 12's gap echoing the broader S&P move.
- Look for a retest of the resistance and the previous high of 540
- Play breakouts with confirmation, or mean-reverting pullbacks.
🧠 Final Take
The Magnificent Seven are splitting into two camps: those still driving the rally, and those dragging it.

Long Spy to 600The market is clearly in a bull run. I would expect a retest upwards of 590 with resistance at 600. Anything over 600 is a bonus, good luck traders.

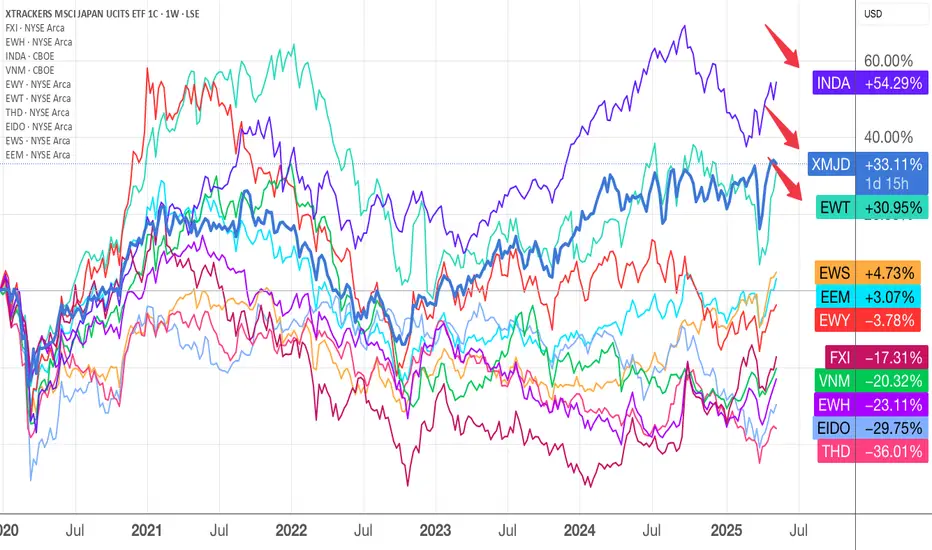
Going for the trees and not the forest in AsiaAsia is big and have many countries with different population size, economic growth, cycles and strong and weak sectors. A quick look at this chart reveals the top 3 countries ETF that you would have made better returns than the SPX would be the India, Japan and Taiwan ETFs.
Is that why WB is so keen to invest in the trading houses of Japan? Next to buying the same companies as WB (it would costs more for foreigners not having local access to Japan market)
the next best option is to buy an ETF. Do your homework, check the expense ratio, composition of companies, how the funds are invested, years of launch, funds size, etc.
As usual, please DYODD

Nightly $SPY / $SPX Scenarios for May 15, 2025 🔮 Nightly AMEX:SPY / SP:SPX Scenarios for May 15, 2025 🔮
🌍 Market-Moving News 🌍
📊 Producer Price Index (PPI) Release Today
The Bureau of Labor Statistics will release the April PPI data at 8:30 AM ET. This report will provide insights into wholesale inflation trends, following the recent Consumer Price Index data that showed inflation easing to a four-year low.
🛍️ Walmart ( NYSE:WMT ) Earnings Report
Walmart is set to release its earnings today, offering a glimpse into consumer spending patterns amid ongoing economic uncertainties. Investors will be watching closely for any indications of how inflation and trade policies are impacting retail performance.
👟 Foot Locker Acquired by JD Sports ( NASDAQ:JD )
JD Sports has officially acquired Foot Locker ( NYSE:FL ) for $1.6 billion ($24 per share). The deal aims to consolidate market share in the sportswear and athletic retail sector, with JD expanding its U.S. footprint. Foot Locker shares surged 67% premarket following the news.
💻 Nvidia ( NASDAQ:NVDA ) Faces AI Export Rule Implementation
The U.S. government's AI Diffusion Rule comes into effect today, potentially restricting Nvidia's chip sales to certain foreign markets. This regulatory change could influence Nvidia's stock performance and has broader implications for the tech sector.
📊 Key Data Releases 📊
📅 Thursday, May 15:
8:30 AM ET: Producer Price Index (PPI) for April
10:00 AM ET: Manufacturing and Trade Inventories and Sales for March
⚠️ Disclaimer:
This information is for educational and informational purposes only and should not be construed as financial advice. Always consult a licensed financial advisor before making investment decisions.
📌 #trading #stockmarket #economy #news #trendtao #charting #technicalanalysis

SCO Stock Chart Fibonacci Analysis 051425Trading Idea
1) Find a FIBO slingshot
2) Check FIBO 61.80% level
3) Entry Point > 19.2/61.80%
Chart time frame:D
A) 15 min(1W-3M)
B) 1 hr(3M-6M)
C) 4 hr(6M-1year)
D) 1 day(1-3years)
Stock progress: C
A) Keep rising over 61.80% resistance
B) 61.80% resistance
C) 61.80% support
D) Hit the bottom
E) Hit the top
Stocks rise as they rise from support and fall from resistance. Our goal is to find a low support point and enter. It can be referred to as buying at the pullback point. The pullback point can be found with a Fibonacci extension of 61.80%. This is a step to find entry level. 1) Find a triangle (Fibonacci Speed Fan Line) that connects the high (resistance) and low (support) points of the stock in progress, where it is continuously expressed as a Slingshot, 2) and create a Fibonacci extension level for the first rising wave from the start point of slingshot pattern.
When the current price goes over 61.80% level , that can be a good entry point, especially if the SMA 100 and 200 curves are gathered together at 61.80%, it is a very good entry point.
As a great help, tradingview provides these Fibonacci speed fan lines and extension levels with ease. So if you use the Fibonacci fan line, the extension level, and the SMA 100/200 curve well, you can find an entry point for the stock market. At least you have to enter at this low point to avoid trading failure, and if you are skilled at entering this low point, with fibonacci6180 technique, your reading skill to chart will be greatly improved.
If you want to do day trading, please set the time frame to 5 minutes or 15 minutes, and you will see many of the low point of rising stocks.
If want to prefer long term range trading, you can set the time frame to 1 hr or 1 day.

$UNG starting to accumulate a position. Swing TradeBuilding a position in unleveraged natural gas AMEX:UNG in $13-14's
Divergence on price/RSI.
Falling Wedge
Would like to see price get over and hold above daily 50MA
Will likely update once that is achieved
After 50MA is achieved and held, breakout the wedge and target the 200MA daily for profit.
Add on down days and be very patient with this one

TLT Longdemand Zone, confirmed once, not fresh
Long entry 85.3
no Stop ,
Target 94, 101
Risk management is much more important than a good entry point.
I am not a PRO trader.
In my trading plan, the Max Risk of each short term trade should be less than 1% of an account.

Everybody is bearish on bondsWell nothing to say here, everybody is bearish on bonds, so that’s the biggest bullish indicator.
TLT right now at big support, RSI showing bullish divergence.
Easy long. Don’t fall for the X and media narratives.
