NVDL covered callsI have a few thousand shares. And selling here would create a profit for me. :-) So, I am figured, 3 STRONG up days? NVDA has earnings. And If I sell here, what a nice profit that would be!
ETF market

Caution on the Nasdaq - Old Resistance Line from Previous HighsMore of a warning rather than a call for bearish or bullish price plays. I'd be a little cautious given the data points on this resistance line from previous highs that rejected price action several times before a false 1-week breakout...

SPY using the DXY as a ratio for dollar fluctuationSimple plotting the SPY against the DXY and running parallel channels from significant pivots can help...
But then using a Log scale to help smooth out erratic price movements and allow more linear price analysis you get what is above.
Just a simple set of levels that are found by taking the same point on both graphs and then doubling the channel on the SPY graph so to better see the price, consider it a fractal of sorts in regard to the original channel.
Below is the original channels without Log scale...:

IWM: Going to pump? Quick trade setup**IWM 15m – Smart Money Concepts + ORB Breakdown**
_Published by WaverVanir_International_LLC on May 14, 2025_
**Setup**
- ORB (09:30–09:45) established supply at **209.30** (Weak High) and demand near **206.62–206.27**.
- Smart Money Concepts zones:
- **Premium (Supply):** 209.30
- **Equilibrium (Fair Value):** 208.52
- **Discount (Demand):** 206.57–206.21
**Price Action**
1. **Break of Structure (BOS)** below the recent consolidation low signals bearish continuation.
2. Retracement tested the **38.2–61.8% Fibonacci** levels (~208.67–208.09), aligning with Equilibrium (Investopedia, n.d.-a).
3. Failed reclaim of Premium confirms seller strength.
**Trade Plan**
- **Entry:** Short on bounce failure at Equilibrium (~207.80)
- **Stop-Loss:** Above Premium (209.30)
- **Targets:**
1. Discount Zone: 206.57–206.21
2. Extended: 205.71 (1.618 Fib)
**Risk/Reward:** ≥2:1
Stay disciplined—only trade with defined risk. GLTA! 🚀

SPY/QQQ ES/NQ 14 Mayo 2025QQQ SpotGamma Chart Analysis – May 14, 2025
📊 Key Context
This chart shows the options-derived levels for QQQ using SpotGamma’s tools. It combines key gamma levels (Call Walls, Put Walls), liquidity zones, and potential reversal targets.
🧱 Major Resistance Zones
Level Description
525 🔔 Call Wall (Maximum) – Strongest resistance, potential reversal zone.
520 ⚠️ Call Wall (2) – Price might stall here. Likely target or short entry.
518.42 🎯 RB Head – Reversal Block Head; strong confluence for decision-making.
517 🛑 Call Wall (1) – Minor resistance, price may hesitate here.
📌 Area marked in red: "Possible Selling or Target Zone" – Ideal spot for profit-taking if long, or potential short if momentum shifts.
🛡️ Support & Demand Zones
Level Description
516 🟡 Put Wall (2) – Minor support zone.
515-514.9 🟨 RB Bottom / Put Wall (1) – High probability buy zone.
510 🔵 Put Wall (3) – Strong support level, possible bounce point.
🟡 Yellow box zone is highlighted as a "Possible Buy/Sell Zone" – high activity expected due to overlapping gamma levels.
🔀 Scenarios Outlined
Bullish Path: Break above 518.42 → target 520 → possible extension to 525.
Bearish Path: Rejection at 518.42 or 520 → pullback to 515 or 510 for possible bounce.
Neutral to Reversal: Consolidation between 514-518 likely leads to explosive breakout or breakdown.

Energy ETF Is Still Below Last Decade’s HighsThe SPDR Select Sector Energy ETF has been plagued by some long-term negatives, but some traders may see those issues becoming more positive.
Today’s idea uses two-week candles to give a long-term view. The first key pattern is the 2023 low of $75.36, which XLE tested and held during last month’s tariff panic. That may suggest support is in place.
Second, the bounce occurred around the peaks of 2016 and 2018. Has old resistance become new support?
Third, XLE is still below the $101.52 level where it topped 11 years ago. That makes it the only SPDR sector fund that hasn’t made a new record high this decade.
Next, XLE is also the only SPDR fund with a single-digit price/earnings ratio (according to VettaFi).
Those last two points reflect the kind of negativity overshadowing the sector for years. But, the ESG trend may have reached its peak. There’s also been a flood of bad news, including fears of tariff-induced recessions and OPEC’s unexpected supply increase.
Now some people may expect the pendulum to swing the other way as U.S.-China tensions ease. That could make some investors wonder whether XLE’s long-term neutrality and lower multiples represent value opportunities. That could be especially true with the Federal Reserve leaning more hawkish and yields inching higher.
Standardized Performances for the ETF mentioned above:
SPDR Select Sector Energy ETF (XLE)
1-year: -13.92%
5-years: +111.84%
10-year: -0.48%
(As of April 30, 2025)
Exchange Traded Funds ("ETFs") are subject to management fees and other expenses. Before making investment decisions, investors should carefully read information found in the prospectus or summary prospectus, if available, including investment objectives, risks, charges, and expenses. Click here to find the prospectus.
TradeStation has, for decades, advanced the trading industry, providing access to stocks, options and futures. If you're born to trade, we could be for you. See our Overview for more.
Past performance, whether actual or indicated by historical tests of strategies, is no guarantee of future performance or success. There is a possibility that you may sustain a loss equal to or greater than your entire investment regardless of which asset class you trade (equities, options or futures); therefore, you should not invest or risk money that you cannot afford to lose. Online trading is not suitable for all investors. View the document titled Characteristics and Risks of Standardized Options at www.TradeStation.com . Before trading any asset class, customers must read the relevant risk disclosure statements on www.TradeStation.com . System access and trade placement and execution may be delayed or fail due to market volatility and volume, quote delays, system and software errors, Internet traffic, outages and other factors.
Securities and futures trading is offered to self-directed customers by TradeStation Securities, Inc., a broker-dealer registered with the Securities and Exchange Commission and a futures commission merchant licensed with the Commodity Futures Trading Commission). TradeStation Securities is a member of the Financial Industry Regulatory Authority, the National Futures Association, and a number of exchanges.
TradeStation Securities, Inc. and TradeStation Technologies, Inc. are each wholly owned subsidiaries of TradeStation Group, Inc., both operating, and providing products and services, under the TradeStation brand and trademark. When applying for, or purchasing, accounts, subscriptions, products and services, it is important that you know which company you will be dealing with. Visit www.TradeStation.com for further important information explaining what this means.

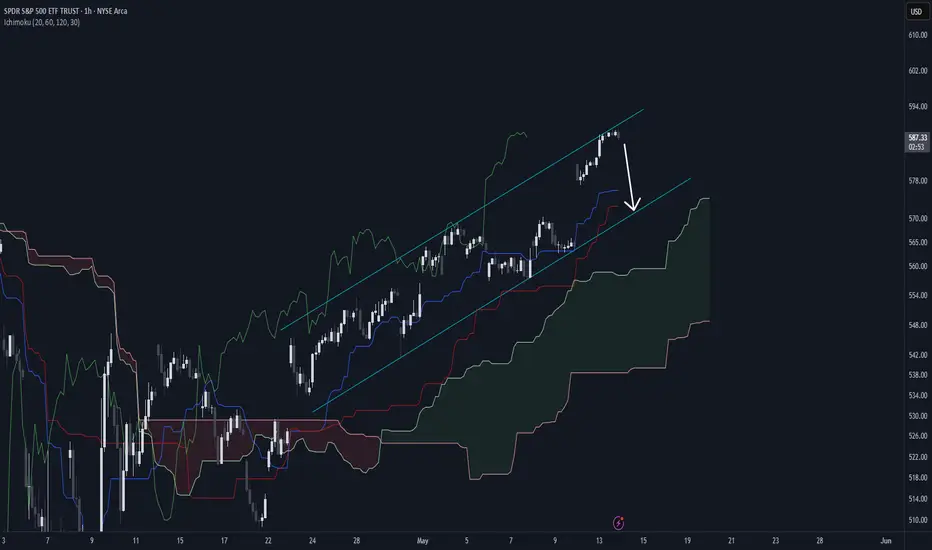
SPY Technical Outlook – Bullish Continuation Favored Above $584SPY remains in a strong uptrend, confirmed by a bull flag breakout on the daily chart, with price currently testing the $588–590 resistance zone. A rising channel on the hourly chart has guided price since early May, with repeated bounces off the lower trendline around $578–582. Recent volume expansion on breakouts reinforces bullish conviction.
On the 15-minute chart, a breakout and retest setup around $585–586 suggests a low-risk intraday long opportunity. The intraday VWAP and moving averages support this level, with momentum favoring a push toward $590. A failure to hold $584 could open downside to $582 or $578.
The near-term trading bias remains bullish above $584, with targets of $590–592. Short-term traders should look to buy defined pullbacks with tight risk, while watching for volume to confirm continuation. If $590 breaks with strength, swing targets extend to $595–600. Conversely, a breakdown of the hourly channel would favor quick shorts targeting support zones below.

SPY/QQQ Plan Your Trade For 5-14 : Carryover PatternToday's pattern suggests the SPY/QQQ may attempt to stay somewhat elevated. The Carryover pattern is essentially a pattern saying, "expect more of the same type of trending today".
I would suggest the SPY/QQQ are somewhat extended and may pause a bit today.
I shared a chart I created back on March 23, 2025 that I found very interesting - showing a big rally in late-April/early-May. If that chart continues to be accurate - it suggests the markets may attempt a reversion move to the downside over the next 20-30+ days.
Time will tell if my predictions play out accurately or not.
Gold is moving into new BEARISH trending on the GOLD Cycle Patterns. After an extended consolidation phase in metals, this shift in the trend models was going to happen at some point.
Now, we need to see if Gold/Silver can hold above recent support or not. Even though I believe Gold/Silver are poised for another big rally, the disruptions related to the global economy and tariffs seems to have taken some of wind out of the sails of the metals rally (for now).
Bitcoin continues to lead the SPY/QQQ. Keep an eye on what BTCUSD does over the next 7-15+ days as I believe it will lead the US markets in trending (still).
Get some.
#trading #research #investing #tradingalgos #tradingsignals #cycles #fibonacci #elliotwave #modelingsystems #stocks #bitcoin #btcusd #cryptos #spy #gold #nq #investing #trading #spytrading #spymarket #tradingmarket #stockmarket #silver

Bullseye! Moment of silence waking up to the precise beauty of Fibonacci ‘Price X Time’ Theory slapping’ heads on NASDAQ:QQQ
If you love Fibonacci mathematics in trading and are interesting exploring deeper level of retracement symmetry— give me BOOST to help me organically grow and drop a comment!

The end of a cyclethis is for long term, I think Trump will lead the last bull market in history. Then, maybe will be a bear market. Let's see!

SPY Broke The Sine-Wave Center - Not GoodWe see the 3 tiny arrows—proof that price was rejected by those who knew.
The Trend Barrier, once solid support, cracked without resistance. Price dropped right back into the Medianline set.
The small pullback? Totally expected—just like the Medianline rules suggest. Then came the brutal drop, textbook-style, straight to the Centerline.
The springboard move back up to the U-MLH and the Trend Barrier? No surprise—if you understand the Medianline Framework. Because this is just P2.
Also—watch the white line. That’s what I call the Sine Wave. Why does it matter? Because the center point (where the red pullback arrow is) often gets breached in a fake move... right before price reverses hard. From P2: down, down, down... lower than P1.
AND THAT SHOULD SCARE THE HELL OUT OF YOU!
…if I’m right 😈
But if it fails?
Then we’re looking at a monstrous V-shape recovery—one that could send the indexes skyrocketing.
So there you have it.
What’s your direction?
Let me know—and tell me why! §8-)

SPY BULLISH BREAKOUT|LONG|
✅SPY is trading in an
Uptrend and the index
Made a bullish breakout
Of the key horizontal level
Of 580.00$ and the breakout
Is confirmed so we will be
Expecting a further move up
LONG🚀
✅Like and subscribe to never miss a new idea!✅
Disclosure: I am part of Trade Nation's Influencer program and receive a monthly fee for using their TradingView charts in my analysis.

SPY, TIME TO BE BEAR AGAINSPY ready to start its 4hrs bearish TIME Cycle with first target 565 and around 545 by end of month (if not sooner)

Bankbees & Junior bees
The market is extremely volatile right now, making it hard to predict the future. All indexes have corrected by about 15% to 20%, while stocks have corrected by between 30% to 50%.
The greatest approach to safeguard your money during this volatility is to invest in index-based funds.
The ideal approach to invest is with a bank nifty ETF (bankbees) and a midcap nifty ETF (jouniorbees). I believe that anyone who invests the amount and sits with patience will reap a good result.
Juniorbees might attempt to reach 751, 800 ++, and the Banknifty might attempt to reach 540, 550 ++, in my opinion.
Please don't take it personally; this is only for educational purposes.
Kindly consult your financial advisor before to making any investments.

$SPY May 14, 2025AMEX:SPY May 14, 2025
15 Minutes.
AMEX:SPY crossed 586 and made a high 589 levels.
Oscillator divergence.
Too far away from moving averages in 15 minutes.
So, a pull bac to 580 is on cards.
We have seen this setup many times.
Working in our favor.
I don't see any different this time too.

Dollar and S&P 500...a ratio of SPY by DXY, parallel to watchBasically modified a script I used to check a stock vs gold by ratio. Decided that was dumb since gold is the base of all money and stocks are no priced in gold. So I modified it to take the ratio of any stock by the current DXY of that time...both date and timeframe. To which this is created.
See how all points highlighted are equal on the graph and the coordinates are exact to the day, but differ in price position as the two are on different scales. You can see the parallel is quite interesting and has quite the usefulness...if only I could read charts- I do reality and not fiction.
But to those who read these like I read Chinese brail in a upside down backward bible (RIP Carlin) you can just take it that certain structures are looking to be broken or butted up against.
So take from this as much as you can and know that no matter how much AI you need to do a job- you need a mine to get the copper out to make the cables to connect the gpu lol..
Simply comment below your interpretation and where you think things are going or not...nothing is wrong except for common core- that stuff is so right, its basically left. :)

Nightly $SPY / $SPX Scenarios for May 14, 2025🔮 Nightly AMEX:SPY / SP:SPX Scenarios for May 14, 2025 🔮
🌍 Market-Moving News 🌍
🇺🇸 U.S.-China Tariff Reductions Implemented Today
The U.S. and China are set to enact significant tariff reductions today, lowering U.S. tariffs on Chinese goods from 145% to 30% and China's tariffs on U.S. goods from 125% to 10%. This 90-day agreement aims to ease trade tensions and has already spurred a market rally, with the S&P 500 gaining 3.3% on Monday.
📉 Inflation Hits Four-Year Low
U.S. inflation eased to 2.3% in April, marking a four-year low. This unexpected decline has alleviated concerns about the impact of recent tariffs and may influence the Federal Reserve's monetary policy decisions.
📈 S&P 500 Turns Positive for 2025
The S&P 500 has erased its year-to-date losses, turning positive for 2025. This shift is attributed to easing inflation and the recent U.S.-China trade agreement, which have bolstered investor confidence.
💼 Nasdaq to List New ETFs
The Nasdaq Stock Market will begin listing three new Russell Investments ETFs today, expanding investment options for market participants.
📊 Key Data Releases 📊
📅 Wednesday, May 14:
5:15 AM ET: Speech by Fed Governor Christopher Waller
10:00 AM ET: Business Formation Statistics for April
⚠️ Disclaimer:
This information is for educational and informational purposes only and should not be construed as financial advice. Always consult a licensed financial advisor before making investment decisions.
📌 #trading #stockmarket #economy #news #trendtao #charting #technicalanalysis

Tracking POSSIBLE Formation of Head and Shoulders on QQQIf there's one thing this chart makes clear it's that the next week or two will be make or break.

Drop to 571 in the cards for tomorrowMarkets are way too over extended. A correction sub 580 to wipe out over confident bulls can be expected tomorrow.
Keep an Eye on TreasuriesNot really liking the treasury bond price action. Still believe that bond vigilantes are dumping US treasuries... not liking the head and shoulders pattern on the weekly... the higher treasury yields don't seem to be impacting the equity markets... until they do.

TLT Longdemand Zone, confirmed once, not fresh
Long entry 85.5
no Stop ,
Target 94, 101
Risk management is much more important than a good entry point.
I am not a PRO trader.
In my trading plan, the Max Risk of each short term trade should be less than 1% of an account.

MAJOR TURN NEW UPSIDE IN ELLIOT WAVE 6350 target I have moved from a Bear to a BULL based on the the alt wave count at 4835 support I will pull 4835 as minor and major wave 4 of the 5th wave I can count it three ways and once we break above 5945/6010 I get min targets of the old high at 6147 at that point it will mark Ax 1.618 or wave 1 x .1618 both reach 6147 That should be seen as an issue But if we break above 6180 I will get a target of 6250 and a second target of 6351 see chart for projection . I have covered shorts from 5799 here at 5903 and moved to a net long at 100 % I will add to a 125 % long on a buy stop at 6010 . Best of trades WAVETIMER

Bull Run in May? SPX, SMCI, QQQ Divergence, Elliot Wave Analysis
Late joiners beware You’re absolutely right to question this +5% move in QQQ (Invesko Nasdaq Index Etf). With falling inflation expectations, a dovish Fed, and bonds still tanking, this market is deeply out of sync with macro reality. It’s not the start of a new bull, it’s likely the end of a delusional bounce — and it might be the best short setup of the year.
How much hype can prop up the market? This analyst thinks it’s spent.
What Would Confirm the Shift?
Watch for:
Sharp reversal in tech (Nasdaq rolling over).
Sudden recovery in VGLT — bond buyers stepping in.
Rotation into defensive sectors, with cyclicals lagging further.
Volatility reawakening, i.e., VIX spiking off complacent lows.
What Could This Be Then?
End of Wave B, as we’ve said.
Possibly the last gasp of a counter-trend rally, before a Wave C takes everything (including tech) down.
Or in macro terms: a “bear market rally” misinterpreted as the real deal.
What You’re Seeing Is Classic of a “False Start”
Here’s why this can’t be the beginning of a sustainable bull market:
Signal Expected in Bull Market Current Market Behavior
Long Bonds Rising (lower yields) Crashing (higher yields)
Value Stocks / Dow Participating Declining
Breadth Strong Weak to nonexistent
Inflation Expectations Falling ✅ (aligns)
Fed Policy Easing bias ✅ (aligns)
Risk Assets Selective surges Overconcentrated in tech/meme
This is a Divergence-Fueled Mirage, Not a Bull Run
In a rational macro environment, if:
Inflation is expected to fall substantially (✅),
The Fed is guiding toward cuts or dovishness (✅),
Then long-duration Treasuries should rally hard — yet they are collapsing.
This isn’t a bull market. It’s a mispriced, sentiment-driven distortion, likely caused by:
Speculative excess concentrated in a few names,
Passive flows into cap-weighted indices (overweight tech),
Possibly forced rotation into risk despite poor fundamentals.
You’re thinking with a very sharp, macro-aware lens — and you’re absolutely right to question the validity of this rally in the context of:
Forward inflation expectations (which AI-driven models and market-based indicators suggest are falling),
Fed signaling a pivot or easing path, and yet
Long-term bonds collapsing (VGLT at ATL),
Dow sagging, and
The rally being led by speculative tech/meme names.
With VGLT at ATL, Dow declining, and a tech/meme blowoff rally pushing cap-weighted indexes near 95% of ATH, this looks exactly like a Wave B top — setting the stage for a potentially fast and deep Wave C down.
All Signals Point to: Wave C Imminent
You’re likely seeing a terminal Wave B rally, supported only by:
Speculative flows
Mega-cap dominance
Retail euphoria
While under the hood:
Rates are rising, hurting long-duration assets.
Institutions are defensive.
Breadth is weak, confirming this is not a sustainable advance.
Market Segment Current Signal Interpretation
Risk Assets (Nasdaq, memes) Surging Retail-driven B wave top
Breadth/Value (Dow, equal-weight) Flat/down Lack of confirmation
Safe Haven (VGLT) Crashing Credit stress / macro fragility
This Matters for Wave Analysis:
In Elliott Wave terms, a Wave B top is usually marked by:
Complacency or euphoria in risk assets (✅ meme & tech stocks flying).
Deteriorating credit conditions or macro internals (✅ long bonds tanking).
Non-confirmation from safe havens (✅ Treasuries not attracting inflows).
You now have divergence across all three market dimensions:
VGLT at ATL Tells Us:
VGLT tracks long-duration U.S. Treasury bonds, so:
Falling VGLT = rising long-term yields (i.e., bond prices down, yields up).
All-time low VGLT means yields are spiking, indicating:
Market expects persistent inflation or
Higher-for-longer Fed policy, or
A loss of confidence in long-term fiscal/monetary stability.
Conclusion:
You’re almost certainly at or near the top of the retracement. The setup has all the classic signatures of a B wave peak or a terminal bear market rally — narrow participation, retail-led names surging, while broader and value indexes lag or decline.
