SPY/QQQ Plan Your Trade For 5-13 : Rally 111 PatternToday's RALLY pattern suggests we will see continued upward price trending in the SPY/QQQ (and possibly BTCUSD).
I believe the continued positive news/announcements by the Trump administration is adding fuel for the current rally phase in the US markets. It is hard to ignore his tactics (like them or hate them). He is able to get things done in a way that many believe is disruptive.
Still, from what I'm hearing, the Chinese trade deal is a very broad and advantageous deal that somewhat "resets" the disparity the US has experienced for the past 20+ years with China. Overall, that is a very positive advancement in global trade.
Now, we'll have to see how the markets react to this news and is the hype is as good as the final trade deal.
Overall, the US markets are still climbing up the current FLAGGING formation (still BULLISH).
I see another Island (GAP) type of price move, which may prompt some consolidation - we'll see how things play out.
Gold and Silver are setting up double/triple bottoms across support.
BTCUSD is rallying higher within a similar FLAG formation to the SPY/QQQ.
In my mind, the markets are back to nearly where they were prior to the tariffs and early breakdown in late-February 2025. This is the "make or break" time for the markets.
Either the SPY continues higher and attempts to break above resistance - or it will start to fail over the next 5-10+ days and break downward.
Buckle up... and GET SOME.
#trading #research #investing #tradingalgos #tradingsignals #cycles #fibonacci #elliotwave #modelingsystems #stocks #bitcoin #btcusd #cryptos #spy #gold #nq #investing #trading #spytrading #spymarket #tradingmarket #stockmarket #silver
ETF market

S&P500 room for growth?If you compare S&P500 trend from 2025 with previous years, you might either see two things:
Room for growth. In that scenario, later in the year we might see again see some upwards trend again. Instead of the current more or less flat line. Similar t o the year 2020.
Or you could compare this year with recession of some sort like the year 2022. Where we would end up in an overall loss of this year.
China could potentially escalate a war between India & Pakistan.
But I'm a bit more optimistic now. I hope they will rather now have a trade deal with the US instead of a war. Easing the tension of the trading wars. Putting this whole context together, we might actually see a small plus (like 8-10%) YoY for 2025. Or even a solid 15-20%?
What do you think?
See:

$SPY May 13, 2025AMEX:SPY May 13, 2025
15 Minutes.
Holding 574 levels uptrend continues towards 586 initially.
600 is a possibility by next week expiry.
If 575 is broken, then 570 should provide a strong support.

SPY/SPX: FOMC. Do we get rate cuts or do we even get a hike?!TA on SPY but I also like playing SPX.
Was seeing this as either a rising wedge, and if play (with FOMC etc.) can touch and retest
551.41 then back move back up to test 562.81 and to out at 567.85 IF market reacts well to FOMC, maybe ATH?
If not, we actually fulfill that rising wedge to 543.54 with a small gap to touch/retest at 534.54
I may sit sidelines until FOMC to catch the move and waves. Always wait for the set up to come to you! One of the rules I try to keep following but I break.
Let me know what you think. Will continue to update as it the week progresses.
Again, do your own DD. Not financial advice.

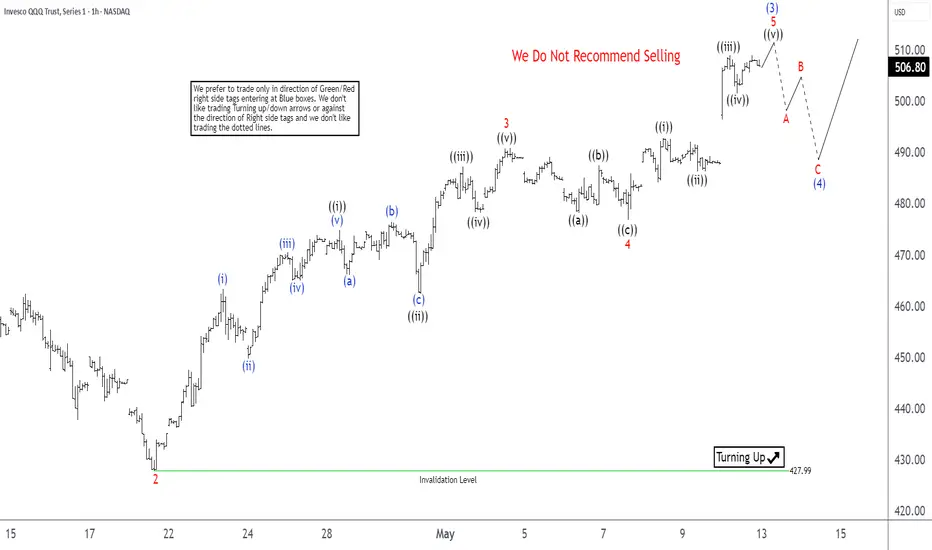
Nasdaq 100 ETF (QQQ) Poised for Extended ImpulseThe Nasdaq 100 ETF (QQQ) experienced a significant selloff following a tariff announcement, dropping from an all-time high of $540.81 to a low of $402.39 on April 7, 2025. This decline appears to be a corrective three-wave pullback, indicating that the market’s overall bullish trend remains intact. Since hitting this low, the ETF has reversed course and begun rallying, with the upward movement taking the form of a nested five-wave structure, suggesting strong bullish momentum.
From the April 7 low, wave (1) peaked at $443.14, followed by a pullback in wave (2) that bottomed at $404.44. The ETF then resumed its ascent in wave (3), which has further internal subdivisions. Within wave (3), wave 1 ended at $468.41, and wave 2 found support at $427.99. The ETF then extended higher in wave 3, which itself subdivided into smaller waves. Within wave 3, wave ((i)) reached $474.81, wave ((ii)) dipped to $462.43. Wave ((iii)) surged to $487.18, wave ((iv)) pulled back to $478.12, and wave ((v)) completed at $490.91, finalizing wave 3 of the higher degree. A corrective wave 4 then found support at $476.78.
Near term, the ETF is expected to complete wave 5, which should also conclude wave (3) of the larger structure. Following this, a corrective wave (4) is likely to retrace part of the rally from the April 9 low before the ETF resumes higher. As long as the pivot at $428 holds, any dips should find support in a 3, 7, or 11-swing pattern, supporting further upside. This analysis points to a bullish outlook for the QQQ, with potential for continued gains in the near term.
Slept on Stock of The Market? 100% on $SMCI… or 500% on $SMCX? NASDAQ:SMCI remains one of the most slept on stocks in the market, yet it shows over 100% upside from current levels. Its leveraged ticker, NASDAQ:SMCX , offers up to 500% return potential. My buy zone for NASDAQ:SMCX is $25.52, targeting $36 and $149.
It’s also possibly about to break out of a year-long trend line. And despite almost the entire market moving higher — this one has yet to find its momentum, which I believe it will soon.
I have a high conviction, so I’ll be giving it a shot. Feel free to let me know how you guys feel!
As always, invest safe!

Nightly $SPY / $SPX Scenarios for May 13, 2025🔮 Nightly AMEX:SPY / SP:SPX Scenarios for May 13, 2025 🔮
🌍 Market-Moving News 🌍
🇺🇸 CPI Data Release Anticipated
The Bureau of Labor Statistics is set to release the April Consumer Price Index (CPI) data today at 8:30 AM ET. Economists forecast a 0.3% month-over-month increase, following a 0.1% decline in March. Year-over-year, CPI is expected to remain at 2.4%, with core CPI holding steady at 2.8% .
🤝 U.S.-China Trade Truce Boosts Markets
Markets rallied on Monday after the U.S. and China agreed to reduce tariffs for 90 days, easing trade tensions. The Dow Jones Industrial Average surged 1,160 points (2.8%), the S&P 500 rose 3.3%, and the Nasdaq gained 4.4%. Major tech stocks like Amazon ( NASDAQ:AMZN ), Apple ( NASDAQ:AAPL ), Nvidia ( NASDAQ:NVDA ), and Tesla ( NASDAQ:TSLA ) saw significant gains .
📈 Coinbase to Join S&P 500
Coinbase Global Inc. ( NASDAQ:COIN ) will be added to the S&P 500 index on May 19, replacing Discover Financial Services. The announcement led to an 11% surge in Coinbase shares during after-hours trading .
💎 Sotheby's to Auction $20M Blue Diamond
Sotheby's Geneva is set to auction the "Mediterranean Blue Diamond," a rare 10-carat gem valued at $20 million, today. The auction has garnered significant global interest from collectors and investors .
📊 Key Data Releases 📊
📅 Tuesday, May 13:
8:30 AM ET: Consumer Price Index (CPI) for April
8:30 AM ET: Core CPI for April
4:30 PM ET: API Weekly Crude Oil Stock Report
⚠️ Disclaimer:
This information is for educational and informational purposes only and should not be construed as financial advice. Always consult a licensed financial advisor before making investment decisions.
📌 #trading #stockmarket #economy #news #trendtao #charting #technicalanalysis

Trading the Impulse Rally Retracement — Price and Time Symmetry This is a concept of decaying price and time as an underlying move towards our theoretical projection, where if the underlying enters our built faded cross-section, the SL is triggered to avoid sideways consolidation and decaying contract premiums.
This ‘right’ triangle that is ‘sclene’ by nature is created by taking the furthest projection in price/time symmetry (78.6%) and drawing a vertically placed straight line to the highest/lowest point in the rally previously identified. Here, I create a ‘right triangle’ by turning 90 degrees towards my final point, which is made by the nearest projection in price/time symmetry (38.2%). In its entirety, this forms the stop loss triangle.
Rules —
1. Enter position with strike of 38.5% retracement in price and expiration of +21 days past 78.6% retracement in time.
2. SL is LOW or HIGH in PRICE from rally. Structure invalidates with new low or high made that expands rally — this protects against price decay.
3. SL is STOP LOSS TRIANGLE cross-sectional zone built. Structure invalidates with horizontal extension into faded cross-section to protect against time decay.
The beauty of this concept is the ability to trade with rules the potential retracement in price/time symmetry distinctively and without emotion, as the underlying trades to potential harmonic reversals.

Into the closeJust a quick overview. The market is showing strength into the close, but it's possible we see a turnaround Tuesday tomorrow.

$IWM, small caps, not YET giving the "all clear"AMEX:IWM is the lone index still not in the clear 🚩 — backtesting its 200dma today and tagging the weekly mid-BB , just like in '22. Will it matter by week's end? If not, the bull is likely back across the board 🐂
This week's #CPI (Consumer Price Index) and #PPI (Producer Price Index) prints could significantly influence market direction across major indices — AMEX:SPY , NASDAQ:QQQ and AMEX:IWM — especially with rate cut expectations in flux. 🧵Here's how:
1. Hot CPI or PPI (above expectations):
AMEX:SPY : Likely to pull back as sticky inflation pressures broader S&P names, especially rate-sensitive sectors like real estate and utilities.
NASDAQ:QQQ : Could see sharper downside—tech stocks (many of which are high duration assets) are highly sensitive to interest rate expectations.
AMEX:IWM : Likely the hardest hit. Small caps suffer from tighter financial conditions and depend more on domestic borrowing costs.
🟥 Result: Bearish across the board, with small caps underperforming.
2. Cool CPI or PPI (below expectations):
AMEX:SPY : Broad lift, particularly in consumer discretionary and financials.
NASDAQ:QQQ : Strong rally—mega cap tech loves the prospect of lower yields.
AMEX:IWM : Outperforms if cooling inflation suggests easing ahead, since it's more leveraged to rate cycles and domestic growth.
🟩 Result: Bullish, with small caps possibly leading a relief rally.
3. In-line CPI/PPI :
Markets may stay choppy or consolidate, with AMEX:SPY and NASDAQ:QQQ more stable.
AMEX:IWM remains at risk of drifting lower unless there’s a strong dovish narrative from the Fed or other macro catalysts.
With small caps already lagging, this week’s inflation data could either validate its bearish divergence or spark a rotation rally if inflation
AMEX:SPY NASDAQ:QQQ TVC:VIX $ES_F $NQ_F $RTY_F TVC:TNX NASDAQ:TLT TVC:DXY #Tariffs #Stocks

SPY Long and NeutralCurrent demand Zone confirmed,
Long entry 520
no Stop ,
Target 550
Risk management is much more important than a good entry point.
I am not a PRO trader.
In my trading plan, the Max Risk of each short term trade should be less than 1% of an account.

S&P 500 | Long Bias | News-Driven Flow | (May 12, 2025)S&P 500 | Long Bias | Bullish Breakout & News-Driven Flow | (May 12, 2025)
1️⃣ Short Insight Summary:
The S&P 500 Futures reacted strongly to unexpected news, breaking out of a consolidation zone. This created a surprise rally that liquidated many short positions, opening the door for bullish continuation.
2️⃣ Trade Parameters:
Bias: Long
Entry: After breakout from triangle pattern on 30min chart
Stop Loss: Below breakout structure / recent local low (adjust to personal risk)
TP1: Recent highs before the sell zone
TP2: Extended bullish target based on upward momentum
Partial Exits: Near any previous resistance or psychological round numbers
3️⃣ Key Notes:
✅ The price action surged right after a bullish news update involving China, which the market hadn’t priced in—creating a sharp reaction.
✅ On the 5min and 30min charts, bullish structure is clearly forming.
✅ On the 4H and Daily charts, money flow is shifting from outflows to consistent inflows, signaling strength behind the move.
❌ This doesn’t mean it’s time to short—even if we're entering a previous sell zone, it’s more of a chance to secure partial profits rather than fight the trend.
4️⃣ Optional Follow-up Note:
This setup will be monitored closely. Will update if conditions shift or structure breaks down.
Please LIKE 👍, FOLLOW ✅, SHARE 🙌 and COMMENT ✍ if you enjoy this idea! Also share your ideas and charts in the comments section below! This is best way to keep it relevant, support us, keep the content here free and allow the idea to reach as many people as possible.
Disclaimer: This is not financial advice. Always conduct your own research. This content may include enhancements made using AI.

NDX Index Funds Vs Foreign NDX funds performance post rotationThis nothing but an idea I am publishing to track my performance for rotating profits in NDX funds into averaging down foreign funds in a retirement portfolio. I want to point out had taken profits previously and was trading bitcoin and GME with them until i found a candidate for rotation at a price point i liked.
I am neither bullish or bearish. The publication is for me others to learn how well rotation performs over time versus setting and forgetting.
Communications Sector: Spotlight on Netflix and VOX ETFThe communications sector has emerged as one of a key area of interest for investors, charged by technological innovation and evolving consumer habits. Amid recent market turbulence, certain companies and investment vehicles have demonstrated resilience and growth potential. Let’s take a closer look and explore two standout opportunities within this sector: Netflix, a streaming powerhouse, and the Vanguard Communication Services ETF ( AMEX:VOX ), a diversified play on the broader communications landscape. Let’s dive a little dipper into their performance, prospects, and what they may mean for investors.
Netflix: A Resilient Leader in Streaming
Netflix NASDAQ:NFLX has not only weathered the recent market downturn, but has also shown to us a notable growth. As a global leader in streaming services, Netflix boasts a massive subscriber base and an expansive content library, bolstered by its heavy investment in original programming. This strategy has paid off, the company consistently reporting strong financials, including growth in revenue and net income.
What sets Netflix apart- its adaptability. Despite a market pullback, that saw many stocks retreat from their 2021 highs, Netflix has capitalized on the shift toward digital entertainment-a trend accelerated by changing consumer preferences. Such success is often tied to broader dynamics, when influential policymakers or key industry figures maintain close connections with the communications market, companies like Netflix thrive. While this perspective is intriguing, the core driver of Netflix’s strength lies in its operational execution: robust subscriber growth, innovative content, and a global footprint.
However, there is challenge to note. The streaming space is increasingly crowded, with competitors like Disney+ and HBO Max (service owned by Warner Bros NASDAQ:WBD ) vying for market share. Rising competition could pressure Netflix’s pricing power and subscriber retention. Still, its proven resilience and content leadership make it a compelling option for investors seeking exposure to the communications sector’s growth narrative.
VOX ETF: Diversified Strength in Communications
For those preferring a broader approach, the Vanguard Communication Services ETF offers diversified exposure to the communications sector. VOX is a recommended pick for tapping into this space, tracking the Communication Services Select Sector Index. This ETF includes a mix of industry giants like Verizon NYSE:VZ , AT&T , and Walt Disney NYSE:DIS , spanning telecommunications, media, and internet services.
VOX’s appeal lies in its ability to capture sector-wide trends while mitigating company-specific risks. The communications sector is inherently dynamic. This is due in large part to technological advancements (5G rollout) and shifts in consumer behavior (cord-cutting and streaming). It’s a pretty favorable environment for such investments, particularly when media and communication channels gain prominence under influential leadership. While this macroeconomic angle adds context, VOX’s strength is more concretely tied to its diversified holdings and the sector’s long-term growth drivers.
Anyway, the sector isn’t without risks. Regulatory shifts, such as debates over net neutrality, and macroeconomic factors like interest rates can introduce volatility. Yet, for investors, VOX provides a balanced way to ride the sector’s upsides-offering stability through its so called blue-chip holdings and growth potential through its exposure to innovative subsectors like streaming and internet services.
A Market in Flux
The broader communications sector remains a hotbed of opportunity, especially in a market that sits roughly 5% above its 2021 highs after a significant decline. Companies tied to digital media and connectivity have shown staying power, even as others falter. Netflix’s growth and VOX’s steady performance underscore a key theme: the shift toward digital consumption isn’t slowing down.
Investment Takeaways
The communications sector offers compelling opportunities for investors with varying risk profiles. For those, seeking a focused investment in the dominance of streaming, Netflix stands out as a robust choice, underpinned by strong financials and a global footprint. Its growth potential is undeniable, though investors should remain mindful of competitive pressures from platforms like Disney+ and HBO Max. Alternatively, the Vanguard Communication Services ETF (VOX) provides a diversified avenue, balancing risk and reward by capturing the broader trends across telecommunications, media, and internet services. This ETF is well-suited for those looking to tap into the sector’s momentum without the volatility of individual stocks. Both Netflix and VOX underscore the enduring relevance of the communications sector, offering distinct pathways to stability and growth as the market navigates its current “storm”.
The communications sector is a vibrant arena, blending innovation with necessity. Whether you’re drawn to Netflix’s focused growth story or VOX’s broad-based approach, there’s room to engage with this sector’s potential. As always, weigh the risks-competition for Netflix and regulatory shifts for VOX. The data points to a sector poised for continued evolution.

Doesn't Seem FinishedHaven't posted here in a while, but here goes the usual blabber.
Moved from working in tech to FinTech, closer to the action now. But that came with a lot of realizations. Lot of reality checks pulverizing my forehead. Like most of us, I have become a lot more cynical with the system.
In the time I've spent trading, I haven't been wildly profitable. I am no longer young, but still have kept plenty of naivete and impulse. If I was one of the greats, I sure haven't realized it yet. I've traded since the day I turned 18, with some long breaks between. The plan was never to get rich, since my bankroll was always too small - it was to garner as much as pain and experience as I could, before I made some "real" money, so that I can bypass all the early mistakes most of us make before I incur serious, lifechanging losses. My first girlfriend's brother advised this, and it has arguably been one of the best decisions I have ever made. Thanks, Chad. If you ever find this by some miracle, hit me up for a Tsingtao. Same number, but not the same person anymore.
In the 7, almost 8 years of charting, yelling, disillusionment and spitting at Cramer, I've gone through almost every single emotion and experience a trader could have. I have made the dumbest decisions possible. I have fallen for stupid hype, and didn't act on high confidence trades that probably could've changed my life. I've sold and bought too early, too late, and just on time. I've bought high and sold low, and vice versa. I've gained nothing, and everything. I've lost the same. I'm not sure if I've found what I've set out to, but I'm sure as hell past the "Peak of Stupidity" in the Dunning-Kruger curve. I'm barely sure I know a single thing more than when I started, and that's proof I've progressed at least a tiny bit. I've studied and tried everything from Gann, Wave, Smart Money, Volume, setups, lines, curves, trend, moon cycles... and the paranoia of "market makers" most of us end up in. The truth and fact is that all these things are useful, and completely worthless as well.
In my short little life, I've seen people lose up to quarter of a million on a single trade. My ex-girlfriend's father all-inned at the top of Covid-19, and was convinced to sell near the bottom - they lost a house and a happy marriage over that. My coworker bought into CRYPTOCAP:DOGE Dogecoin/other memecoins at near the peak. His wife divorced him, and he still solicits me over text sometimes to try to get my opinion on some new shitcoin. In retrospect, my worst days are miniscule. In hindsight, all the insane losses I've punished myself and haunted myself with, was probably a penny to some of the richer kids I've met and befriended in college. I feel I have struggled so much, so hard for nothing over the years, with absolutely nothing to show for. My understanding is that there is no lottery ticket, no get-rich-quick scheme, no secret. We all know this, but we still hope. You either have to sell your soul, your life, or your dignity. Or all three. And most of the times, that's still not enough. I'm guilty of buying a few lottery tickets after a rough day, all to end up with some meaningless pieces of paper in my hand. Another $2 donated to the state.
After all these years, what I do have, however, is an ache. A desperation. A hope for something more. For what exactly? I'm sure none of us knows. Anything chased is never as good as we believe it'll be, and in that moment of realization, we only begin to yearn for something anew. And so, the cycle repeats ad infinitum.
I've let personal biases and emotions push and throw me around. Fair enough, sometimes they did lead me to some of my best trades. But often times, my worst. I'm sure we've all been there. There's no escaping that, ever. Every trader who talks of discipline and firmness of mind have never been truly broken before. You can't pretend there are no waves, and you sure aren't gliding over them; you ride alongside with them, and let them push and pull you to where you need to be. Trading against the tide is the dumbest thing we all do, and the most painful lesson you'll never stop learning.
The great thing about getting older is that you start to hurt less. You start caring less. You start accepting, rather than challenging. New things are scary and uncomfortable, and you no longer yearn for the excitement but rather the familiar. The reasonable. The simple and proven. I no longer stand in the pits or against the barriers, but in the edges and the balconies. I look down, and wonder why everyone is so difficult, so abrasive. Why can't we all sit down? My knees ache, and my back hurts. I think about how my beer costs far too much, and the emails I have to respond to tomorrow morning. I sigh, and put my concert earplugs on - can't risk losing any more hearing, or I won't be able to hear my Teams notifications.
This is all very great for risk adversity, but it kills the soul bit by bit, piece by piece. New music, new food, and new experiences are no longer as gratifying. Neuroplasticity has taken a hit, and so has my receptors. I can't remember ever feeling more bored by beautiful things until today, and I know tomorrow is only the same, but worse. We require more, spend more, yearn more as we grow, but find ourselves ever so less gratified. Our beautiful wives become just our wives, and the money is our bank account is always too small. A trip to the middle of the desert in college seemed like a dream, now a trip to Hawaii seems... inadequate.
I'm sure now, $20 at 20 is worth something close to $300 at 30. Put that against the SPY, will you?
Anyways, enough rambling. I have another high conviction call for you. Something I have enough "Fuck You" money to bet on, and my first "grown-up" play. I have made some bad calls before, and some I've probably been so right I could have been halfway to retirement by now. This is closer to the latter, I'm sure of it.
I'm not going to bother explaining everything - it's a huge waste of time like this post, and anyone interested enough should do their own due diligence. God, I sound like you guys now. Keywords are Miran, Triffin Dilemma, and my strong belief that BRICS will never put together a functioning currency. Taiwan vs China, India vs Pakistan, Ukraine vs Russia. All should wrap up soon. The tariff gambit with China and the rest of the nations is all noise, as it concluded today, for yet another 90 days. Technical indicators show a massive downtrend pending on monthly, and the market is hunting for a reason. Divergence in shorter timescales.
Worst comes to worst, maybe I'll convert back to Christianity if everything goes to shit. Give up all my material possessions, become a monk. The pope is from Chicago, and I just moved here. Perhaps a sign, but the market tells me it's a coincidence. But I'm sure my girlfriend wouldn't appreciate that, and being Korean, perhaps Buddhism would suit me better anyways.
I also changed my name, by the way. Why the hell not. Life is short, better go trading.

$TQQQ - Small moonThe AI has been triggered on TQQQ and UVXY. Calls on TQQQ and puts on UVXY.
The models i have on these have a sharpe of around 3.4-3.6 which means these are almost guaranteed money making trades as long as your entry point is good.
I'm waiting for confirmation before i go in but i'm likely to enter this trade really hard. The AI suggests ITM Calls at around 57.5 and 60 a month out. You can trade QQQ for this as well for similar equivalent strikes and expiries.

$SPY still bearish unless $584 and trendline break as resistanceI'll be the first to admit that the rally has gone further than I expected. That said, everything on the chart still looks like this is a bearish rally and not a new bull trend.
Unless we can break the blue trend line and the strong overhead resistance between $581.63 and $583.57, I think the most likely scenario is we fall further and see one last leg down before we bottom.
I think the bottom will come between the lower supports at $409 and $538.
Again, invalidation of the bearish idea is a break and flip of the resistances above, the upside targets are on the chart as well.
Let's see what happens over the coming weeks.

Trading Journal $GDX Bought as it tried breaking out...
Sold due to news event with US and China agreeing on 90 day pause trade deal. GLD reversed, markets went up..
Instituiton likely to sell their position and move into the companies now

SPY/QQ QQQ Gamma Map & Playbook (May 12, 2025)
General Context:
The chart is showing a post-gap continuation with early selling pressure.
Gamma exposure zones are defined with Call Walls, Resistance Bands (RB), and Volume Area levels.
This setup helps identify key decision zones for both long and short plays.
🔑 Key Gamma Levels (as per SpotGamma):
Level Type Price Commentary
Zero Gamma 482 Below this level, volatility likely increases.
Vol Trigger 484 Risk-on above this line.
Put Wall 450 Major downside protection.
Call Wall (Max) 500 Magnet level for market makers.
RB Head 508 / 505 Resistance Bands: potential short zones.
RB Bottom 487.59 Major support if price collapses.
Volume Area High 20756 Key volume resistance from futures.
📈 Scenarios Projected on Chart:
🅰️ Bullish Scenario
Bounce from 500 → Consolidation → Breakout through 505 → Target: RB Head 508.72
This move would likely trap shorts near 500 and push toward high gamma area.
🅱️ Bearish Scenario
Failure to hold 500 → Drop to 495-493 → Bounce attempt.
If weak, price may test the yellow box zone (Possible buy/sell area) near RB Bottom
SPY/QQQ Plan Your Trade for 4-12 : Rally In CountertrendIn today's video, I try to highlight the TREND features in the SPY CYcle Pattern data window for all of you to use.
Yesterday, I received a comment from a friend/client asking about the strength in the markets compared to my expectations.
My answer was simple. The SPY Cycle Pattern data window shows Short-Term (ST), Long-Term (LT) trending as well as the Daily/Weekly Bias trends.
Traders should use these to determine the primary trend/direction of price action.
Additionally, I try to add my own thoughts/context related to the market setup/structure. That is where I teach you about the EPP/Cradle patterns and more.
Ideally, my analysis and the SPY Cycle Patterns align with the future price moves in a way that everyone can profit from the highest probability outcomes.
There are times when news or outside forces drive the market trend beyond my expectations and, in some cases, beyond the SPY Cycle Pattern predictions. This recent Trump-Pump rally may be one of those cases.
Either way, I continue to try to deliver the best technical analysis and research I can offer for followers.
Get some.
#trading #research #investing #tradingalgos #tradingsignals #cycles #fibonacci #elliotwave #modelingsystems #stocks #bitcoin #btcusd #cryptos #spy #gold #nq #investing #trading #spytrading #spymarket #tradingmarket #stockmarket #silver

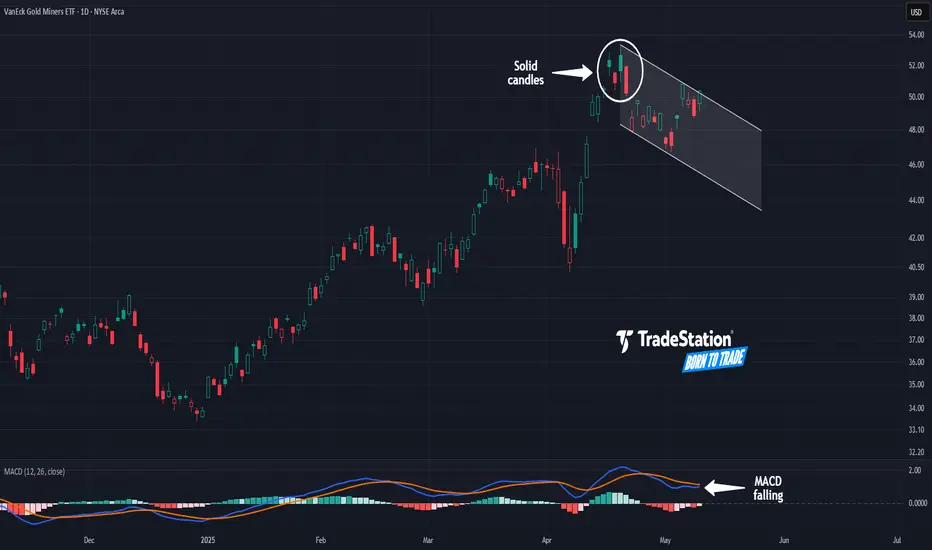
Gold Miners May Be FatiguedThe VanEck Gold Miners ETF had a major breakout in March, but some traders may think it’s getting fatigued.
The first pattern on today’s chart is the series of candles on April 16-22. Those bars occurred at the highest levels in almost four years. They’re also solid, illustrating that price wasn't able to hold the peaks.
Second, GDX fell sharply afterwards and made a lower high last week. That could mean April represented a peak. It could additionally suggest a new downward channel is taking shape.
Third, MACD is falling.
Next, gold and gold miners have benefited from the uncertainty caused by tariffs. Now, with signs of the trade war easing, some traders may find less appeal in the yellow metal.
Finally, GDX is an active underlier in the options market. (It averages more than 140,000 contracts per session, according to TradeStation Data.) That could help traders take positions with calls and puts.
Standardized Performances for the ETF mentioned above:
VanEck Gold Miners ETF (GDX)
1-year: +47.93%
5-years: +51.92%
10-year: +143.71%
(As of April 30, 2025)
Exchange Traded Funds ("ETFs") are subject to management fees and other expenses. Before making investment decisions, investors should carefully read information found in the prospectus or summary prospectus, if available, including investment objectives, risks, charges, and expenses. Click here to find the prospectus.
TradeStation has, for decades, advanced the trading industry, providing access to stocks, options and futures. If you're born to trade, we could be for you. See our Overview for more.
Past performance, whether actual or indicated by historical tests of strategies, is no guarantee of future performance or success. There is a possibility that you may sustain a loss equal to or greater than your entire investment regardless of which asset class you trade (equities, options or futures); therefore, you should not invest or risk money that you cannot afford to lose. Online trading is not suitable for all investors. View the document titled Characteristics and Risks of Standardized Options at www.TradeStation.com . Before trading any asset class, customers must read the relevant risk disclosure statements on www.TradeStation.com . System access and trade placement and execution may be delayed or fail due to market volatility and volume, quote delays, system and software errors, Internet traffic, outages and other factors.
Securities and futures trading is offered to self-directed customers by TradeStation Securities, Inc., a broker-dealer registered with the Securities and Exchange Commission and a futures commission merchant licensed with the Commodity Futures Trading Commission). TradeStation Securities is a member of the Financial Industry Regulatory Authority, the National Futures Association, and a number of exchanges.
Options trading is not suitable for all investors. Your TradeStation Securities’ account application to trade options will be considered and approved or disapproved based on all relevant factors, including your trading experience. See www.TradeStation.com . Visit www.TradeStation.com for full details on the costs and fees associated with options.
Margin trading involves risks, and it is important that you fully understand those risks before trading on margin. The Margin Disclosure Statement outlines many of those risks, including that you can lose more funds than you deposit in your margin account; your brokerage firm can force the sale of securities in your account; your brokerage firm can sell your securities without contacting you; and you are not entitled to an extension of time on a margin call. Review the Margin Disclosure Statement at www.TradeStation.com .
TradeStation Securities, Inc. and TradeStation Technologies, Inc. are each wholly owned subsidiaries of TradeStation Group, Inc., both operating, and providing products and services, under the TradeStation brand and trademark. When applying for, or purchasing, accounts, subscriptions, products and services, it is important that you know which company you will be dealing with. Visit www.TradeStation.com for further important information explaining what this means.
Short Setup for Weak Healthcare Sector- Current Price: $132.68
- Price Targets:
- **T1**: $129.66
- **T2**: $127.98
- **S1**: $134.70
- **S2**: $137.56
- Recent Performance:
Healthcare Sector ETF (XLV) has declined 4.22% in the past week, breaking
beneath key support levels. On an annual basis, the ETF has plunged 29%,
reflecting sustained weakness in the healthcare industry. Biotech has been the
hardest-hit subsector, exacerbating XLV’s bearish trend. The ETF’s short- and
long-term underperformance positions it as one of the weakest sectors within the
broader market.
- Expert Analysis:
Bearish sentiment across healthcare continues to dominate, with biopharma
declines further weakening investor confidence. Experts warn against
anticipating recovery absent substantial fiscal stimulus or regulatory
incentives for the sector. Breaching support of $131.56 signals an elevated risk
of further selling pressure unless sentiment reverses drastically.
- News Impact:
No noteworthy catalysts or events have emerged to counteract healthcare’s
sector-wide weakness. Investors should remain vigilant toward earnings reports,
governmental changes, or policy adjustments, as these could present upside risks
or exacerbate downside trends.

Riding on the US- China trade talk in GenevaRead this news article here
Go long on these two ETFs. Different in composition , see which one you like better. Hold for longer term.
