SPY/QQ QQQ Gamma Map & Playbook (May 12, 2025)
General Context:
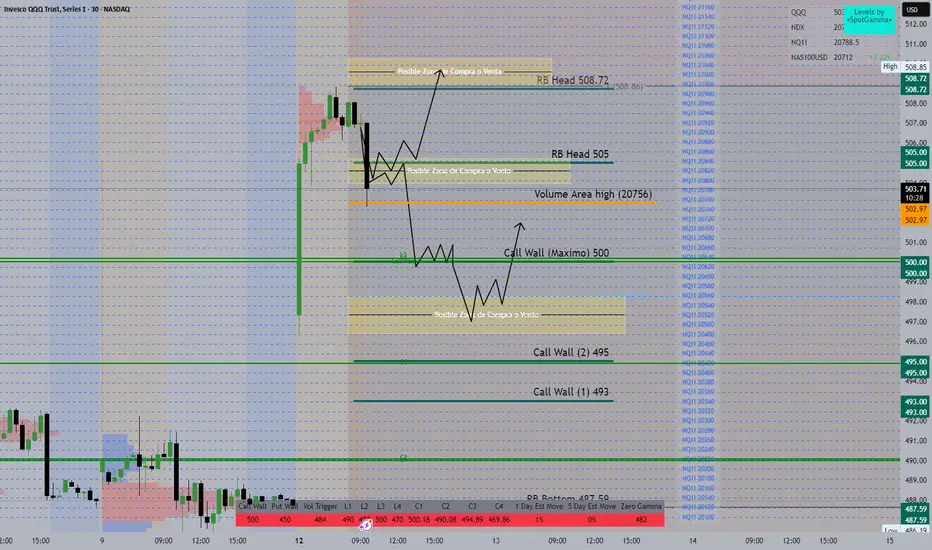
The chart is showing a post-gap continuation with early selling pressure.
Gamma exposure zones are defined with Call Walls, Resistance Bands (RB), and Volume Area levels.
This setup helps identify key decision zones for both long and short plays.
🔑 Key Gamma Levels (as per SpotGamma):
Level Type Price Commentary
Zero Gamma 482 Below this level, volatility likely increases.
Vol Trigger 484 Risk-on above this line.
Put Wall 450 Major downside protection.
Call Wall (Max) 500 Magnet level for market makers.
RB Head 508 / 505 Resistance Bands: potential short zones.
RB Bottom 487.59 Major support if price collapses.
Volume Area High 20756 Key volume resistance from futures.
📈 Scenarios Projected on Chart:
🅰️ Bullish Scenario
Bounce from 500 → Consolidation → Breakout through 505 → Target: RB Head 508.72
This move would likely trap shorts near 500 and push toward high gamma area.
🅱️ Bearish Scenario
Failure to hold 500 → Drop to 495-493 → Bounce attempt.
If weak, price may test the yellow box zone (Possible buy/sell area) near RB Bottom
ETF market
SPY/QQQ Plan Your Trade for 4-12 : Rally In CountertrendIn today's video, I try to highlight the TREND features in the SPY CYcle Pattern data window for all of you to use.
Yesterday, I received a comment from a friend/client asking about the strength in the markets compared to my expectations.
My answer was simple. The SPY Cycle Pattern data window shows Short-Term (ST), Long-Term (LT) trending as well as the Daily/Weekly Bias trends.
Traders should use these to determine the primary trend/direction of price action.
Additionally, I try to add my own thoughts/context related to the market setup/structure. That is where I teach you about the EPP/Cradle patterns and more.
Ideally, my analysis and the SPY Cycle Patterns align with the future price moves in a way that everyone can profit from the highest probability outcomes.
There are times when news or outside forces drive the market trend beyond my expectations and, in some cases, beyond the SPY Cycle Pattern predictions. This recent Trump-Pump rally may be one of those cases.
Either way, I continue to try to deliver the best technical analysis and research I can offer for followers.
Get some.
#trading #research #investing #tradingalgos #tradingsignals #cycles #fibonacci #elliotwave #modelingsystems #stocks #bitcoin #btcusd #cryptos #spy #gold #nq #investing #trading #spytrading #spymarket #tradingmarket #stockmarket #silver

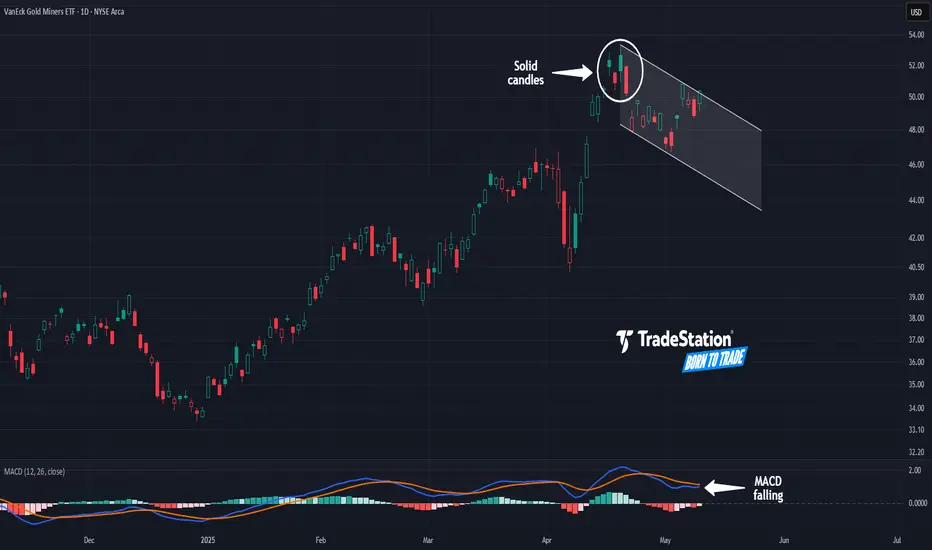
Gold Miners May Be FatiguedThe VanEck Gold Miners ETF had a major breakout in March, but some traders may think it’s getting fatigued.
The first pattern on today’s chart is the series of candles on April 16-22. Those bars occurred at the highest levels in almost four years. They’re also solid, illustrating that price wasn't able to hold the peaks.
Second, GDX fell sharply afterwards and made a lower high last week. That could mean April represented a peak. It could additionally suggest a new downward channel is taking shape.
Third, MACD is falling.
Next, gold and gold miners have benefited from the uncertainty caused by tariffs. Now, with signs of the trade war easing, some traders may find less appeal in the yellow metal.
Finally, GDX is an active underlier in the options market. (It averages more than 140,000 contracts per session, according to TradeStation Data.) That could help traders take positions with calls and puts.
Standardized Performances for the ETF mentioned above:
VanEck Gold Miners ETF (GDX)
1-year: +47.93%
5-years: +51.92%
10-year: +143.71%
(As of April 30, 2025)
Exchange Traded Funds ("ETFs") are subject to management fees and other expenses. Before making investment decisions, investors should carefully read information found in the prospectus or summary prospectus, if available, including investment objectives, risks, charges, and expenses. Click here to find the prospectus.
TradeStation has, for decades, advanced the trading industry, providing access to stocks, options and futures. If you're born to trade, we could be for you. See our Overview for more.
Past performance, whether actual or indicated by historical tests of strategies, is no guarantee of future performance or success. There is a possibility that you may sustain a loss equal to or greater than your entire investment regardless of which asset class you trade (equities, options or futures); therefore, you should not invest or risk money that you cannot afford to lose. Online trading is not suitable for all investors. View the document titled Characteristics and Risks of Standardized Options at www.TradeStation.com . Before trading any asset class, customers must read the relevant risk disclosure statements on www.TradeStation.com . System access and trade placement and execution may be delayed or fail due to market volatility and volume, quote delays, system and software errors, Internet traffic, outages and other factors.
Securities and futures trading is offered to self-directed customers by TradeStation Securities, Inc., a broker-dealer registered with the Securities and Exchange Commission and a futures commission merchant licensed with the Commodity Futures Trading Commission). TradeStation Securities is a member of the Financial Industry Regulatory Authority, the National Futures Association, and a number of exchanges.
Options trading is not suitable for all investors. Your TradeStation Securities’ account application to trade options will be considered and approved or disapproved based on all relevant factors, including your trading experience. See www.TradeStation.com . Visit www.TradeStation.com for full details on the costs and fees associated with options.
Margin trading involves risks, and it is important that you fully understand those risks before trading on margin. The Margin Disclosure Statement outlines many of those risks, including that you can lose more funds than you deposit in your margin account; your brokerage firm can force the sale of securities in your account; your brokerage firm can sell your securities without contacting you; and you are not entitled to an extension of time on a margin call. Review the Margin Disclosure Statement at www.TradeStation.com .
TradeStation Securities, Inc. and TradeStation Technologies, Inc. are each wholly owned subsidiaries of TradeStation Group, Inc., both operating, and providing products and services, under the TradeStation brand and trademark. When applying for, or purchasing, accounts, subscriptions, products and services, it is important that you know which company you will be dealing with. Visit www.TradeStation.com for further important information explaining what this means.
Short Setup for Weak Healthcare Sector- Current Price: $132.68
- Price Targets:
- **T1**: $129.66
- **T2**: $127.98
- **S1**: $134.70
- **S2**: $137.56
- Recent Performance:
Healthcare Sector ETF (XLV) has declined 4.22% in the past week, breaking
beneath key support levels. On an annual basis, the ETF has plunged 29%,
reflecting sustained weakness in the healthcare industry. Biotech has been the
hardest-hit subsector, exacerbating XLV’s bearish trend. The ETF’s short- and
long-term underperformance positions it as one of the weakest sectors within the
broader market.
- Expert Analysis:
Bearish sentiment across healthcare continues to dominate, with biopharma
declines further weakening investor confidence. Experts warn against
anticipating recovery absent substantial fiscal stimulus or regulatory
incentives for the sector. Breaching support of $131.56 signals an elevated risk
of further selling pressure unless sentiment reverses drastically.
- News Impact:
No noteworthy catalysts or events have emerged to counteract healthcare’s
sector-wide weakness. Investors should remain vigilant toward earnings reports,
governmental changes, or policy adjustments, as these could present upside risks
or exacerbate downside trends.

Riding on the US- China trade talk in GenevaRead this news article here
Go long on these two ETFs. Different in composition , see which one you like better. Hold for longer term.

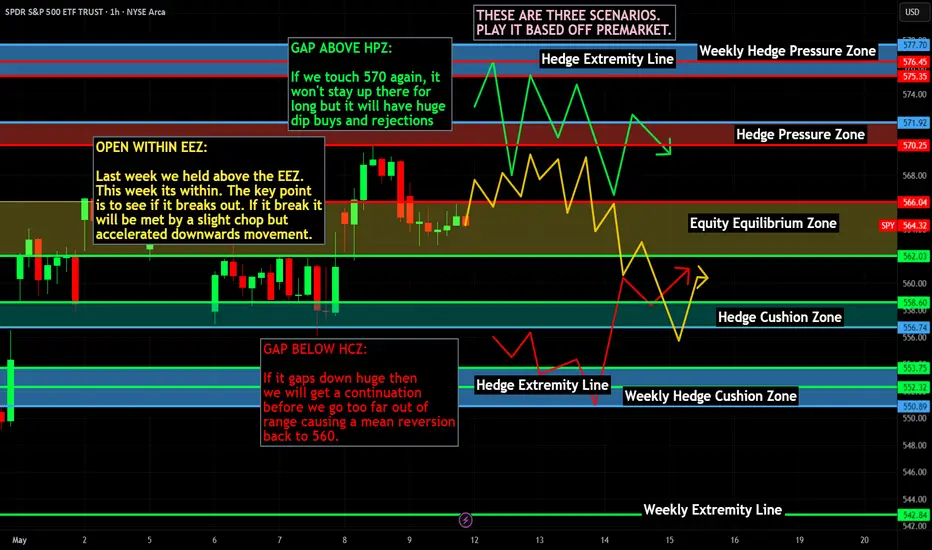
SPY WEEKLY 12 MAY 2025Welcome to Spy weekly. I have tried my best to explain the price action here. If you have any doubts, feel free to leave a comment or DM me.
NOTESTAY AWAY FROM OPTIONS

Tesla Euphoria to Capitulation and Back AgainOver the past 12 months, Tesla’s price action reads like a three-act drama:
Euphoria (Nov ’24 – Dec ’24)
Rampant Breakout: After a multi-month range, TSLA erupted from low-20s to a peak near $42, driven by record deliveries and renewed growth optimism.
Blue Zone Strength: The blue-shaded sessions on the right highlight a powerful institutional bid, lifting price steadily with few pullbacks.
Capitulation (Jan ’25 – Mar ’25)
Profit Taking & Macro Headwinds: Q4 earnings misses, rising rates, and softer comps triggered a swift retreat. TSLA plunged from $40 to sub-$10 in roughly ten weeks—an 80% drawdown that shook even the most ardent bulls.
Failed Bounce Attempts: Multiple red “S” markers at lower highs underscored sellers’ resolve, hammering out a vicious downtrend.
Accumulation & Base Building (Mar ’25 – May ’25)
Triple Bottom Formation: Notice the three “bottom” labels around $6.13 (the P0 pivot and prior yearly low). Each test showed shrinking volatility and thinner red candles, classic signs of selling exhaustion.
Dynamic Support Holds: The turquoise dots hugging the lows trace TSLA’s dynamic falling-wedge support. By early April, price chopped sideways in a $6–$10 band, consolidating losses.
2. Technical Set-Up: A Coiled Spring
As of today, TSLA has climbed back to $11.34, probing critical pivots:
Near-term Resistance:
Monday’s High (~$11.85) – the first hurdle for bulls. A decisive break above would flip short-term supply into demand.
Dynamic Fib Resistance (~$10.35 & $9.96) – these falling-wedge levels have already been cleared, validating the nascent turn.
Support Floors:
Monday’s Low (~$10.35) – now a springboard for buyers.
Base of the Wedge (~$6.13) – every retest here was met with bids, marking a reliable long-entry zone on deep pullbacks.
Volume & Momentum:
Recent green candles have come on elevated volume relative to March lows, suggesting fresh participation.
The slope of higher lows in the turquoise dynamic support dots indicates improving momentum across daily and 5 m timeframes.
3. Market Sentiment & Catalysts
Earnings & Guidance: With Tesla’s Q1 numbers due in the next two weeks, earnings season could be the spark that sends TSLA either flying through $12 or knocking it back to the wedge.
Macro Backdrop:
Rate Outlook: Any dovish pivot from the Fed could flood liquidity back into “growth-at-a-reasonable-price” names like TSLA.
EV Adoption Narrative: New model announcements or manufacturing milestones (e.g., Cybertruck ramp) would reinforce the long thesis.
4. Strategic Takeaways
Aggressive Players: A break and close above $11.85–$12.00 on daily charts could be used as a fresh long trigger, targeting $14 (year-open pivot) and then $18–$20 as institutional accumulation zones.
Risk-Managed Entries:
Pullback Buyers: A retrace to the former Monday low (~$10.35) is a lower-risk entry with a stop just under $9.95 (the next dynamic fib level).
Option Plays: For defined risk, out-of-the-money calls near $12 expiring in 4–6 weeks may capture an earnings-driven surge.
Defensive Stance: If price fails at $11.85 and closes back below $10.35, the pattern risks returning to the base at $8–$9, so profits should be booked or stops widened accordingly.
5. Conclusion: Coiled for a Move
After the brutal drawdown earlier this year, Tesla’s chart now portrays a textbook falling-wedge resolution into a higher-low base, punctuated by multiple “bottom” labels and dynamic support tests. Approaching the $12 threshold, the stock is coiled like a spring: either it unleashes into a new leg up toward $14+ on strong participation, or it reverses into a tighter range, offering fresh long entries nearer $10.
In short: TSLA’s journey from euphoria to despair and through disciplined accumulation has set the stage for its next directional verdict. Watch $11.85–$12.00—and manage risk around the former week’s pivots—to navigate what could be a decisive inflection in Tesla’s 2025 saga.

Weekly $SPY / $SPX Scenarios for May 12–16, 2025 🔮 Weekly AMEX:SPY / SP:SPX Scenarios for May 12–16, 2025 🔮
🌍 Market-Moving News 🌍
📊 Inflation and Retail Sales Data in Focus
Investors are closely watching this week's release of the Consumer Price Index (CPI) on Tuesday and Retail Sales data on Thursday. These reports will provide insight into inflation trends and consumer spending amid ongoing tariff concerns.
🤝 U.S.-China Trade Talks Resume
High-level trade discussions between the U.S. and China are set to continue this week in Switzerland. The outcome of these talks could significantly impact global markets and investor sentiment.
💼 Key Corporate Earnings Reports
Major companies including Walmart ( NYSE:WMT ), Cisco ( NASDAQ:CSCO ), Applied Materials ( NASDAQ:AMAT ), and Take-Two Interactive ( NASDAQ:TTWO ) are scheduled to report earnings this week. These reports will offer insights into consumer behavior and the tech sector's performance.
🏦 Federal Reserve Speeches
Federal Reserve Chair Jerome Powell is scheduled to speak on Thursday, with other Fed officials also making appearances throughout the week. Their comments will be analyzed for indications of future monetary policy directions.
📊 Key Data Releases 📊
📅 Monday, May 12:
No major economic data scheduled.
📅 Tuesday, May 13:
8:30 AM ET: Consumer Price Index (CPI) for April
📅 Wednesday, May 14:
10:30 AM ET: EIA Crude Oil Inventory Report
📅 Thursday, May 15:
8:30 AM ET: Retail Sales for April
8:30 AM ET: Producer Price Index (PPI) for April
8:30 AM ET: Initial Jobless Claims
9:15 AM ET: Industrial Production and Capacity Utilization
10:00 AM ET: Business Inventories
2:00 PM ET: Federal Reserve Chair Jerome Powell speaks
📅 Friday, May 16:
8:30 AM ET: Housing Starts and Building Permits for April
10:00 AM ET: University of Michigan Consumer Sentiment Index (Preliminary) for May
S&P Global
⚠️ Disclaimer:
This information is for educational and informational purposes only and should not be construed as financial advice. Always consult a licensed financial advisor before making investment decisions.
📌 #trading #stockmarket #economy #news #trendtao #charting #technicalanalysis
Worst is behind for QQQ and SPXA textbook Bear flag with proper breakdown and reached the target.
Now the market is ranging to decide where to go. Whatever the price action will be, there will be suitable news on TV afterwards don't worry.
Looking purely at the charts, QQQ should recover between 488-510 area.
The two big volume days at the end of the pattern target convinced me we are on the way up for now, whether its a trap or not remains to be seen.
Cheers

EEM outperformance = a bearish dollar betClear correlation between the performance of the DXY and the out performance of the EEM index against SPY


SPY My Opinion! SELL!
My dear friends,
Please, find my technical outlook for SPY below:
The price is coiling around a solid key level - 564.32
Bias - Bearish
Technical Indicators: Pivot Points Low anticipates a potential price reversal.
Super trend shows a clear sell, giving a perfect indicators' convergence.
Goal - 539.96
Safe Stop Loss - 577.94
About Used Indicators:
The pivot point itself is simply the average of the high, low and closing prices from the previous trading day.
Disclosure: I am part of Trade Nation's Influencer program and receive a monthly fee for using their TradingView charts in my analysis.
———————————
WISH YOU ALL LUCK

QQQ: Bearish Continuation & Short Trade
QQQ
- Classic bearish formation
- Our team expects pullback
SUGGESTED TRADE:
Swing Trade
Short QQQ
Entry - 488.06
Sl - 502.54
Tp - 461.77
Our Risk - 1%
Start protection of your profits from lower levels
Disclosure: I am part of Trade Nation's Influencer program and receive a monthly fee for using their TradingView charts in my analysis.
❤️ Please, support our work with like & comment! ❤️

COULD THIS STOCK MARKET BULL CYCLE END BY SEPTEMBER 2025?In this video, we look at AMEX:SPY on the weekly and monthly charts to determine how much longer can this current 2023-2025 bull run can last

SPY weekly thoughts for May 12th - 16th. Trump Pump?What’s up traders — this is my first idea post here on TradingView, and I’m hyped to finally share something with the community. In this breakdown, I’ll be covering a few key areas I’m watching:
🟩 Support zones
📉 Resistance levels
🕯️ Weekly candle behaviour
🌍 Macro outlook and possible catalysts
📌 Important notes
⚠️ My current bias
Let’s jump in:
🟩 Support Zones:
Buyers are still showing up strong in that $505–$507 range(I highly doubt their orders will get filled lol). it had been a reliable bounce zone — we’ve seen repeated wicks rejecting that level and price snapping back VERY quickly.
Above that, $550 has developed into a new area of support, and right now that’s my main level to watch. If that gives out, I expect we’ll head back down to test the $507 zone again. But for now, bulls are doing their job.
📉 Resistance
SPY keeps getting stuck around $573–$575. That zone’s been tested a few times now, but buyers haven’t been able to push it through. Sellers are stepping in there almost every time.
🕯️ Weekly Candle Context
That’s three straight weekly closes below resistance. Bulls get some momentum mid-week, but by Friday, sellers take over. It’s showing signs of a stall — like the market’s running out of gas near the top.
🌍 Macro Outlook – What Could Move Things
There’s been some talk of softer trade discussions and early negotiations with China. If any of that turns into a real deal, it could be the spark SPY needs to finally break above resistance.
But on the flip side — if Trump starts pushing new tariffs (even smaller ones), those moves tend to hold stocks back, especially in tech.
So the big question is:
Can SPY hit new highs if tech keeps cooling off and there’s pressure from new trade policy?
That’s the tug-of-war right now — possible upside from improving global relations, but real downside risk from political decisions.
📌 Things I’m Watching:
A weekly close above $575 would shift me to a bullish bias.
If we lose $550, I’ll be watching closely to see how price behaves near $507.
⚠️ Current Bias
Right now I’m FAIRLY neutral with a slight bullish lean, but very excited for this next weekly candle.
The macro setup looks like it could support a move higher, but I’m staying decently cautious until we get a clear weekly breakout(+575) and close above resistance.
Let me know what you think — and if you’re watching the same levels.

Stock Market Forecast | TSLA NVDA AAPL AMZN META MSFTStock Market Forecast | CME_MINI:NQ1! NASDAQ:QQQ AMEX:SPY CME_MINI:ES1!
Mag 7 Forecast | NASDAQ:TSLA NASDAQ:NVDA AAPL AMZN META MSFT GOOG

SPY: Short Signal Explained
SPY
- Classic bearish setup
- Our team expects bearish continuation
SUGGESTED TRADE:
Swing Trade
Short SPY
Entry Point - 564.32
Stop Loss - 575.90
Take Profit - 539.83
Our Risk - 1%
Start protection of your profits from lower levels
Disclosure: I am part of Trade Nation's Influencer program and receive a monthly fee for using their TradingView charts in my analysis.
❤️ Please, support our work with like & comment! ❤️

QQQ The Target Is DOWN! SELL!
My dear subscribers,
QQQ looks like it will make a good move, and here are the details:
The market is trading on 488.06 pivot level.
Bias - Bearish
My Stop Loss - 499.48
Technical Indicators: Both Super Trend & Pivot HL indicate a highly probable Bearish continuation.
Target - 464.95
About Used Indicators:
The average true range (ATR) plays an important role in 'Supertrend' as the indicator uses ATR to calculate its value. The ATR indicator signals the degree of price volatility.
Disclosure: I am part of Trade Nation's Influencer program and receive a monthly fee for using their TradingView charts in my analysis.
———————————
WISH YOU ALL LUCK

$SPY AMEX:SPY - Possible inverse H&S forming. Dip into May and, then rally into early July if it plays out.

SPY (S&P500 ETF) - Testing Key Resistance Levels - Weekly ChartSPY (S&P500 ETF) is currently attempting an uptrend rally, bouncing up from the April 7th 2025 support level ($488) and weekly support trendline.
The current resistance price level is $569 above, and the support price level below is $555.
SPY price needs to remain and close above $522 in May 2025 to maintain the current uptrend rally.
Resistance price targets above: $569, $578, $600, $610.
Support price targets below: $555, $542, $533, $512.
Tariff and trade deal news, corporate earnings, government law changes, and consumer sentiment will continue to affect the stock price action of SPY.
Support price levels need to hold for an uptrend to continue in 2025.

BIG Weekend drop coming for SPYMarket reeled in the bulls very nicely this week.
Compression has completed, and a nasty move to the downside is coming early next week.
First target: 555
Second target: 545
Third target: 538

The Best Analysis in the World...You might be shocked by the accuracy of this analysis — so much so that you won’t even know what to do next. Because yes, you could be just one step away from becoming a millionaire... and missing that moment is painful.
But don’t worry — I’m here, and I won’t let that happen.
This legendary setup is called The Golden Lizard, and trust me, it’s not here to play games. Don’t underestimate it. Please, stay calm... and don’t faint. 💥🦎💰

UVXY shortVIX above regular range
After SPY quick down, VIX is high, there might be sideway consolidation.
Short entry 40
Stop 50,
Target 35
Risk management is much more important than a good entry point.
I am not a PRO trader.
In my trading plan, the Max Risk of each short term trade should be less than 1% of an account.
