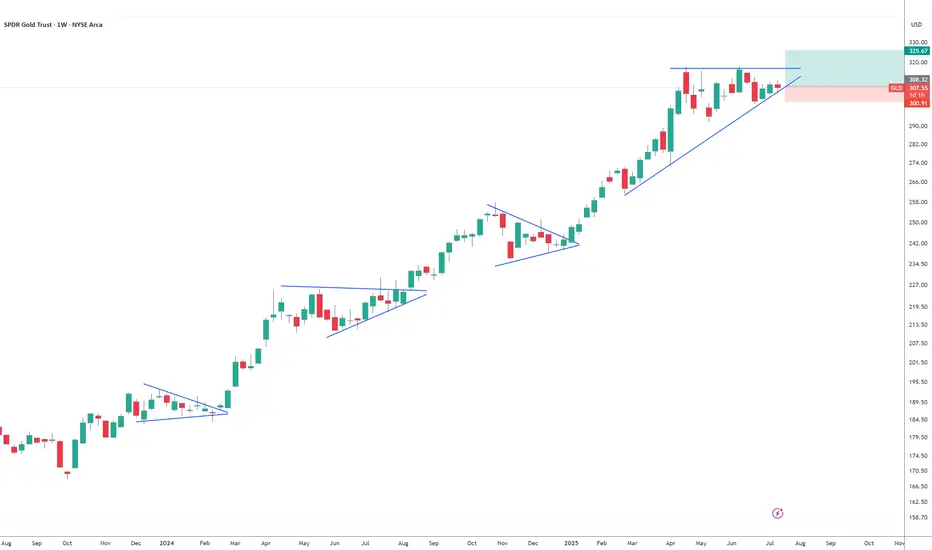
Gold!!!!!Looks like GLD is setting up for a big move to the upside. It likes to consolidate for a few weeks before a massive breakout. I have some GLD calls strike 310 for September 19. My SL triggers if a weekly candle closes under trendline. TP 325 ish.
ETF market
Do we continue the wedge…Bonds have been hit hard and Crypto at Ath trend lines, do we need to finish the wedge
interesting set-up UVIXNew alert of UVIX....recent spikes yesterday, area of consolidation and nicely set-up.
We'll see, but seems very compelling!

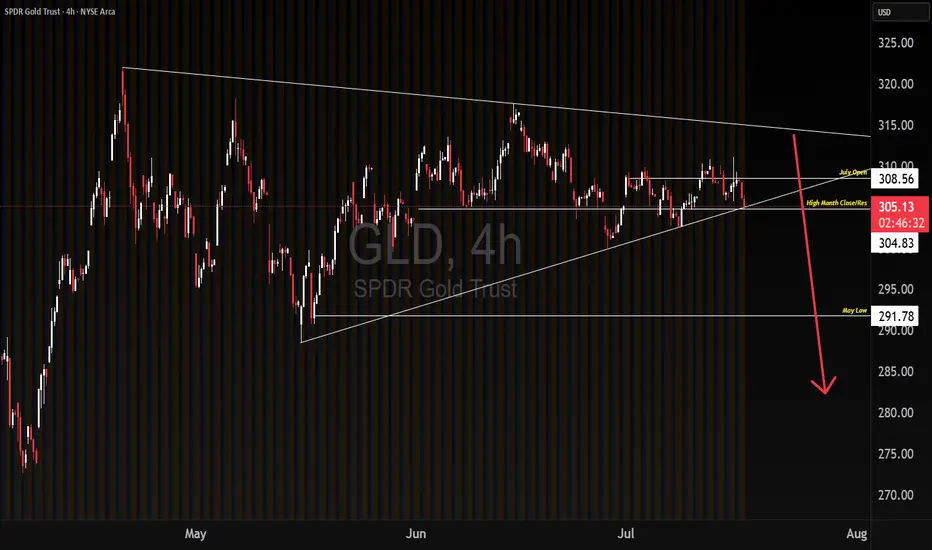
GLD potential break downWe could be experiencing a break down on GLD based on capital outflows, going into riskier markets. If this larger time frame range break down holds, and we get continuation lower on downside momentum, we get a measured move target of May's low. Will be watching to see if the breakdown is a bear trap first. If it is not a bear trap, I will buy OTM Jan 26 puts. Targeting May's low
SOXL — Buying on a Strong Uptrend with 30%+ Profit PotentialDirexion Daily Semiconductor Bull 3x Shares (SOXL) continues to move in a clear uptrend after breaking long-term resistance. Price is consolidating above the breakout level, indicating sustained interest from major market participants.
Long positions remain valid.
Profit targets:
First target — 39.85
Second target — 60.42
The setup offers over 30 percent profit potential. The semiconductor sector continues to lead the broader market higher.
Focus on trading with the trend. Adding on pullbacks is reasonable with proper risk management in place.

Climbed too fast to the top of the channel?Weekly chart on log - looks like its already topped out and will likely hit one of those targets in the coming weeks. Maybe a test or slight break above channel before going down.

Is it too late to enter China market now ?www.cnbc.com With articles like this, suddenly all those who claims China market was "uninvestable"are sitting up and taking a closer look at this market again.
For those who have followed me, please refer to my past posts on HSI and FXI and various Chinese companies, most listed in HK but some in China as well.
The one sector that I remain bearish is the property market and I have no short to mid term plans to enter into it. There are however many interesting sectors , especially pharmaceutical, healthcare related stocks that I am interested to explore.
Buying into an ETF like FXI gives you a broader exposure to the blue chips companies that are financially stable and diversify into different sectors like automotive, IT, e-commerce, consumer staples, healthcare ,etc. Then, if you are still interested in China related stocks, you can dive into individual company and invest as well. Higher risk higher returns.
As usual, please DYODD

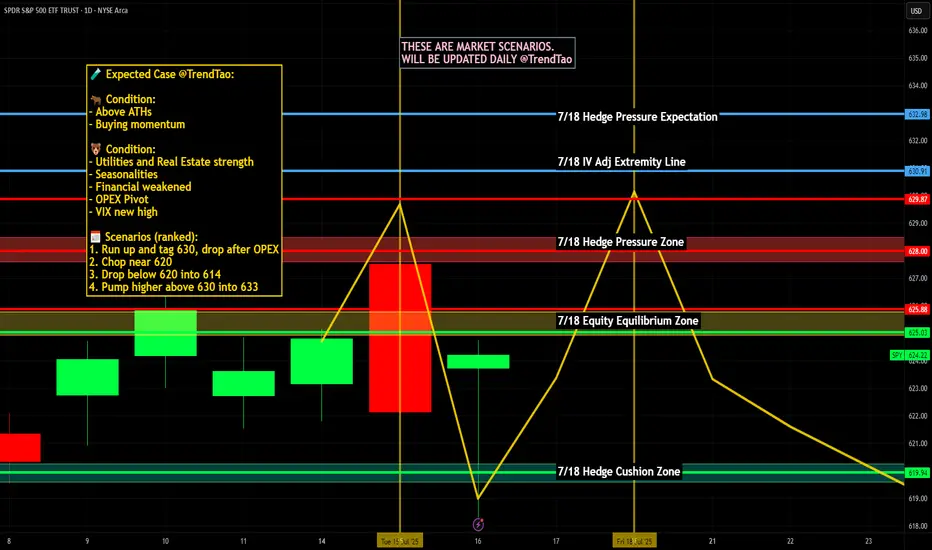
Nightly $SPY / $SPX Scenarios for July 17, 2025🔮 Nightly AMEX:SPY / SP:SPX Scenarios for July 17, 2025 🔮
🌍 Market-Moving News 🌍
🇮🇳 India–U.S. Inflation Divergence Dampens Dollar
India’s June retail inflation tumbled to a six-year low, while U.S. CPI hit its fastest pace since February—driven by tariff effects. This divergence is weakening the U.S. dollar against the rupee, pushing down dollar‑rupee forward premiums
📜 Treasury to Ramp Up T-Bill Issuance
Following the recent debt-ceiling increase, the U.S. Treasury plans to issue over $1 trillion in T-bills over the next 18 months. Money-market funds, flush with cash, are expected to absorb the supply, which could influence short-dated yields
💱 Dollar Eases Amid Fed-Related Volatility
Headline news that President Trump “highly unlikely” to fire Fed Chair Powell, coupled with stable PPI data, calmed markets. The dollar dipped slightly after earlier turmoil, while gold and bonds saw modest gains
📊 Key Data Releases & Events 📊
📅 Thursday, July 17:
(No major U.S. economic releases)
Markets will track T-bill issuance plans, dollar forward dynamics, and statements from the Treasury and Fed regarding debt and rate strategy.
⚠️ Disclaimer:
This is for educational purposes only—not financial advice. Consult a licensed financial advisor before making investment decisions.
📌 #trading #stockmarket #economy #dollar #tbills #inflation #Fed #technicalanalysis
Uranium miners in relation to energy and adjusted for spot priceThe Miners keep making more and more money.!
They could become cash cows

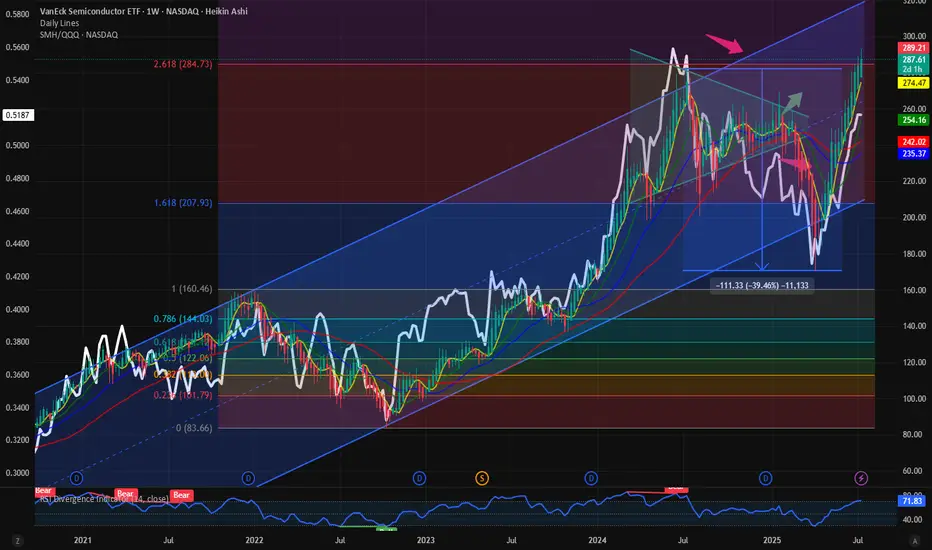
$SMH / $QQQ: Ratio below ATH; Still more room for upside It’s the semis which are the hallmark of a cyclical bull market. It is always the Semis which indicate the start of a bull market and the first to fold over towards the end of a cyclical bull market. Hence the outperformance of Semis as a momentum sector is important from a symbolism perspective and from a market indicator perspective.
When the semis outperform the NASDAQ100 we have momentous bull markets. Today we looked at the ratio chart between NASDAQ:SMH vs $QQQ. This measures the relative outperformance or the underperformance of Semis over the broader NASDAQ100.
This ratio of NASDAQ:SMH / NASDAQ:QQQ touched its ATH on June 2024. Since then, the Semis lost momentum with NASDAQ:NVDA and NASDAQ:AVGO going sideways for a year. Now the momentum is on the side of Semis. Even if the NASDAQ:SMH is at 287 $ and at ATH with price is at its 2.618 Fib Retracement level, still the NASDAQ:SMH / NASDAQ:QQQ is not at its ATH. The ratio is currently @ 0.5. Before we hit 0.56 in the ratio chart just like last June 2024, SMH must outperform the NASDAQ100. If that must happen what should be the price of NASDAQ:SMH ? My prediction is the ratio NASDAQ:SMH / NASDAQ:QQQ tops @ 0.56 and NASDAQ:SMH goes to 400$ this year.
Verdict: Long NASDAQ:SMH over $QQQ. NASDAQ:SMH / NASDAQ:QQQ tops 0.56. NASDAQ:SMH price target 400$.
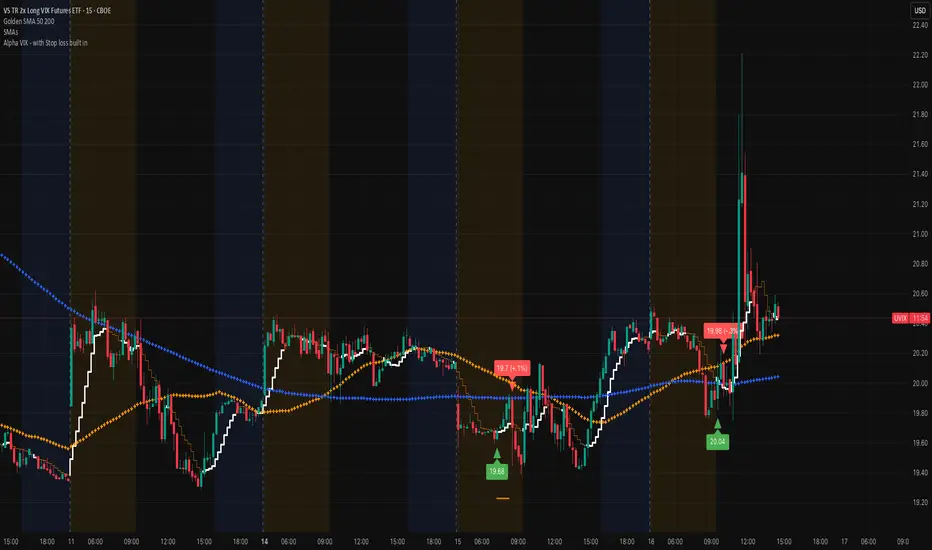
UVIX marching on (VIX proxy)Very nice spike this morning, that's typically a sign that there's more volatility in the works. Remember that we are at record lows on the VIX and that doesn't stay in this region for a long time. Add the Alpha VIX indicator to help you get an entry. The economy is brittle and staying focused on the VIX is a very nice play!
Best of luck and DM if you have any questions.....
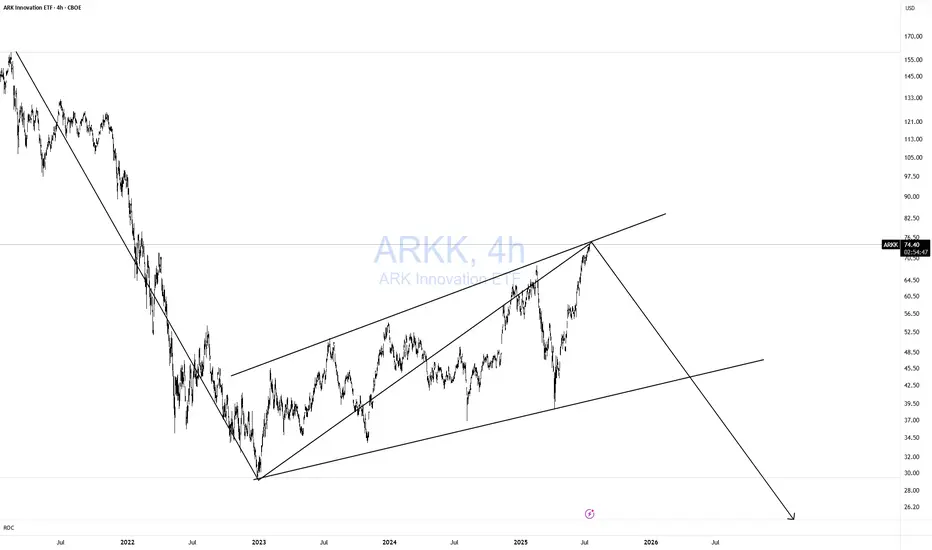
ARKK DOOMED!Classic 123 wave move down! As I like to say Short when no one else is looking! Not when everyone is looking. TOO LATE!
Simple but very effective pattern with excellent risk-reward. Remember, I am a macro trader, so don't expect to see a return on this investment tomorrow.
I won't get into the macro stuff.
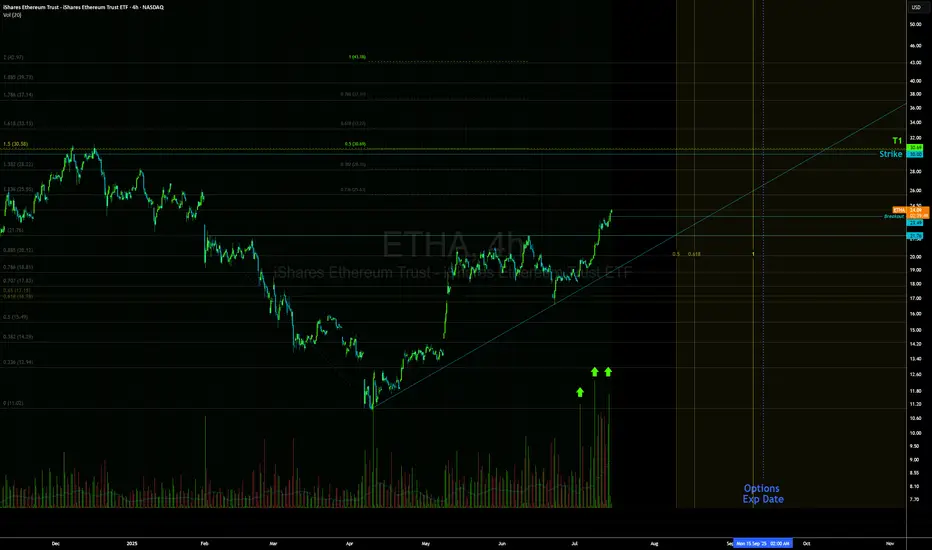
ETHA LongBreakout of inverse H&S, BTC massive breakout and following through.
Looks like we can see $30 +, Buying time on these contracts. Volume looks amazing.
SPY (SP-500) - Rising WedgeYesterday we had a breakdown of the rising wedge on SPY. I draw out some important levels to look out for coming days/weeks. The trendline since april has also been broken. ICEUS:DXY is breaking out to which is increasing the risks for a "Risk off" scenario in tech stocks and crypto.
Nothing here should be interpreted as financial advise. Always do your own research and decisions.

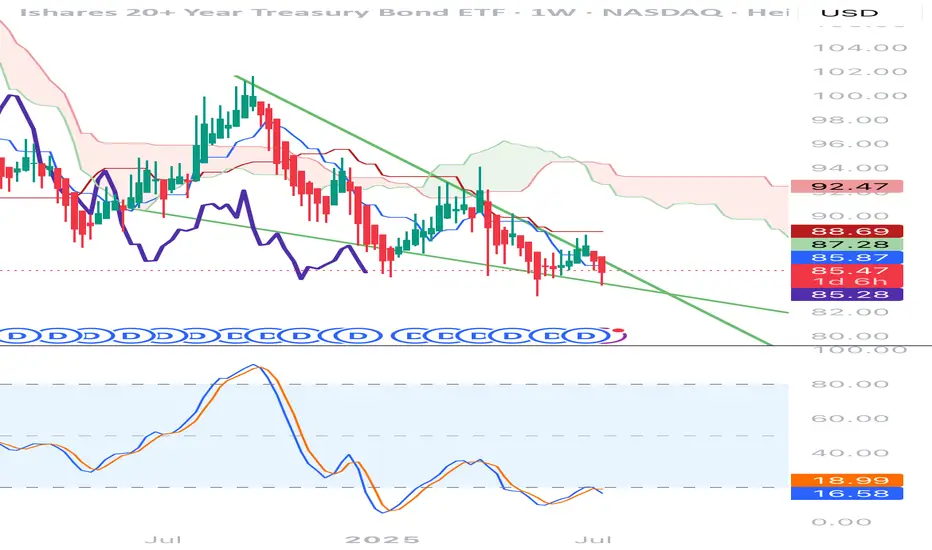
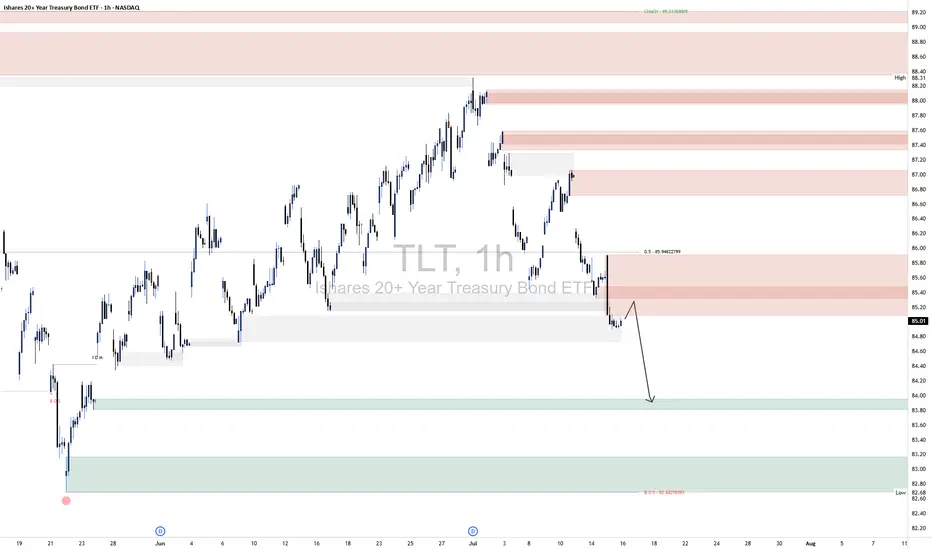
TLT ShortTLT 1H Technical Analysis
📈 Outlook:
The current setup suggests a bearish continuation scenario:
A corrective move toward the 85.20–85.60 supply.
Rejection from this area confirms continuation of the downtrend.
Target: 83.20–83.60, where resting liquidity and untested demand reside.
This sequence follows a classic liquidity sweep + supply mitigation + continuation pattern. Unless price breaks convincingly above 85.80, the bearish outlook remains intact.
🔼 Supply Zones (Bearish Liquidity Layers):
Primary Zone: 85.20–85.60
This is the most immediate area of interest, aligning closely with the 50% equilibrium level of the last bearish impulse (~85.84). Price is likely to reject from here as it also coincides with a previously unmitigated supply block and market inefficiency.
Stacked Supply Above: 86.40–88.00
Should price break the lower supply, these zones will come into play. However, the current structure suggests strong probability of rejection before reaching these levels.
🔽 Demand Zones (Target Areas):
First Demand: 83.20–83.60
This is your marked initial downside target. It represents the next logical draw on liquidity and aligns with prior accumulation and support structure. It’s likely to act as a temporary reaction zone or the next entry point for accumulation.
Deeper Demand Zone: 82.40–82.80
Marked by your secondary border, this range offers higher time-frame confluence and could act as the final sweep zone if the 83s fail to hold.
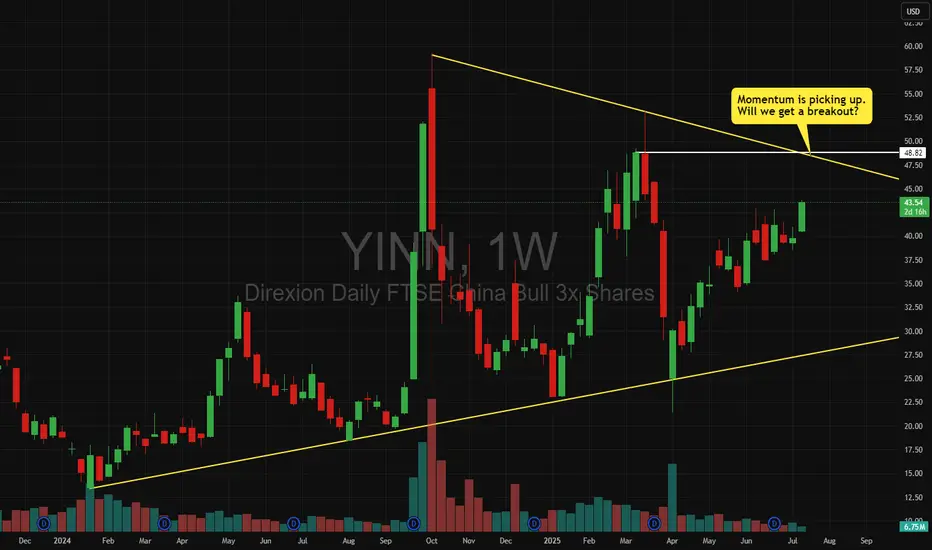
YINN - We could get a bullish breakout of the triangleMomentum seems to be picking up.
Will we a break out of the triangle?
Let's watch the $48 level.
SPY PRICE ACTION 16 JULY 2025This is the price action of spy at its very best as always. I have clearly discussed the important levels & have also discussed the momentum as well.
Feel free to leave your comment
NOTE:I AM NOT TRADING SPY

SPY/QQQ Plan Your Trade Special Update : BUCKLE UPThis video is a special update for all TradingView members. I felt I needed to share this information and present the case that I believe poses the most significant risk to your financial future - and it's happening right now.
Several weeks ago, I identified a very unique mirror setup in the SPY and kept an eye on how it was playing out. I needed to see confirmation of this setup before I could say it had any real likelihood of playing out as I expected.
As of today, I'm suggesting that we now have excellent confirmation that the US/Global markets are about to enter a deep consolidation phase, lasting through the rest of 2025 and possibly into 2026 and early 2027.
The interesting thing about this price pattern/structure is that it is almost exactly the same as the 2003-2007 structure, which I believe is the origin of this mirror setup. Almost down to the exact type of price bars/patterns I'm seeing.
Many of you are already aware that I've been calling for a critical low cycle in the SPY on July 18 for many months. What you may not realize is that the pattern is based on Weekly price data. The July 18 cycle low can have a span of +/- 1-3 weeks related to when and how the cycle low pattern plays out.
Watch this video. If you have any questions, message me or comment.
I'm still here, doing my best to identify and unlock the secrets of price action and to help as many traders as I can.
Price is the Ultimate Indicator.
Get some.
#trading #research #investing #tradingalgos #tradingsignals #cycles #fibonacci #elliotwave #modelingsystems #stocks #bitcoin #btcusd #cryptos #spy #gold #nq #investing #trading #spytrading #spymarket #tradingmarket #stockmarket #silver

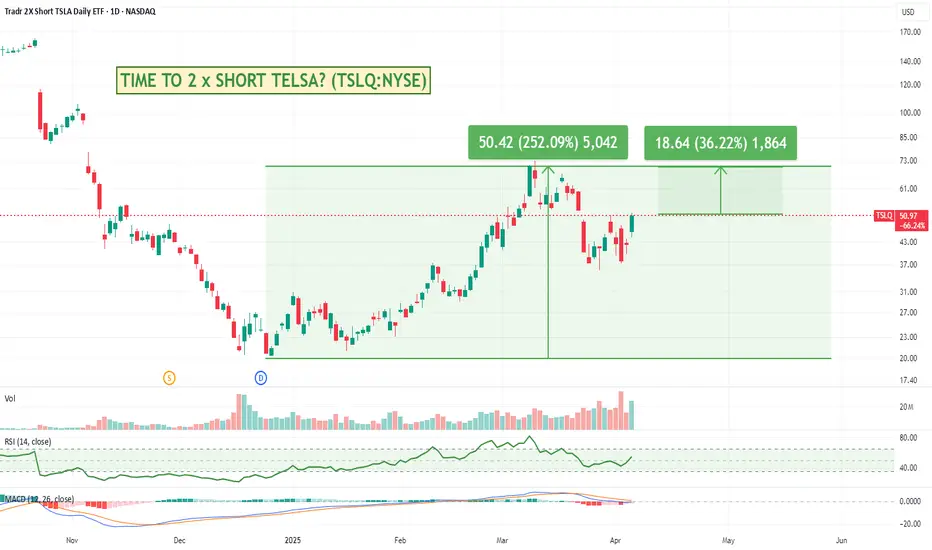
Is it time to short Tesla? If so TSLQ might be of interest.Tesla's ongoing turbulence is getting harder and harder to ignore even amongst some of the permabulls. Notably, Wedbush Securities' Dan Ives, a long-time Tesla bull, recently slashed his 12-month price target by a whopping 43% reduction noting concerns over CEO Elon Musk's political entanglements and the impact of new tariffs under President Trump's administration.
If you think TESLA is likely to keep going down, you might want to consider NASDAQ:TSLQ a leveraged short position. TSLQ aims to deliver twice the inverse (-200%) of Tesla's daily performance.
Its important though to understand that these types of leveraged trades are really only meant to be shorter term and if the stock starts to go up, then you will be losing at 2x the rate as well. Overtime, any wiggle up and down tends to work against you - even if the stock continues to go down.
Definitely not trading advice, but something I was asked about today, and the current climate doesn't look overly positive for Tesla or Elon.
TSLA article: finance.yahoo.com
TSLQ info: www.tradretfs.com
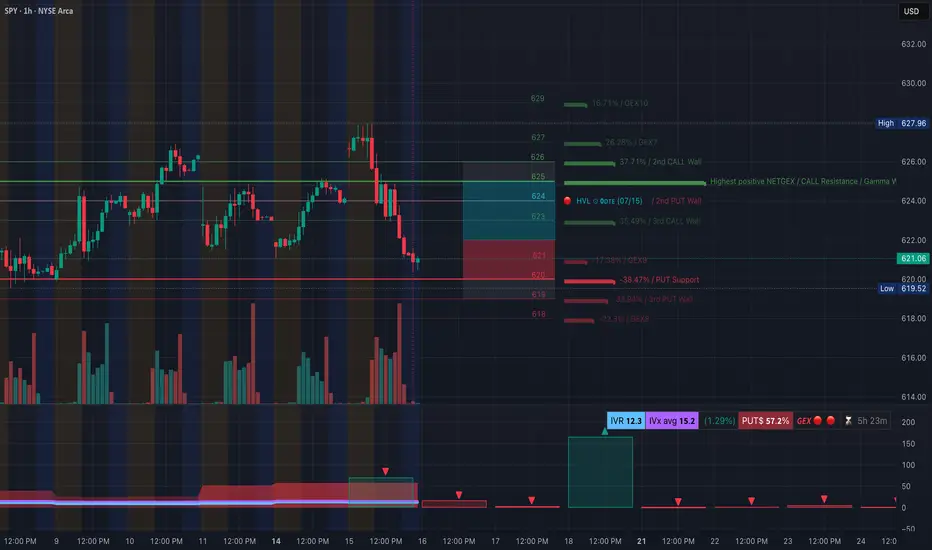
SPY at Key Support! Will It Hold or Break? TA for July 16🧨 GEX-Based Options Outlook:
* GEX Sentiment: Negative gamma dominates (🟥 GEX 🔻), indicating elevated dealer hedging risk.
* Put Wall & Support:
* Major PUT Wall at 620 (⚠️ -38.47%) is being tested.
* Additional downside liquidity lies below 618.
* Call Resistance:
* Upside resistance around 625–627, where both the 2nd CALL Wall and GEX7/8 sit.
* IV/Flow Summary:
* IVR 12.3 (low), PUTs 57.2% – bearish skew.
* Option flow is protecting downside → less confidence in upside follow-through unless we reclaim 624.5+.
* Conclusion: SPY is pinned around major support. A breakdown under 620 could accelerate downside into 616/614 range.
📉 1H Price Action & Trade Setup:
* SPY formed a CHoCH breakdown and is retesting the wedge base.
* Strong rejection from the 624.81–627.96 supply zone.
* Price is now hugging trendline support and could trigger a bounce or further breakdown depending on liquidity sweep.
Bullish Scenario:
* ✅ Entry: Above 621.50 reclaim with confirmation.
* 🎯 Targets: 624.50 → 626.80.
* ⛔ Stop: 620 or below trendline.
* ⚠️ Note: Only valid if SPY holds the CHoCH base and sweeps under 620 to trap bears.
Bearish Scenario:
* ❌ Entry: Clean break below 620, especially if it fails a retest.
* 🎯 Targets: 618 → 615.50 → 612.
* ⛔ Stop: Back above 622 with volume.
🎯 My Thoughts & Recommendation:
SPY is balancing on a major PUT wall and SMC support trendline. If 620 fails, the path of least resistance is down toward 615 and potentially 612 due to the lack of supportive gamma levels below. A relief bounce is possible only if dealers regain control above 624. Keep stops tight, as this zone could snap quickly.
This analysis is for educational purposes only and does not constitute financial advice. Always do your own research and manage your risk before trading.
Nightly $SPY / $SPX Scenarios for July 16, 2025 🔮 Nightly AMEX:SPY / SP:SPX Scenarios for July 16, 2025 🔮
🌍 Market-Moving News 🌍
📈 Record Bullish Sentiment Signals Rotation
Bank of America reports the most bullish fund-manager sentiment since February. With 81% expecting one or two Fed rate cuts this year, the group sees a rotation strategy replacing outright selling, with investors tipping toward sector shifts over wholesale exits
⚠️ Trump’s Fed Attacks Stir Policy Concerns
President Trump’s public criticism of Fed Chair Powell—calling for steep rate cuts and threatening removal—has raised market alarms over the central bank’s independence. Analysts warn such interference could destabilize confidence in U.S. monetary policy
🏦 Banks Prepare for Earnings Surge
Major U.S. banks are expected to report strong Q2 results this week. Enhanced trading and investment banking revenues are forecasted to offset economic uncertainties tied to tariffs
📡 Nvidia CEO to Visit Beijing
Jensen Huang is set to hold a high-profile media briefing in Beijing on July 16, signaling continued emphasis on China for Nvidia despite U.S. export restrictions—potentially a key narrative for tech markets
📊 Key Data Releases & Events 📊
📅 Wednesday, July 16:
8:30 AM ET – Producer Price Index (June)
Gauges wholesale inflation pressures; June expected +0.2% MoM vs May’s +0.1%
9:15 AM ET – Industrial Production & Capacity Utilization (June)
Monitors factory and utilities output and usage rates—key for industrial-sector health
Jensen Huang in Beijing
Nvidia CEO to lead media briefing in Beijing—a potential market mover for chipmaking and AI sectors
⚠️ Disclaimer:
This info is for educational purposes only—not financial advice. Consult a licensed professional before making investment decisions.
📌 #trading #stockmarket #inflation #Fed #tech #industrial #PPI
Massive Head & Shoulders + Death Cross on Big 7A massive head and shoulders pattern is forming on the Big 7 tech stocks (AAPL, MSFT, NVDA, GOOGL, AMZN, META, TSLA). After a strong rally, a death cross (50 EMA crossing below 200 EMA) has appeared, pointing to possible weakness ahead.
Short-term concerns: right shoulder is forming now. If it holds, we could see a bounce. If the right shoulder fails, expect sharp drops and potential broader market reversals.
Long-term view: markets could still move higher over time, but short-term risks are rising. This setup resembles the 1999-2000 period before the dot-com crash. The AI bubble could be nearing its peak, with current leaders losing strength and new players stepping in.
Key to watch: neckline of the head and shoulders and how the market reacts to the death cross.
disclaimer: this is not financial advice. for informational purposes only. trading involves risk and past patterns do not predict future results. always do your own research and consult a licensed financial advisor before making decisions.

Potential Reversal - signs to look forSPY likely reaches 615 this week, if it gets under it will be a change of character. Gold still choppy, nothing decided just yet. Oil also undecided. Nat Gas may pullback from it's breakout. BTC looks like it may have at least a good pullback.
