SP500 Correction neededSP500 Correction needed
Technical picture of correction:
- Wedge - internal and external
- Finish of W3
- Long period of gains
- Oscillator 4H+ overbought
ETF market

Comparing Japanese CompaniesComparing Japanese Companies and ETFs.
Ranks: Banks, General Trading Companies, High Values, Index, REITs.

Comparing Japanese General Trading CompaniesComparing Japanese General Trading Companies:
8058 Mitsubishi
8001 Itochu
8053 Sumitomo
8002 Marubeni
8031 Mitsui
EWJ iShares MSCI Japan ETF
EWJV iShares MSCI Japan ETF
1629 NEXT FNDS TOPIX-17 COMMERCIAL & WHSL ETF
All above.

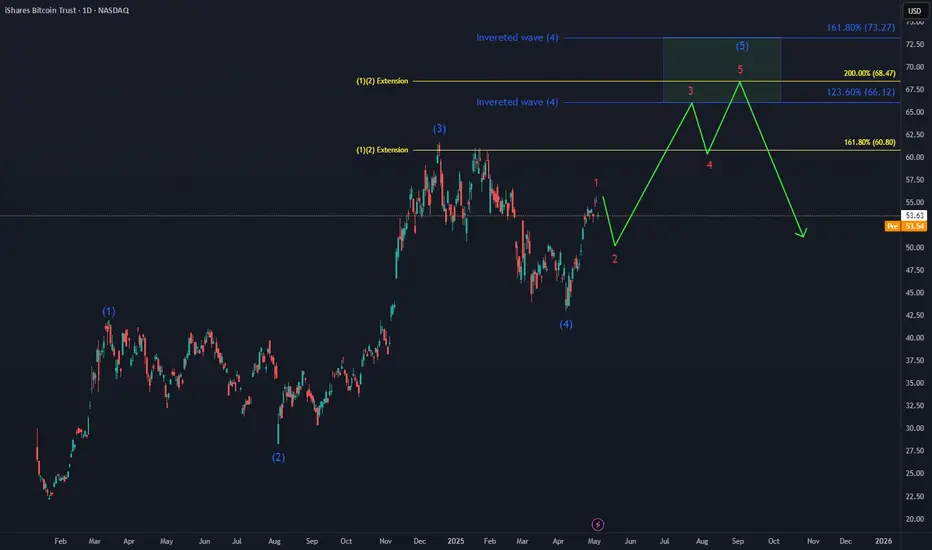
Bitcoin ETF IBIT Next TargetThe Bitcoin INDEX:BTCUSD ETF NASDAQ:IBIT is shaping a 5-wave move toward a new ATH, set to complete its cycle within a regular impulse.
Key technical area for the next move higher:
🔵 Inverted wave (4) target : $66 - $73
🟡 Wave (1)(2) extension : $68
China Market Broder View This analysis is based on FXI ETF the iShares China Large-Cap ETF, which is trades on US stock exchange represents large-capitalization Chinese equities that trade on the Hong Kong ...
largest fall in Chinese market over 60 %, you can see volume-based buying near monthly support area which were represented through circle. I noticed volume following month:
March 2022
Oct. 2024
Jan 2024
Sep 2024
Feb 2025
April 2025
During the Month of September & October a bullish breakout has been appeared with ultra-high volume when FII was Exiting Money from Indian market. that Breakout Failed Due to Trade war tension or anything else whatever the reason, but weakhand brought out by market then market tested again, and we can see ultra-high volume making bullish candle on April 2025 indication of smart money entered. So Bullish Momentum could be seen in upcoming months.
Technical Perception
RSI traded above 50
a bullish crossover of 20&50 Moving average
Price Traded above 20 Moving average

Where do we go from here ? Hint have a hedge on.We hit target 565 was looking a little higher
Lets see we get follow thru tomorrow down
Be prepared this market gonna sink

Nightly $SPY / $SPX Scenarios for May 6, 2025 🔮🔮
🌍 Market-Moving News 🌍
📉 Market Retreats Amid Tariff Concerns
U.S. stock markets declined on May 5, 2025, as investors reacted to potential tariffs and key earnings reports. The S&P 500 dropped 0.6%, and the Nasdaq decreased 0.7%. Notably, Palantir Technologies ( NASDAQ:PLTR ) fell nearly 8% in extended trading despite raising its full-year revenue forecast and exceeding Q1 revenue estimates.
🏛️ Fed Meeting Commences Amid Political Pressure
The Federal Reserve's two-day meeting begins today, with the central bank expected to maintain its benchmark interest rate at 4.25%-4.5%. Despite President Trump's calls for rate cuts, the Fed remains cautious due to inflationary risks from new tariffs and migration policies.
🎬 Entertainment Stocks Under Pressure
Streaming giants Netflix ( NASDAQ:NFLX ) and Disney ( NYSE:DIS ) experienced premarket losses of over 5% and 3%, respectively, following President Trump's proposal of a 100% tariff on foreign-made movies.
🏠 Housing Market Faces Challenges
The U.S. housing market is weakening due to persistent high mortgage rates and economic uncertainty driven by tariff policies. Mortgage rates, currently averaging 6.76%, have deterred both prospective buyers and sellers.
📊 Key Data Releases 📊
📅 Tuesday, May 6:
8:30 AM ET: U.S. International Trade in Goods and Services (March)
⚠️ Disclaimer:
This information is for educational and informational purposes only and should not be construed as financial advice. Always consult a licensed financial advisor before making investment decisions.
📌 #trading #stockmarket #economy #news #trendtao #charting #technicalanalysis

I SPY levels....It's a FOMC week (scheduled for Wed 5/7). So you can use your skills to scalp prior if you can.
Levels to mark...
*week hi/lo
*day hi/lo
those levels should be helpful when you spot intraday setups (if you can). if you can plan a strong $1 move, you can win $50. play to your strengths. that's all i'm going to do.

2022 WinnersIn trying to figure out what would have done well in 2022, a time when most investments and funds lost money, I found these.

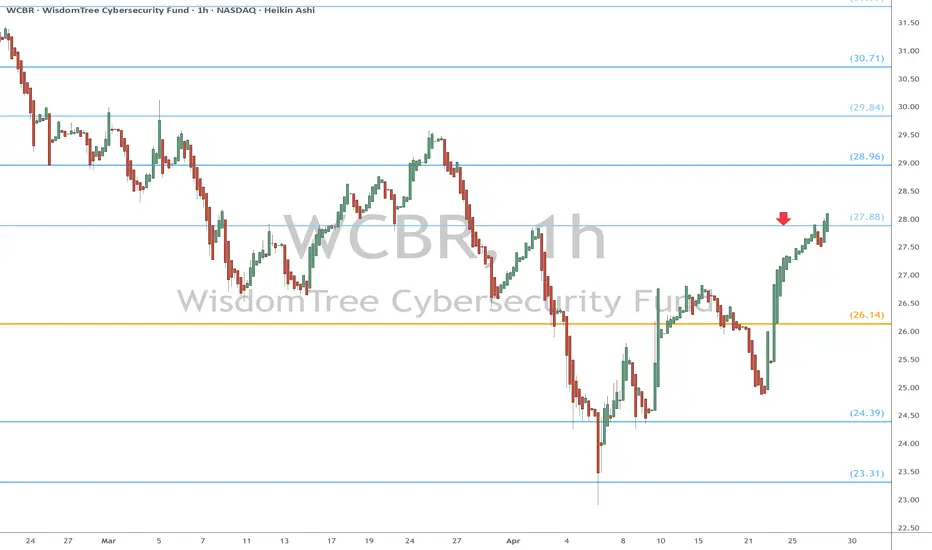
WCBR watch $27.88 above 26.14 below: Key fibs to Break or RejectWCBR trying to recover from the tariff tantrums.
Just hit a Genesis fib at $27.88 that may cause a dip.
If it does get a dip, then watch Golden Genesis at $26.14
Broad MonitorThis is a huge set of assets, stocks, ETFs that I use to watch for shifts in market regimes.

Time to bet on a quick BTC retracement to $87kAll three corollaries, BTC MSTR and TSLA look to retrace lower.
We’re currently facing the 4H vs the 1D
Long SMST for any bad macro news and on technicals.
FOMC tomorrow should be hawkish, good excuse to correct for 1 week before longing again

Gold is going to retrace back to 264.04Gold is going to retrace back to 264.04. Its time to buy a lot DULL .

$SPY Short Swing, vwap+supply+resistanceBackground. Easy confluence trade. We had the largest and fastest rally in stock history from 2022 to now. Everyone who loaded up at $380-430 is ready to take some profits. After the tariff announcements, we sold off hard through a bunch of levels and trendlines down to the bottom of the longer term uptrend.
Current situation. We have retraced back up to the first major supply area, where everyone who bought the dip back in march went long. They've been underwater and are ready to sell for scratch. This will drive the price back down. Maybe the end of a long term uptrend. Maybe just leg 2 of the tariff drop, back down to the trendline. I can't know that.
Delta. If you look at the volume footprint chart, there has been a huge negative delta this whole rally. Prices are going up but the larger players are selling into it. Essentially, the last 2 weeks have been driven up by main street, while wall street unloads. Once there are enough bagholders, the floor can fall out. Here's the weekly delta.
Trading Approach. This is a good point to initiate the start of a long term short position. Like, buying puts 1-2 years out with a $450 target, a gap that's never been filled. I think it's also a good swing entry but with closer targets. On the more pessimistic attitude, after the tariffs, the world started the process of dethroning America as leader of the free world. There's a lot of gravity pulling down to $250 and if the world fully turns on the US, that's where we're heading.

DEFENSE EU vs USEU defense massively outperforming the US up 50% from the lows.
Lockheed Martin is forced to console American allies, convincing them not to abandon the US Defense industry as Trump completely destroys it with his pro-Russia behavior.
I don't see any way back to NATO normal. Trump has weaponized the US defense industry against our (former allies?) allies and that is unacceptable. The US defense industry mostly sells $107 billion annually to NATO, EU nations.
This win-win EU-US relationship between our allies has made it possible for the US to develope and sustain military technology we would otherwise not have been able to afford alone.
So America first? Not really. More like America last!
At any rate, should a downturn occur and need to be long. #EUAD is a good place to be.

Your Move - All Time Quarterly Channel QQQNASDAQ:QQQ
Do we really have a setup allowing for tech to breakout out higher from this parallel channel?
Your call, I just draw the chart.

480 Was Our Low This YearTrading Fam,
In my last post, I speculated that there were (2) two great areas to start your DCA back into this market. The first was at SPY 505 and I postulated that if we dropped lower, we could hit SPY 460. Not quite. Looks like our downward trajectory reached it's bottom exactly at that ascending white support line. Now here's the interesting part. That trendline was actually started way back in March of 2020, the Covid-19 crisis, when Trump was also president. I should have seen this trend but I don't think I had it drawn in until more recently. This trendline has obviously proven extremely significant and I'd advise that you draw it into your charts as well. We now have something to watch closely. I suspect that if price breaks down from here, it won't be pretty. This year, I don't think that will happen. I believe we saw our low this year upon the touch of that trendline at 480. So, if you didn't get your money started back in at the 505 level, you were not given much of a chance afterwards.
Today we can see that our price is back above numerous levels of resistance which will now act as support. Firstly, that 505 level. Next, the VRVP point of control (yellow horizontal line). Third, that pink ascending trendline. That was huge and we have confirmed the move above it now on the daily. If we stay above it by market close on Friday, we're good. That will be enough to also provide us weekly confirmation.. Finally, we are sitting right on support at 563, that pink horizontal line. All of these bullish breaks show me that price should remain above our white ascending trendline started in March of 2020 for some time, and I am guessing the rest of the year.
I remain steadfast in my bias towards my SPY Target #3 at 670-700 before sometime next year. Two targets hit so far. One to go. I am fairly confident we will hit it. At which point, it will be time to make some serious decisions about what to do next.
✌️Stew

SPY/QQQ ES/NQ 5 Mayo 2025QQQ Liquidity Map Analysis – May 5, 2025
Data Source: SpotGamma + Price Action + Option Walls
🔍 Key Levels and Zones:
Zone Type Price Level NQ Equivalent Commentary
Call/Put Wall (Major) 490 20230 NQ 🔴 Strong Sell Zone. High probability of reversal.
Target Area 3 488.33 20160 NQ 🎯 Possible intermediate resistance level.
Target Area 2 486.77 20100 NQ 🎯 Watch for reactions; aligns with “RB Head.”
Target Area 1 485.00 20030 NQ 📌 First bullish target; aligns with strong option wall.
Zero Gamma 484.00 — ⚠️ Equilibrium level — market may flip bias around here.
RB Bottom 483.69 19980 NQ ✅ Key reaction zone. Below here, bias turns bearish.
Put Wall (3) 480.00 19840 NQ 🟡 Strong support — possible bounce zone.
📈 Scenario 1: Bullish Case
If price holds above RB Bottom 483.69, we could see:
485 → First long target.
486.77 → Second long target.
488.33 → Momentum continuation.
490 → Final target & major sell zone.
🔼 Bias: Long above 484 / Confirm above 485
📉 Scenario 2: Bearish Case
If price fails to hold Zero Gamma (484) and breaks below:
482.14 → Short-term bearish target (19900 NQ).
480.6 → Extended target (Put Wall 3, 19840 NQ).
🔽 Bias: Short below 484 / Confirm below 483.7
🧠 Psychological Zones:
490: "Sell the rip" level — high call wall pressure.
484-485: Market equilibrium zone, pivot level.
480: Last stand for bulls. Below this, bears gain control.
🚨 Strategy Tips:
Use confirmation candles on the 15–30min for entries.
Combine with volume spikes or order flow data (Bookmap/Footprint).
Watch for reactions near RB Zones and Walls for intraday scalps.
💬 Summary Quote:
“The market moves where options dealers are forced to hedge. Identify their pain points, and you'll find your edge.” — JP Investment

SPY - support & resistant areas for today May 5 2025These are Support and Resistance lines for today, May 5th, 2025, and will not be valid for the next day. Mark these in your chart by clicking grab this below.
Yellow Lines: Heavily S/R areas, price action will start when closing in on these.
White Lines: Are SL, TP or Mid Level Support and Resistance Areas, these are traded if consolidation take place on them.
Silver Lines: An Area where price action could happen and do work on a choppy day.

SPY Holding the Channel – Can It Bounce or Fade Today?Market Summary
SPY is currently trading around $563, showing early weakness after stalling below key resistance at 566–567 last week. Futures were flat overnight with mixed macro sentiment and low volatility. We're starting today near the lower trendline of the rising channel visible on the 15-minute chart.
Technical Structure
* Trend: Price is still holding the lower boundary of the upward channel from May 1–2.
* Support: ORL at 564.29 and lower trendline ~563.20–563.40.
* Resistance: ORH at 565.47, PMH at 565.95, and GEX resistance at 567.
* Indicators:
* MACD: Flattening with bearish cross on shorter timeframes.
* Stoch RSI: Reset to lower range, watching for potential curl up.
Options & Gamma Insight (GEX)
* Current Price: $563
* PUT Pressure Dominant: GEX sentiment is 🔴🔴🔴 Bearish, with:
* PUT$ flow = 115.6% (significantly overweighted)
* IVR 26.1, IVx avg 20.4 = Still room to expand in volatility.
* Key Gamma Levels:
* Resistance Walls:
* 567 → 2nd CALL Wall (major resistance)
* 568–570 → CALL resistance zone
* Support Zones:
* 562–561 → Heavy GEX support
* 560 → Highest negative net GEX = strong PUT wall
Potential Scenarios for Today
🟢 Bullish Case:
* Price reclaims ORH 565.47 and breaks above 566, triggering momentum to test 567.
* If momentum continues, squeeze toward 568 or even 570 is possible, but less likely unless volume spikes.
🔴 Bearish Case:
* Break below 562.68 Ask, triggering fast move to 561.70 and possibly flush into 560 PUT wall.
* Below 560 opens the door to 557 or even 554–555 if panic selling or negative macro.
Actionable Levels
* Long above: 565.50 with target 566.80–567 | Stop < 563.80
* Short below: 562.80 with target 561 → 560 zone | Stop > 564.50
* Scalp Range Zone: Between 563.50–565.50 = chop risk
Final Take
SPY is pinned between heavy PUT support at 560 and CALL resistance at 567. With PUTs outweighing CALLs, a flush toward 561–560 could be favored unless bulls reclaim 566+. Watch for sharp directional trigger around 10:00–10:30 AM ET.
📌 This preview is for educational purposes only. Always use proper risk management and confirm with your own system before trading.

SPY/QQQ Plan Your Trade For 5-5-25 : GAP Reversal PatternToday's pattern suggests the SPY will open with a GAP range from yesterday's candle Body and attempt to reverse the trend we saw last week.
I believe this move will resolve to the downside, as I've been warning of the May 2-5 Major Bottom for many weeks.
I believe the extended uptrend over the last few weeks was pure speculation related to Q1 US earnings. It is hard to argue that traders playing into the Q1 earnings boost didn't play the right side of the trend after watching the markets rally over the past 2+ weeks. But, I still believe the markets will consolidate and attempt to move downward over the next 10- 20+ days.
The one thing that we have to understand is Q1 was almost on auto-pilot from Biden's economy/spending until Trump threw a curveball at the global markets with tariffs.
I don't believe the US & global markets have truly priced in a global -25% to -45% economic contraction because of the ongoing tariff negotiations. It has been reported that shipping rates are down 60% in China. I believe we still need another 30-60+ days to work out the tariff issues and to allow the markets to settle into proper expectations for future economic output/growth.
Because of this, I continue to urge traders to stay cautious.
Sitting on CASH right now (only trading 20% of your total capital) is probably the smartest thing you can do at the moment.
I still expect the July and October 2025 lows to be the base/bottom of the markets, leading to a stronger upward price trend.
Right now, I've very cautious we've just seen a "dead-cat bounce" off recent lows because of Q1 earnings expectations.
Now that we've passed most of the Q1 data - we are staring at Q2 & Q3. What comes next.
I believe Gold/Silver will continue to price in extreme risk factors - resulting in a strong rally through May and into June.
I believe Bitcoin will stall and move back down to the lower consolidation range.
Let's see how things play out this week.
Get some.
#trading #research #investing #tradingalgos #tradingsignals #cycles #fibonacci #elliotwave #modelingsystems #stocks #bitcoin #btcusd #cryptos #spy #gold #nq #investing #trading #spytrading #spymarket #tradingmarket #stockmarket #silver

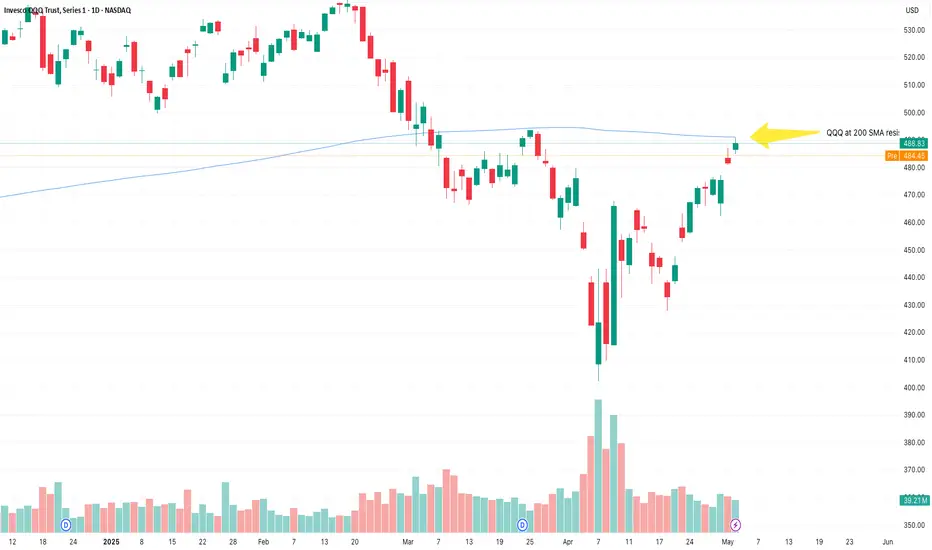
QQQ at SMA 200 resistance There might be some pullback here
I am staying bullish as long as it is above 477.58.
KLBN11 - Trend ReversalThe dollar is one of the main variables affecting pulp and paper companies in Brazil. We've seen the USD/BRL drop from 6.20 to 5.60, which contributed to the decline of KLBN11.
Currently, the asset is showing a 9- and 21-period moving average crossover, with the potential formation of a bullish pivot.
If it breaks above the R$19.00 level, it opens upside targets at R$19.86, R$20.38, and R$21.22.
The stop-loss is set at R$17.60.
