XLK/SPY above the 200 WeekXLK/SPY has crossed above the 200 week moving average, secular bull market of tech is back? Might be time to get long tech to not miss the rally if it happens. Tight stop whenever tech loses its 200 week on the ratio.
ETF market

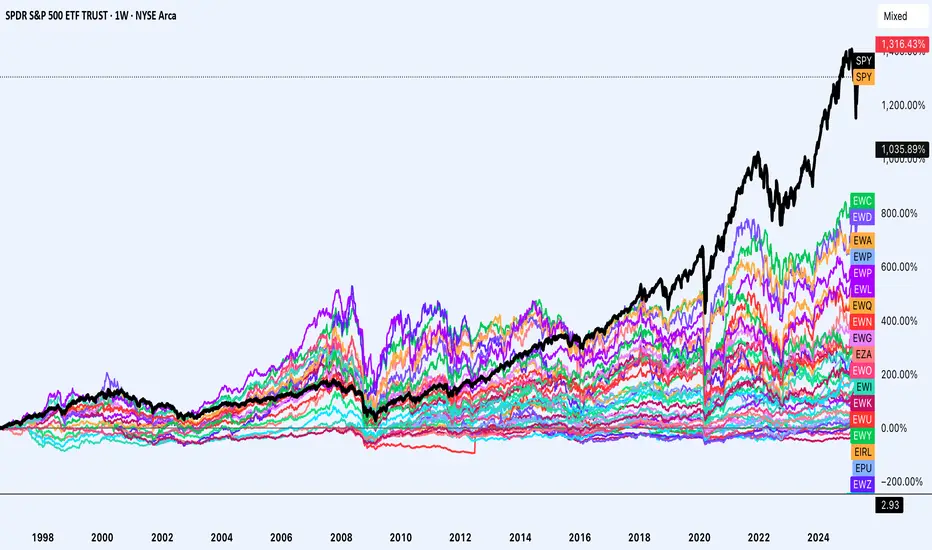
US Outperformance, when will it end?The US market has consistently outperformed global markets since the global financial crisis, it has also outperformed since the tech bubble. A portion of this can be attributed to a strong dollar (many markets outperformed in local currency). However this strong dollar performance may be coming to an end.
In addition there are structural reasons why the US has and may continue to outperform:
1. A larger weighting to higher growth sectors such as technology, communication services and a lower weight to lower growth sectors such as energy and materials.
2. Better rule of law, better focus on shareholder returns, less crowding from the government and state owned enterprises lowering the return of markets. (EM SOEs as an example)
3. US attracting global talent and fostering innovation. "The smartest person in any subject will likely go to the US'
So how can the US consistently underperform given these things?
1. Well for one the dollar may start to be a worse performing currency, it seems the current administration wants that. This not only lowers the performance of the US compared to global markets it also lowers the foreign inflows to US assets and also benefits EMs with dollar denominated debts.
2. The idea that the US attracts the best talent and fosters innovation may be declining with the current cultural attacks on immigration and the federal government spending cuts impacting research projects.
3. Global markets currently have a lower weighting to high growth sectors however this may not continue and instead we may start to see the marginal weight of sectors going to higher growth sectors instead of lower growth sectors.
4. The darling companies in most countries may list in their local markets instead of in the US. (Seeing the UK ease regulations of share classes, Chinese companies not welcomed in the US, European companies redomiciling back to Europe)
5. Valuations, Valuations, Valuations. Gun to your head: Next ten years would the multiple become a headwind or tailwind for the US market? What about for global markets? US trades at roughly 21x forward earnings whereas the UK trades at 12x, Eurozone at 14x, Japan at 13.5x, EM at 12x and China at 11x.
If after 10 years the US trades at an 18x multiple and the UK as an example trades at a 15x valuation that would be an annualized headwind of 1.5% for the US and an annualized tailwind of 2.3% for the UK. Add to that the effect of low starting valuations on yield (US net shareholder yield is close to 2% whereas the UK yields 4%).
Just rough numbers on performance for US vs UK next 10 years.
US: -1.5% multiple change, 2% yield, 10% earnings growth = 10.5%
UK: 2.3% multiple change, 4% yield, 6% earnings growth, 1% currency = 13.3%
Everyone is over allocated to the US and is under allocated outside the US. Currently the US represents around 20% of global GDP however it represents 70% of global market cap. 70 cents of every dollar in the equity market is in and goes to the US. Will this likely increase or decrease as a share? The next question becomes who will take that share if it falls?
Investing outside the US does not mean:
Investing in markets with bad shareholder friendliness
Investing in markets with a history of fraud
Investing in markets with notorious related party transactions
Investing in markets with high starting valuations.
Some markets such as China can have the first 3 issues applied to it, some markets such as India may frankly have all of these issues. Some markets in Europe may have the first and last aspect. And some markets likely have none of these issues. I propose Japan, UK and Northern Europe.
History is only a guide however the history of returns involved one of the single best economic performances of any country coming from the US which resulted in an amazing stock market with great returns, this is not guaranteed.
Historically stocks return nominally 10% and on a real basis 7% which can be decomposed to 3% yield and 7% earnings growth with virtually no multiple change (on long enough time horizons) when you start at a high valuation the yield component is lower and you need higher earnings growth to compensate. And on a much longer time horizon earnings growth is what really matters.
Earnings growth does not exist out of no where, it usually tracks nominal gdp growth + a margin increase from operations and or sector compositions.
Nothing is guaranteed, your next maximum drawdown is in the future, expect the unexpected and keep invested as the global debt bubble will likely be inflated away.
I need to say this the market rallied 62% back into major short I need to say this the market rallied 62% back into major short zones
Lets take a step by step methodical safe approach to make CASH guys!
I will alert all here im 60% to my 100k challenge
Just throw a like for me! Luv yall

SPY: Short Trade with Entry/SL/TP
SPY
- Classic bearish setup
- Our team expects bearish continuation
SUGGESTED TRADE:
Swing Trade
Short SPY
Entry Point - 566.62
Stop Loss - 582.02
Take Profit - 540.07
Our Risk - 1%
Start protection of your profits from lower levels
Disclosure: I am part of Trade Nation's Influencer program and receive a monthly fee for using their TradingView charts in my analysis.
❤️ Please, support our work with like & comment! ❤️

QQQ Technical Analysis! SELL!
My dear subscribers,
This is my opinion on the QQQ next move:
The instrument tests an important psychological level 488.86
Bias - Bearish
Technical Indicators: Supper Trend gives a precise Bearish signal, while Pivot Point HL predicts price changes and potential reversals in the market.
Target - 463.87
About Used Indicators:
On the subsequent day, trading above the pivot point is thought to indicate ongoing bullish sentiment, while trading below the pivot point indicates bearish sentiment.
Disclosure: I am part of Trade Nation's Influencer program and receive a monthly fee for using their TradingView charts in my analysis.
———————————
WISH YOU ALL LUCK

SPY to pulback to 544Looking for SPY to pullback to 544.
544 is a very strong support, also the 38.2% fib. If it breaks this level, then it expect a rapid acceleration to 530 and 515.

Energy sector bearish amid high interest rates + trade warXLE
Weekly
Volume spike + Reversal Candle
Continuation candle didn't break the high of the reversal candle's high
Last weekly candle is week
Most probable scenario is a test of the 74.5 weekly low level
Daily
Bear flag with 20 daily EMA acting as resistance
Momentum bearish:
High US interest rates slow economy
Trade war

Stock Market Forecast | TSLA NVDA AAPL AMZN META MSFTStock Market Forecast | CME_MINI:NQ1! CME_MINI:ES1! QQQ SPY SP:SPX
Mag 7 Forecast TSLA NASDAQ:NVDA AAPL AMZN META MSFT

VEA - Hits Target with PrecisionToday, price tapped the target perfectly.
This setup played out exactly as forecasted — clean market structure, precise entry zone, and strong momentum

QQQ: Bearish Continuation & Short Trade
QQQ
- Classic bearish pattern
- Our team expects retracement
SUGGESTED TRADE:
Swing Trade
Sell QQQ
Entry - 488.86
Stop - 505.90
Take - 457.49
Our Risk - 1%
Start protection of your profits from lower levels
Disclosure: I am part of Trade Nation's Influencer program and receive a monthly fee for using their TradingView charts in my analysis.
❤️ Please, support our work with like & comment! ❤️

SPY A Fall Expected! SELL!
My dear friends,
SPY looks like it will make a good move, and here are the details:
The market is trading on 566.62 pivot level.
Bias - Bearish
Technical Indicators: Supper Trend generates a clear short signal while Pivot Point HL is currently determining the overall Bearish trend of the market.
Goal - 542.79
Recommended Stop Loss - 579.54
About Used Indicators:
Pivot points are a great way to identify areas of support and resistance, but they work best when combined with other kinds of technical analysis
Disclosure: I am part of Trade Nation's Influencer program and receive a monthly fee for using their TradingView charts in my analysis.
———————————
WISH YOU ALL LUCK

BTC target revised to 48KHappy Cinco de Market for those who celebrate!
BITSTAMP:BTCUSD CRYPTOCAP:BTC Bitcoin has finally topped. I have lowered the low target from 52-55K to 48K!
May the Fork be with you!
NotTradingAdvice
YourOwnRisk
ResearchFractals
PitchForkTA
TheRoaring2020s
btc eth Crypto

Spy.. The wedgesRemember this, when it comes to technical analysis, anything that goes up really fast form's a rising wedge most of the time and anything that drops quickly form's a falling wedge.
The Spy has risen 12% since April 21 and after this week i we will give half back and head to 533-535.
As you know market goes no where without tech..
So I'll just show you the proce action of the biggest tech sectors
AMEX:XLK
AMEX:XLC
NASDAQ:SMH
And lastly NASDAQ:QQQ
A big red flag in addition to that wedge is the RSI Divergence since April 23 shown on qqq 1hour rsi
Seeing Divergence is like noticing Ball tires; you don't know the exact date the tires will bust but you know it's coming and you just hope your aren't driving (In calls).
This is Qqq daily chart..
200sma purple line
Red line 20sma
We closed right below 200 day but we are 7% away from the 20sma.. qqq usually extended 4-5% from the 20sma before retesting it.
So long story short stay away from tech calls !
2 reasons I think the Spy can make another high this week.
1. Vix still has a gap to close at 21.50
Fallen wedge here, not surprising, vix pattern is usually opposite of spy. I think an explosive moves comes soon here
2. Dow jones , XLF and IWM have the April 2nd liberation day gap to close ..
The dow jones gap is 2% wide, that means another 800pts up. You ever seen the dow pump 800pts and the Spy not go up? Me neither
So I think unless Spy breaks back below 560 early in the week we could melt up to 572-575.
With no big tech earnings that pop up would likely come from FOMC wed..
Whatever intra week high the market makes, I don't think it will close near it.. what I mean is, let's say Spy spike to 572 wed I think we will close the week 560 or lower
Becareful Swinging calls, with all these tech sectors showing a rising wedge I'm sure some of these tech names reporting will disappoint.
Lots of low volume chop early in the week.. count me out until Wed
Bigger picture
Unless we break 530 we aren't headed to 510.. if we break below 510 then 495 will come.. below 495 is death
If we close the week above 585 somehow then we are headed back to 610
Lastly
Es 4hour chart
Cleanest look here. Yellow trendline represents higher lows.
When we break rising wedge I will short to Yellow trendline

Sol GDX Review Studying the weekly and daily structure of GDX using ICT concepts: breaker blocks, order blocks, and liquidity. Looking for price reaction around the weekly order block and possible short-term displacement. Feedback and insights welcome!

SP500 ETF: Fibonacci MappingAs you may know, Williams Fractals indicator identifies potential reversal points by marking a high (or low) surrounded by two lower highs (or higher lows) on each side, forming a five-bar pattern that signals possible turning points in price. Unfortunately, the simplicity of such indicator provides just tiny perspective, undermining broad implication of the concept.
Before I begin diving into processing geometric narrative of emerging price via fibonacci channels, I want to explain how I interpret fractals.
When I use the term "fractal", I'm not just talking about the points alone. Market continuously corrects itself, so analyzing it by price alone can bring more confusion than help. The object of observation shouldn't be limited to quantifying just by a single property. Chaos by default requires awareness from both price and time aspects. The easiest way to root it in my vision was through realization that price is a function of trading time intervals. Its activity can be described as cyclical progression, as if it is wired by multiple "springs" of different tensions.
Classic TA patterns known to literally anyone are great for anticipating a move in surface level forecasts. Since my line of work focuses on prediction over forecasts, it requires deeper structural awareness behind complex oscillations.
Let's observe the way selloff scales from ATH and how it impacts fractal hierarchy.
The first corrective bullish wave can be explained as a reaction to initial impulsive bearish wave. The bigger scale drop from ATH to a lower point explains why the corrective bullish wave looks the way it is. And so on:
In fractals, scaling laws describe how key properties change with size, typically following power-law relationships that reflect the structure’s self-similarity, where a characteristic scales with the size raised to an exponent.
To build a probabilistic model, we must keep in mind how the smaller bits make up bigger scale picture. ATH, established bottom and angle of progression defined by pullback highs, all those points have structural weight. Since psychology of masses that shapes price dynamics is governed by mathematical sequences found in nature, it's fair to use Fibonacci Channels to map the geometry of interconnectedness.
Similarly, all of those points can be referred by another fibonacci channel with opposite direction.
From my perspective, traditional TA patterns reflect just phases of cycle, this is why I unify those fragments into broader scalable shapes. This distinctive branch of Fractal Analysis allows to track systematic aspects of market behavior and explains how a pattern replicates itself in rhythmic continuity.

$SPY Possible simulation with COVID, Bottom at 495 then ATH 630Lowest RSI since COVID , highest daily volume for years! but if copy the wave of COVID drop we can see some similarities. bottom by 2nd week April at 495 then consolidation at 530 then up and fighting zone between 550-560 then up and small top on June/July then All time high in Sep at 630. the idea, take long dated strangles options
