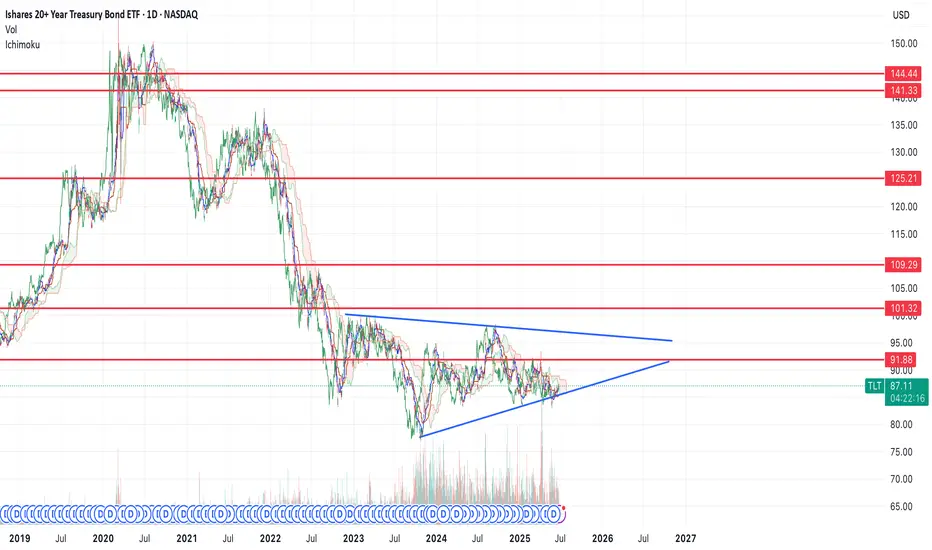
Bottom in for bonds, flight to safety trade coming soon $100+If we look at the chart of TLT, you can see that we're forming a bottoming reversal pattern.
We had a spike low down to $83 back to the middle of May and have now reclaimed the structure. I think that move marked the bottom.
I think it's very likely that bonds spike in the near future, if they can make it over the $92 resistance level, then I think price will see continuation and likely break the pattern finding the first resistance at that $101 level.
That said, I think this is the start of a larger move higher in bonds that will take us all the way up to the top resistance levels over the course of the next few years before the move is done and we start the long term trend in rates higher.
ETF market
XME eyes on $57.40: Golden Genesis a MAJOR barrier already felt XME recovering nicely from the tariff tantrum.
$57.40 is the exact level of the Golden Genesis.
High Energy object whose heat is clearly noticed.
It is PROBABLE that we orbit this object a few times.
It is POSSIBLE that it rejects to the retest fibs below.
It is PLAUSIBLE that bulls could blow thru it this time.


Looking to jump into this after $33Looking to make a long play in anticipation of Alt season. Waiting for break out above $33 for confirmation.
We touched weekly reversalThis channel is not providing individualized trading or investment advice, nor is it a banking service, brokerage service, trading service, investment service or money management service

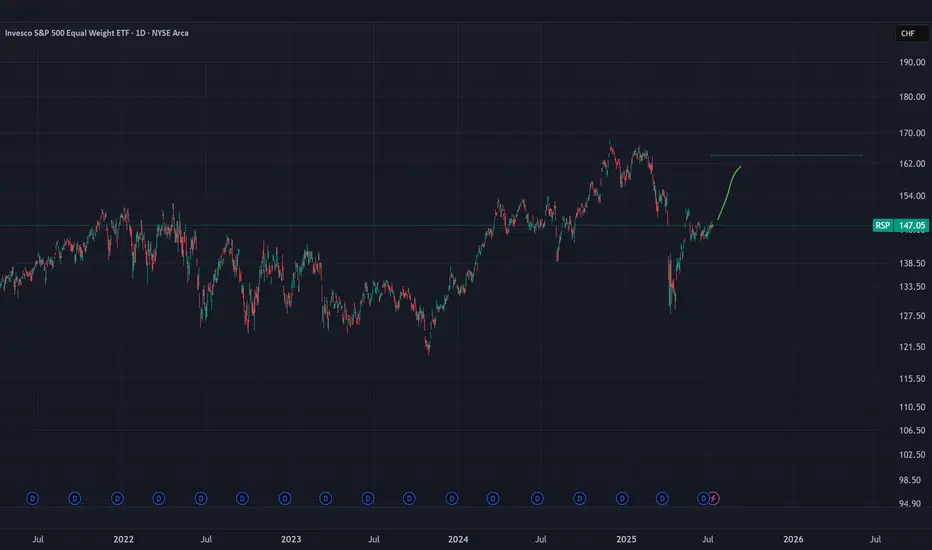
SP500 but equal weighted and in a strong CHF currencythis is the much much better index to follow as it isnt swayed by 10% moves in tesla or NVIDIA and also isnt tricked by USD dollar devaluation ;)
this is the real international index to follow
SPY is about to dumpThere isn't much to say. Chart speaks for itself. Possible shark farming if we hit resistance at this trendline that was resistance since 2022. Not shown but its also at the 707 extension of the October '24 and April '25 low.

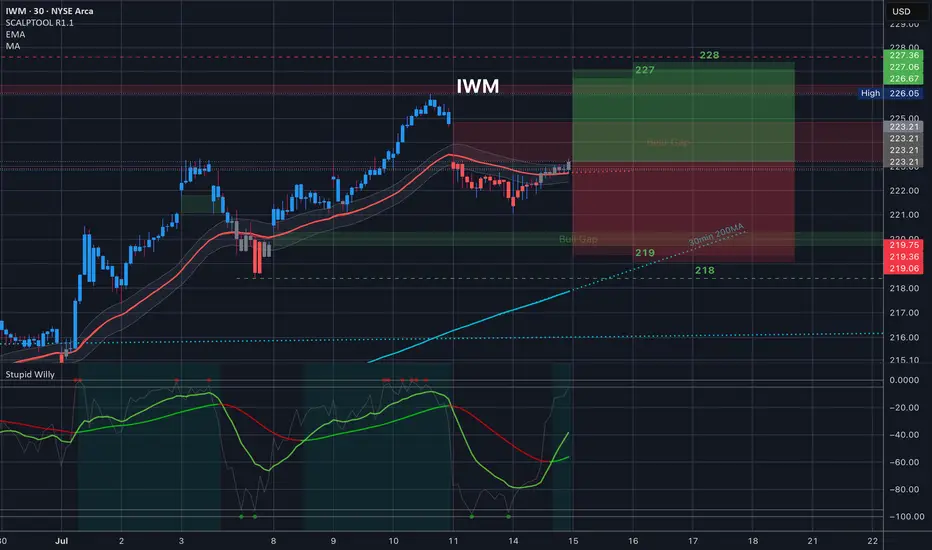
$IWM Trading Range for 7.15.25 and everything in it for CPI Tomorrow’s Trading range for CPI inflation data and everything in it. How are you playing it?
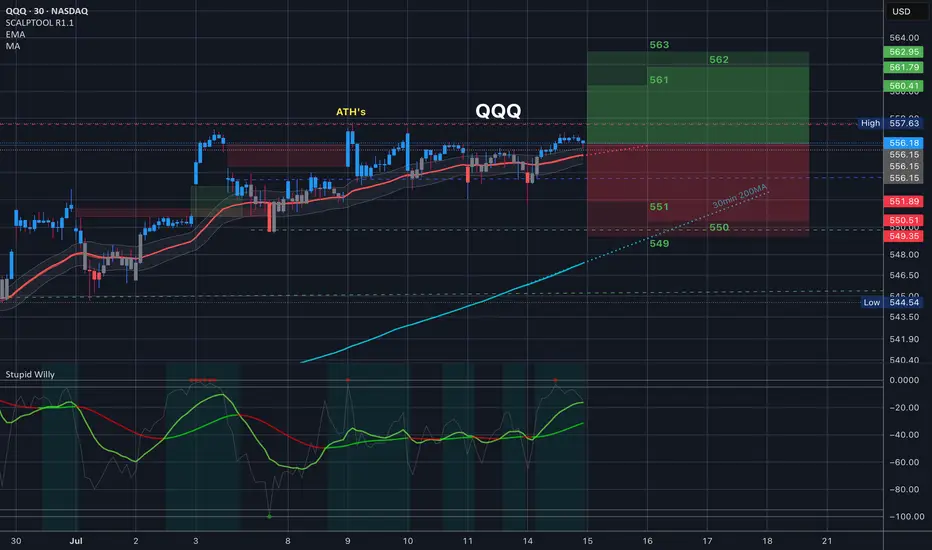
$QQQ Trading Range for 7.15.25 and everything in it for CPI
Tomorrow’s Trading range and everything in it. We have CPI in premarket tomorrow. This is the trading range. let's go.
$SPY Trading Range for 7.15.25 and everything in it for CPI
Tomorrow’s Trading range and everything in it. How are you playing it?

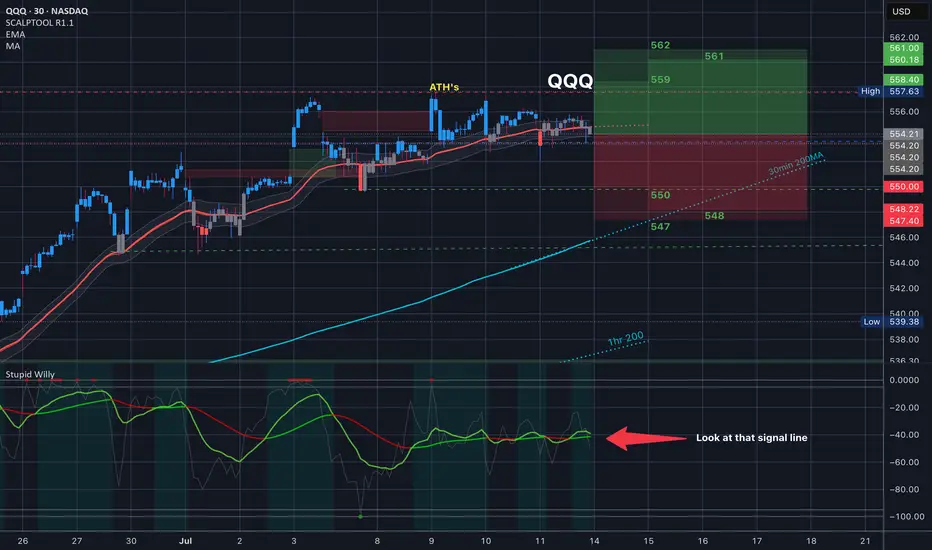
$QQQ Tomorrow’s Trading Range and everything in it /// 7.14.25Tomorrow’s Trading range and everything in it. How are you playing it?
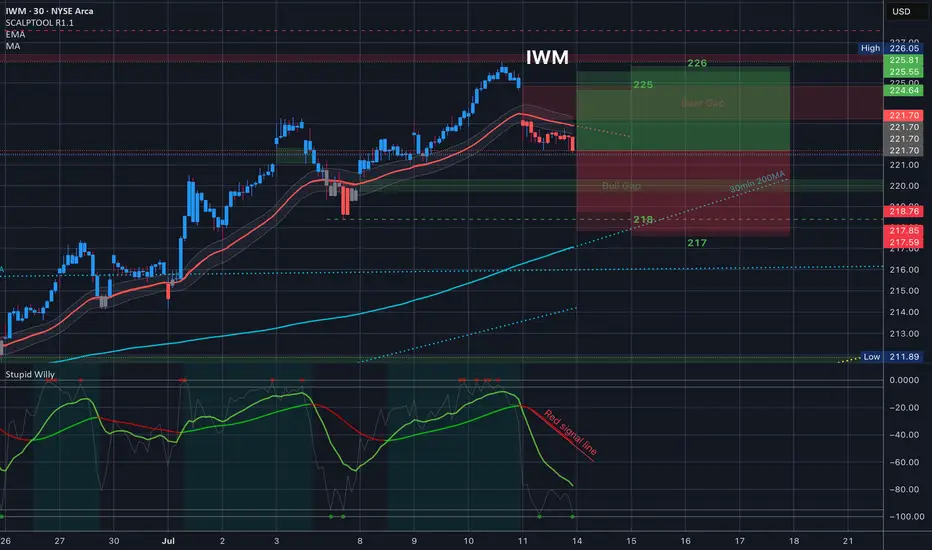
$IWM Tomorrow’s Trading Range and everything in it /// 7.14.25Tomorrow’s Trading range and everything in it. How are you playing it?
$DIA Tomorrow’s Trading Range and everything in it /// 7.14.25Tomorrow’s Trading range and everything in it. How are you playing it?

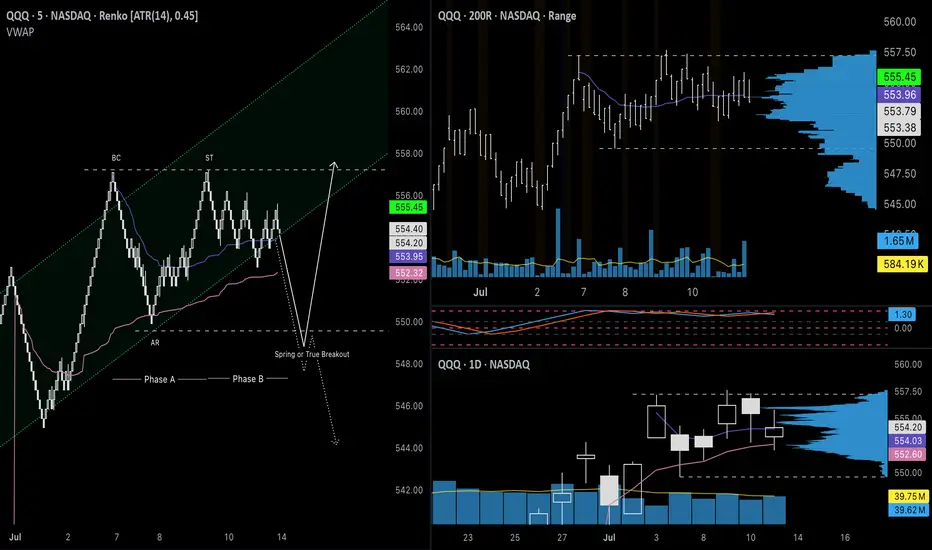
QQQ July 14th 2025I failed to update my trade journal at the end of last week and am going to try to be better about it this week. I am going to try to keep these posts more brief so I can remain consistent and meet my goal of creating an accurate timeline of my trades. For this week, I am going in with a bullish bias, which is better supported on the PA for NASDAQ:QQQ instead of AMEX:SPY , so I will be trading it instead.
The price is currently down 0.60% overnight, which would take the price near the bottom of the range ($550), which is outside of the channel. In this flat structure, we will either see the price break up after a liquidity test (spring) or break down in a true bearish reversal.
+++++++++++++++++++++++++++
Neutral Analysis
Renko: As my main chart, Renko clearly shows both scenarios, illustrated by the solid white (bullish) line and the dotted (bearish) line. For the bullish idea, the price will find a significant number of buyers after a false breakout to the downside. I switched from Traditional box sizes to ATR (14) filtered, and as you can see, the automatic rally (AR) after the peak did not have a significant retracement. We did not see a retest of the upper part of the range that could be considered a secondary test (ST) until some time later and when it did, the price rose back to the peak, indicating that buyers still had strength. From there, the price has been chopping around in Phase B without making much progress to the downside, which it will most likely reach on Monday in the form of a gap down. Additionally, the rising channel that led to this pullback is also a strong pattern, so this pullback should be treated as possible re-accumulation. If the price fails to reenter the channel or reach the top after a breakout below the range, it will likely sell off from there.
200R Chart: The range chart also supports that the secondary test was the retest of the top of the channel, a potential sign of strength. The price is still way above the 200MA, so the uptrend appears strong. One important area to watch is the volume gap from $548-$549 on the volume profile. If bulls cannot defend the gap, that could be a potential sign of weakness.
500R Chart: I am including this chart because it does provide a reason to be cautious of a pullback, or even a reversal. The price is at the top of the channel that began on April 9th. The last time the price tested the upper boundary, it formed a temporary top and pulled back, which we could see play out again here. The volume candles also show significantly higher interest since May 13th. This could either be due to increased interest from buyers or the distribution of shares, requiring more effort to move the price higher.
Daily Chart: Here is another chart that suggests that the first movement that could be considered a secondary test was the retest of the top of the range. The price has been bouncing off monthly VWAP and Fisher Transform remains flat in the upper zone. We have not seen a bearish candle with intent on the daily chart. These have all been flat doji candles.
Options: For this section, I can’t provide a good analysis of on-the-money options since the price is likely to gap down. I’m including 7/15 $550p since the price will likely open around that level and will need to move below the strike to see the premium rise significantly. The price of this contract was in a larger descending channel and will need a strong break above the top ($2.15) in order to signal further downside for $QQQ. According to my options calculator, this would require the underlying price to drop below $551 for an extended period.
+++++++++++++++++++++++++++
Targets
Calls: Open at $549; Close at $557; Stop below $548
Puts: Open $550-$552; Close at $544.50; Stop above $555
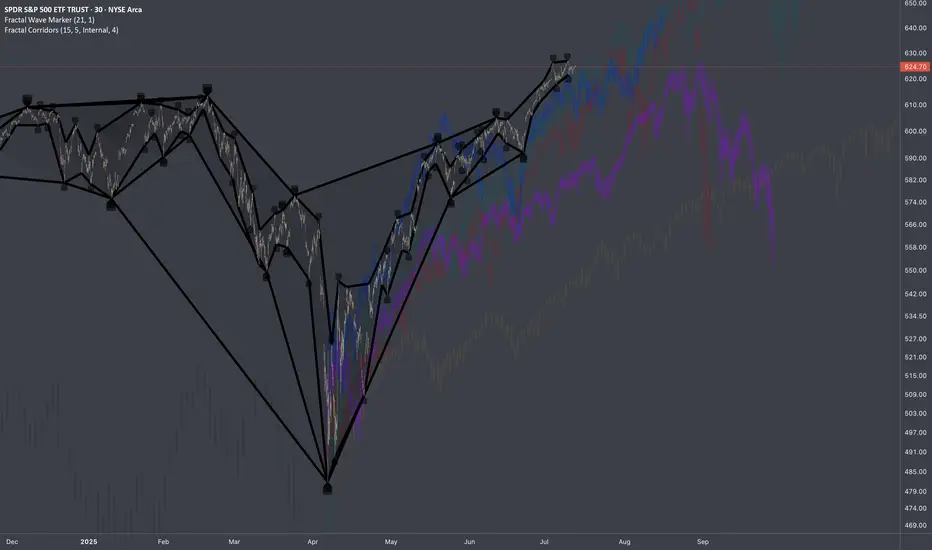
$SPY: Composite Sub-Cycles (Recursive)Research Notes Documenting Commonality
I’ve identified several bar patterns that formed following significant historical declines. They share notable similarities, as if suggesting that the magnitude of past major moves sets the structure of subsequent groups of sub-cycles (which I call "building blocks" sometimes).
I placed them in respect to current scaling laws so the method of exclusion can be applied in order to familiarize with typical "terrain" of price dynamics at such phase. Documenting them because a direct study is the most effective approach to uncovering the essence of recursive patterns.
Some of the bar patterns are lowered to highlight temporal aspect which matters more than price scale.
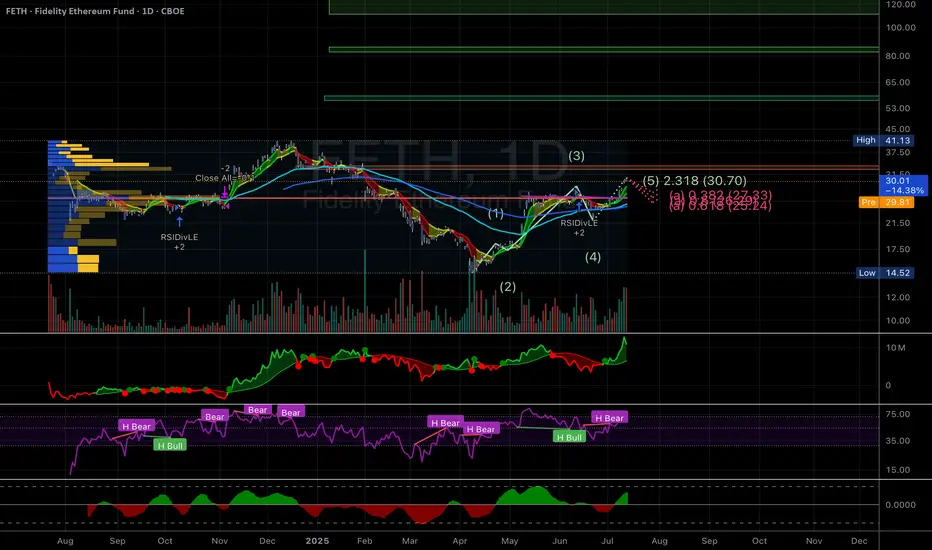
ETHU: High-Conviction Setup with Clear Risk/Reward (3:1)Ethereum's leveraged ETF CBOE:ETHU just printed a clean technical structure, sitting right above cloud support with a clearly defined trade plan:
📊 Technical Breakdown
Ichimoku Cloud: Price is hugging the flat Kumo, signaling consolidation but not breakdown. The cloud acts as support here.
MACD: Bearish momentum is fading, showing histogram compression and potential reversal soon.
Price Action: Holding above key demand zone with a risk-defined low. Multiple higher lows show bulls are still defending this level.
Target: $81.32 (+54% upside)
Stop: $42.33 (-17% risk)
R/R: 3:1 — clean asymmetric setup
This is a textbook swing setup: if ETH bounces, ETHU could run hard due to the 2x leverage.
🧠 Macro Context
Ethereum looks coiled on higher timeframes. A breakout in ETH could fuel a sharp ETHU rally. Watch BTC/ETH correlation and altcoin sentiment.
📌 Are you long ETH or ETHU right now? Would you take this setup or wait for confirmation? Drop your thoughts below.
#ETHU #Ethereum #CryptoETF #Ichimoku #SwingTrading #Altcoins #TechnicalAnalysis #TradingSetup

SPY Daily Chart – Rising Wedge at Resistance, RSI Near OverboughSPY continues to push higher, but today's candle reinforces a cautious tone as we approach a key inflection point.
The chart is currently forming a rising wedge pattern — historically a bearish structure that often precedes downside breaks, especially when forming after a strong upside move. Price is hugging the upper boundary of the wedge, with multiple failed breakout attempts near 626.87, which is acting as strong resistance.
The RSI sits at 68.59, just below the 70 overbought threshold. While this confirms strong bullish momentum, it also signals that the move may be getting stretched. A rejection here or a lower high on RSI while price continues higher could form a bearish divergence, a classic early reversal signal.
Volume remains moderate (~51.85M), and the candles have tightened — suggesting indecision. The rising wedge’s lower trendline and the short-term moving average (likely the 8 or 10 EMA) are immediate support. A break below these levels would shift the bias more clearly to the downside.
Key levels to watch:
Resistance: 626.87 (wedge top)
Support: rising wedge lower boundary and EMA (around 620–622)
RSI: break below 65 or a confirmed divergence would increase bearish risk
If the wedge breaks down with a drop in RSI and a flip in momentum indicators (such as Parabolic SAR), it may open the door for a pullback toward previous support zones near 603 or even 592.63.
No confirmation yet, but the risk-reward here starts to shift away from chasing longs. Caution is warranted.

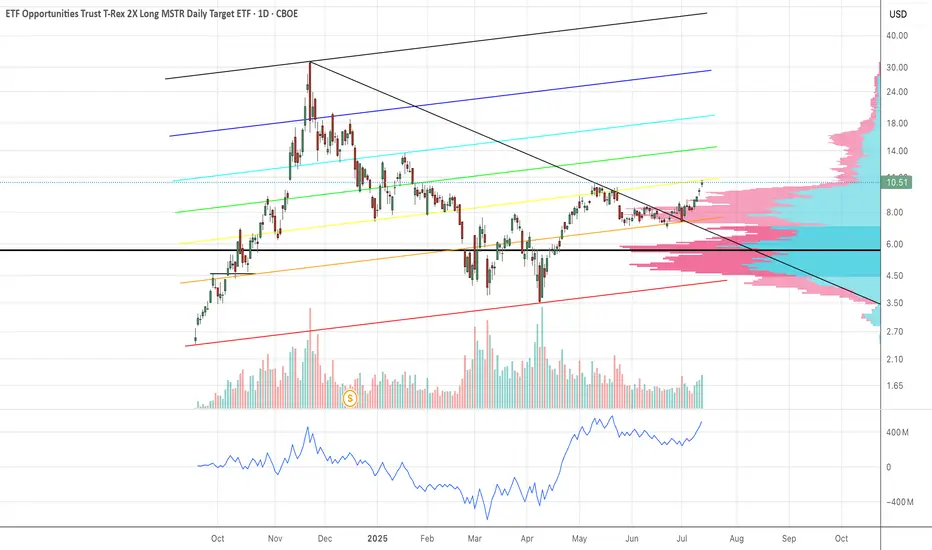
MSTU It's not for youI bought the Monday after the first full week MSTU came on the market. I knew about it ahead of time, and I was tracking it. I bought pre-split. Now, the OBV is looking up again, and we could be in for round 2.
Nightly $SPY / $SPX Scenarios for July 15, 2025🔮 Nightly AMEX:SPY / SP:SPX Scenarios for July 15, 2025 🔮
🌍 Market-Moving News 🌍
📦 Dow Futures Dip on New Tariff Announcements
President Trump announced new 30% tariffs on EU and Mexico, with additional duties on Japan, South Korea, Malaysia, Kazakhstan, South Africa, Laos, and Myanmar starting August 1. Dow, S&P, and Nasdaq futures each slipped ~0.3% as markets assess inflation risk ahead of key CPI data this week
📈 Tech & AI Stocks Lead Despite Tariffs
Stocks like Circle (+9.3%), CoreWeave (+5.2%), Palantir (+5%), Roblox (+5.8%), and Shopify (+4.1%) surged, showcasing sector resilience amid broader tariff fears
⚠️ Deutsche Bank Warns of Summer Volatility
With thin market liquidity and rising geopolitical tension (tariff deadline Aug 1), Deutsche Bank flags summer as a period prone to sudden corrections
📊 Key Data Releases & Events 📊
📅 Tuesday, July 15:
8:30 AM ET – CPI (June)
Core CPI is projected at +0.3% MoM (2.7% YoY) and headline CPI +0.3% MoM—signs tariff effects may be feeding into prices
8:30 AM ET – Core CPI (June)
Expected to come in around 3.0% YoY.
8:30 AM ET – Empire State Manufacturing Survey (July)
Forecast: –7.8 (less negative than June’s –16.0) — a modest sign of stabilizing factory conditions
Fed Speakers Throughout the Day
Watch for commentary from Fed officials (Michael Barr, Barkin, Collins, Logan) for fresh insights on inflation and monetary policy
⚠️ Market Interpretation:
Inflation Watch: A hotter-than-expected CPI could delay anticipated rate cuts and lift yields. A pick-up in core CPI above 3% would be a red flag.
Growth Signals: A less-negative Empire State reading may suggest improving industrial momentum but still signals contraction.
Political Risk: Tariff escalation could shift investor appetite, even if markets right now are focusing on broader macro narratives.
Volatility Setup: The combination of thin liquidity, tariff uncertainty, and critical data makes for a potentially choppy week.
📌 #trading #stockmarket #economy #inflation #tariffs #Fed #CPI #manufacturing #technicalanalysis

ARKQ heads up at $83.xx: Proven Resistance break should RUN hardARKQ about to try a well proven resistance again.
Dual fibs mark the rejection zone $82.83-83.34
Looking for a Break-and-Retest for long entries.

KRE eyes on $54.xx: Major Resistance zone to Break or RejectKRE recovering nicely from the tariff tantrums.
But up against a major resistance zone $54.23-54.79
Want a Break-n-Retest or dip to lower fib at $51.39

NLR eyes on $111.03: Golden Genesis fib holding up new ATH NLR NLR struggling with this Golden Genesis fib at $111.03
Ultra High Gravity fib has shown its strength repeatedly.
This push might be "the one", the one to finally break away.

SPY: Aiming 626 today Slowly./ Let's observe what this market will give us. If there is a setup, we take the trade.
