RARE EARTH : Energy burnHello, what'sup ?
Me nothing.
Ok so, we have a good call here, 10 years of accumulation.
MASSIVE H&S inverted. Target 142 dollars : 250% if you enter at 49 dollars.
Dollars is weak, they print it again. Don't lose your money in bank.
Good luck
ETF market

DRIV eyes on $24.00: Golden Genesis fib holding orbit over 3 yrsDRIV is once again testing the Golden Genesis at $24.00
Ultra High Gravity fib has held it in orbit for over 3 years.
Break and Retest should start the next Leg with vigor.
Looking for a Retest entry to pop to $26.13 minimum.
==================================================
.

BTCI – setting up for a breakout?What is CBOE:BTCI ?
BTCI is the NEOS Bitcoin High Income ETF – a covered-call ETF designed to provide exposure to Bitcoin price trends with monthly income. The fund uses options strategies to generate consistent yields while holding Bitcoin futures and related instruments.
💰 Annual dividend yield: approx. 18%, paid monthly
📆 Ideal for income-focused investors who still want crypto exposure without direct volatility.
CBOE:BTCI Current price: $59.64
Strong volume is building up (green arrow), and the stochastic oscillator shows bullish momentum returning.
Price is consolidating just under the resistance at $60.90–61.75, with a potential upside of +13.2%, targeting the $67.09 zone.
📈 If volume holds and breaks above $61.75, the move toward the target becomes likely.
🟩 Key support: $58.07 / $55.75
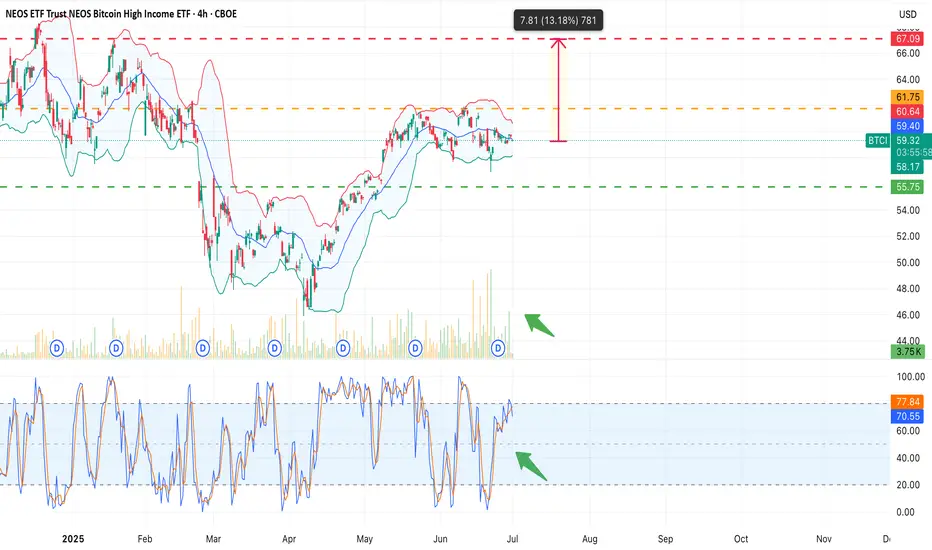
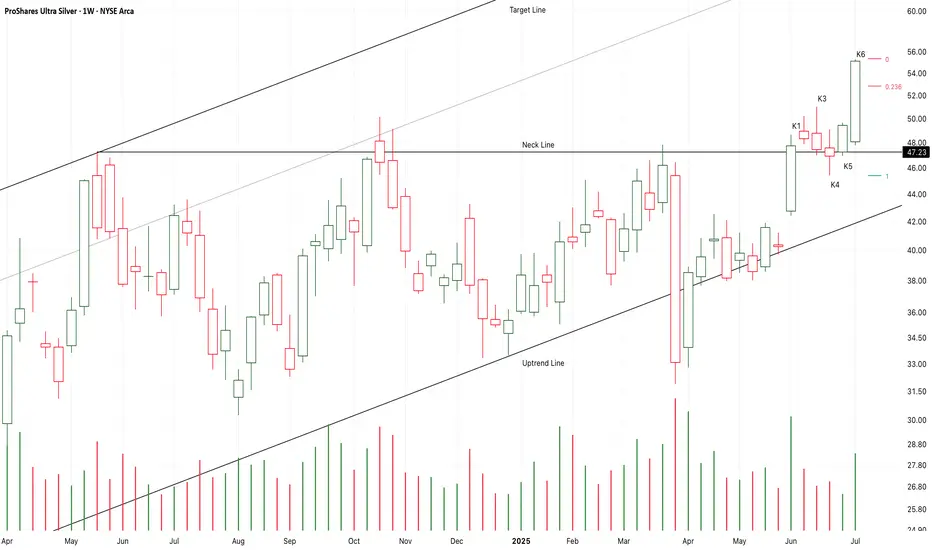
Chart Pattern Analysis Of AGQ
From K1 to K6,
It is a strong bullish three methods pattern,
It close upon the neck line of a potential bullish triangle.
It seems that the market will keep accelerating here.
So, I bought a small portion of AGQ at 55.35USD.
It is more and more clearly that the expensive metal such as Gold \Copper \ Ag is in the strong bullish market.
I will keep to buy in if the following candle fall to test 52.8USD area.
Long-55/Stop-50/Target-72
Long-52.8/Stop-50/Target-72
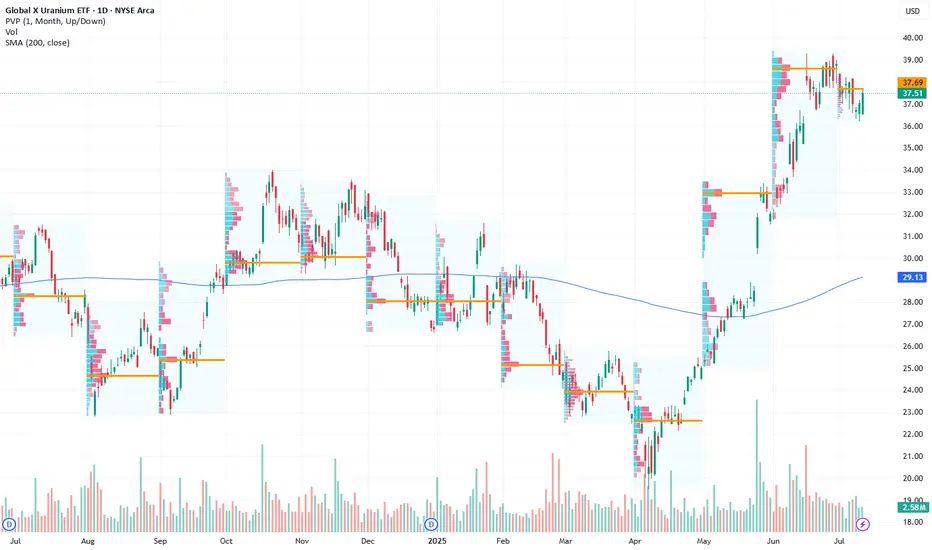
Global X Uranium ETF: Positioned for Growth Amid Rising Nuclear Current Price: $37.51
Direction: LONG
Targets:
- T1 = $39.00
- T2 = $40.50
Stop Levels:
- S1 = $36.50
- S2 = $35.75
**Wisdom of Professional Traders:**
This analysis synthesizes insights from thousands of professional traders and market experts, leveraging collective intelligence to identify high-probability trade setups. The wisdom of crowds principle suggests that aggregated market perspectives from experienced professionals often outperform individual forecasts, reducing cognitive biases and highlighting consensus opportunities in Global X Uranium ETF.
**Key Insights:**
The Global X Uranium ETF (URA) is strategically positioned to benefit from renewed interest in nuclear energy as a critical solution for low-carbon energy goals. With nuclear power gaining traction globally as a stable and clean energy source, demand for uranium—the primary input for nuclear reactors—is projected to rise significantly. Recent price action shows the ETF consolidating in a pivotal range, indicating investor positioning ahead of a potential breakout, as bullish trends dominate sector sentiment.
One of the key factors supporting URA's potential is the structural supply deficit in the uranium market. This imbalance has been exacerbated by declining production in recent years, matched against increasing demand fueled by energy diversification strategies around the world. The ETF's portfolio composition, focusing on uranium miners and producers, offers direct exposure to this secular growth trend.
**Recent Performance:**
URA has displayed resilience above the $35 level over the last few weeks, consolidating gains amid temporary pullbacks in commodity markets. Despite some volatility in broader markets, the ETF has maintained a consistent upward trajectory, reflecting strong investor confidence in the uranium sector's long-term prospects. A recent test of the $37.50 level indicates strengthening support zones that could propel future moves higher.
**Expert Analysis:**
Professional analysts remain broadly optimistic about URA's potential, citing technical indicators and macroeconomic drivers backing its growth. Key resistance is identified at $39 and subsequently $40.50—levels that could trigger a sustained rally if breached. Technical support at $35.75 provides a risk-managed floor for traders, ensuring balanced positioning in case of short-term retracements. Furthermore, fundamental analysts highlight the operational leverage of uranium miners as the underlying commodity's price continues to recover.
**News Impact:**
Global energy policies emphasizing carbon neutrality have thrown a spotlight on nuclear power as a viable alternative to fossil fuels. Recent government commitments to expand nuclear capacity globally reinforce the bullish narrative for uranium demand. In addition, supply-side constraints due to limited mining activity and geopolitical factors are likely to sustain upward pressure on uranium prices, translating to healthy returns for URA investors.
**Trading Recommendation:**
Investors should consider a long position in URA, taking advantage of its exposure to a sector positioned for significant growth. Current technical levels suggest a bullish breakout toward $39 and $40.50, while stop levels at $36.50 and $35.75 ensure disciplined downside protection. As nuclear energy gains momentum in the global transition to sustainable energy, URA represents an attractive opportunity to capitalize on this transformative trend.
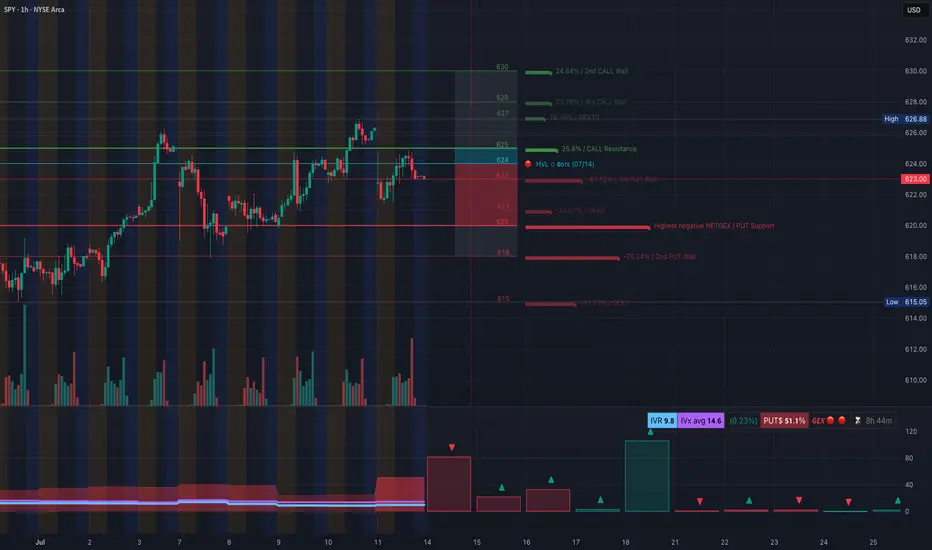
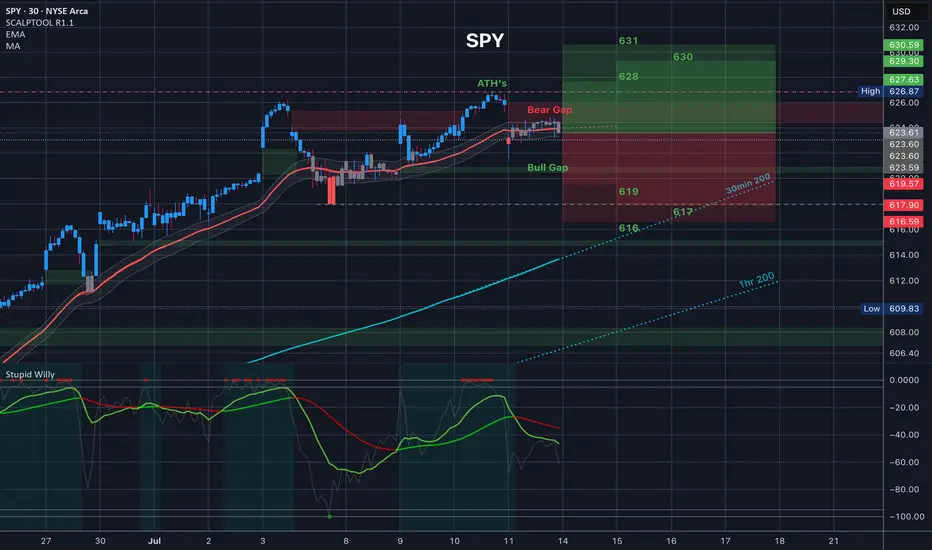
SPY: Bearish Gamma Pin Threatens Breakdown. TA for July 14SPY: Bearish Gamma Pin Threatens Breakdown – What to Watch This Week 🧨
🔸 GEX-Based Options Sentiment (Tanuki GEX Zone)
* GEX Summary:
* Highest Call Wall (Resistance): 625–628 → strong resistance zone.
* Highest Put Wall (Support): 618 → major gamma defense line.
* GEX Flip Zone / NETGEX Support: around 620, where negative gamma begins accelerating downside moves.
* Current GEX Bias: Bearish
* GEX: 🔴
* IVR: 9.8 (very low)
* PUTs %: 51.1% (risk off bias)
* Call walls stack above, forming a clear ceiling.
* Interpretation & Options Strategy:
* As long as SPY trades below 625, the call resistance stack and bearish gamma exposure favor PUT buyers.
* Breakdown below 620 may trigger an acceleration to 617 and even 615 where deeper PUT walls exist.
* Avoid calls until SPY reclaims and holds 626.88+.
* ✅ Suggested Options Play (Bearish Bias):
* PUT 620p / 618p, 0DTE–2DTE if under 623.
* Stop if price holds and reclaims 625.50+ with volume.
🟦 1H Chart Analysis – Price Action, SMC, and Trade Setups
* Market Structure:
* After the recent BOS, price formed a tight rising wedge, then broke CHOCH and now sits inside a retest box.
* This shows distribution behavior and vulnerability to breakdown.
* A clear CHOCH + BOS sequence is already completed on the 1H.
* Current Range & Zones:
* Consolidation Box: 621.50–625.50
* Trendline Support (lower channel): 621–620
* Demand Zone (H1): 617–618
* Critical Liquidity Below: 615–613.50
* Trade Setup – Scalp/Swing View:
Bearish Scenario (More Likely):
* 🔻 Entry: Under 623 with confirmation
* 📉 Target 1: 620
* 📉 Target 2: 617.50
* ❌ SL: 625.50
* 📈 Optional hedge/reversal: Flip long if 626.88 reclaims (very aggressive).
* Bullish Scenario (Low Probability unless reclaim):
* ✅ Entry: Above 627
* 🎯 Target 1: 629–630
* ❌ SL: Below 625
🧠 Final Thoughts:
* SPY is currently sitting in a gamma trap zone, where it’s pinned between major put support (620) and call resistance (625+).
* If price slips below 620, gamma forces could rapidly drive it to 617–615 zone.
* Until we see strength above 626.88, the path of least resistance remains down.
⚠️ Disclaimer:
This analysis is for educational purposes only. Always do your own research and manage risk properly before trading.
$SPY Tomorrow’s Trading Range and everything in it /// 7.14.25Tomorrow’s Trading range and everything in it. How are you playing it?
XLB eyes on $85: Proven Support zone to End Bounce or to Break?XLB has recovered the tariff tantrum dumps.
But struggling against a proven resistance zone.
Dip is likely, Break-n-Retest means Strong bull.
$84.61-85.24 (red) is the exact zone of concern.
$79.66-80.27 (green) is first strong support below.
$71.71-72.23 (Gold) a double golden major support.
=============================================

Weekly $SPY / $SPX Scenarios for July 14–18, 2025🔮 Weekly AMEX:SPY / SP:SPX Scenarios for July 14–18, 2025 🔮
🌍 Market-Moving News 🌍
⚖️ Powell Faces ‘Epic’ Trade‑Inflation Dilemma
Former Fed economists warn Chair Powell is navigating nearly unprecedented terrain: tariffs are pushing up prices even as the labor market cools. Striking a balance between inflation control and growth support remains a formidable challenge
📊 Tariff‑Driven Inflation May Peak This Week
June’s CPI is expected to show a 0.3% month-on-month increase, potentially lifting core inflation to ~2.7%—its highest level in 18 months. These data will heavily influence the Fed’s decision-making process
🏦 Big Bank Earnings Kick Off
Earnings season begins with JPMorgan ( NYSE:JPM ), Goldman Sachs ( NYSE:GS ), Wells Fargo ( NYSE:WFC ), and Citigroup ($C) reporting. Strong results could offset trade and inflation anxieties; expect volatility in financials
📈 Goldman Sees Broader S&P Rally
Goldman Sachs projects the S&P 500 to climb roughly 11% to 6,900 by mid‑2026, underpinned by firm earnings and expected Fed rate cuts. But warns that breadth remains narrow, increasing downside risk without robust participation
⚠️ Summer Volatility Risk Lingers
Deutsche Bank warns that summer’s low liquidity and the looming Aug 1 tariff re‑imposition deadline may spark sudden market turbulence—even amid bullish sentiment
📊 Key Data Releases & Events 📊
📅 Monday, July 14
Quiet start—markets digest back-to-back CPI, tariffs, and clearing post‑earnings.
📅 Tuesday, July 15
8:30 AM ET – Consumer Price Index (June)
Watch for potential tariff impact in CPI; core inflation data are crucial.
8:30 AM ET – Core CPI (June)
10:00 AM ET – Empire State Manufacturing Survey (July)
Early view on Northeast factory trends.
📅 Wednesday, July 16
8:30 AM ET – Producer Price Index (June)
Wholesale inflation signals to validate CPI trends.
10:00 AM ET – Housing Starts & Building Permits (June)
📅 Thursday, July 17
8:30 AM ET – Initial & Continuing Jobless Claims
A gauge on labor-market resilience amid talks of cooling.
📅 Friday, July 18
10:00 AM ET – Federal Reserve Beige Book Release
Fed’s regional economic snapshot ahead of next FOMC.
⚠️ Disclaimer:
This is for educational/informational use only—not financial advice. Consult a licensed professional before investing.
📌 #trading #stockmarket #economy #tariffs #inflation #earnings #Fed #CPI #technicalanalysis

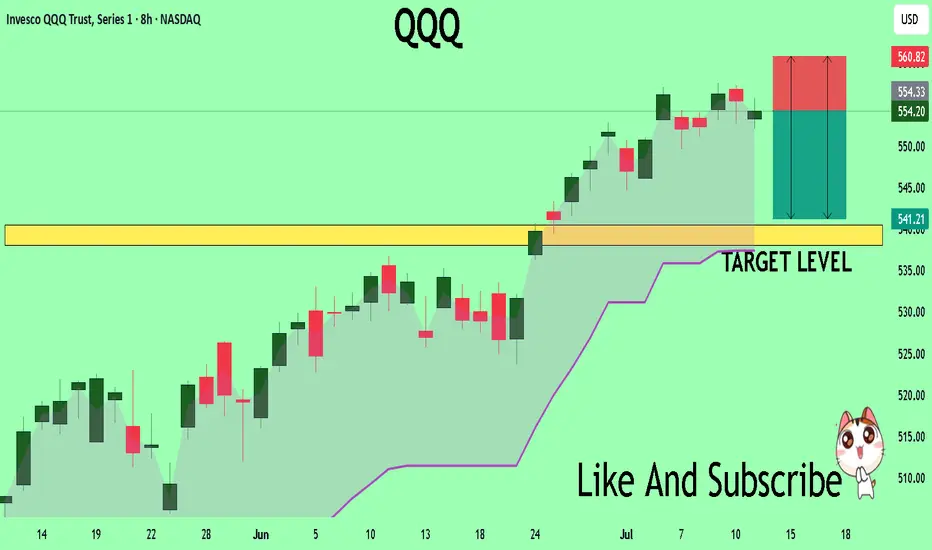
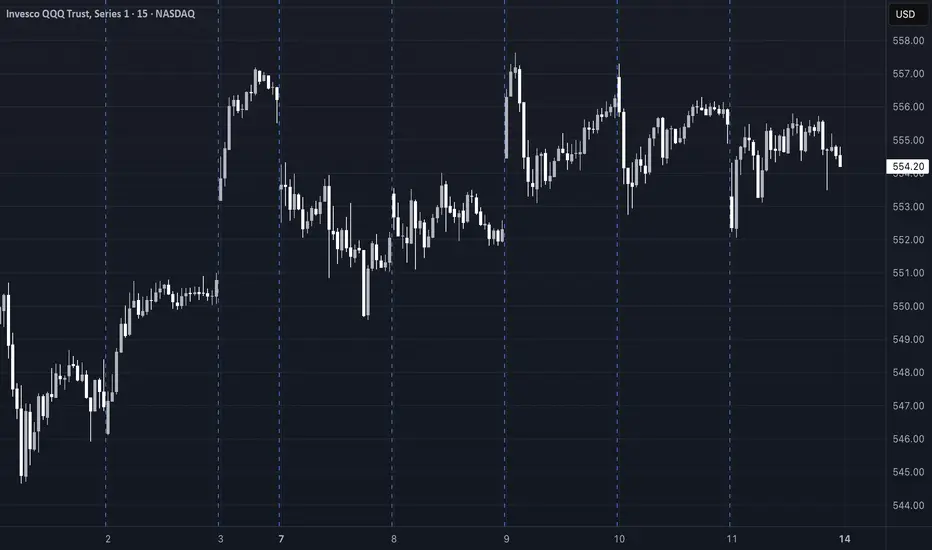
QQQ What Next? SELL!
My dear followers,
I analysed this chart on QQQ and concluded the following:
The market is trading on 554.20 pivot level.
Bias - Bearish
Technical Indicators: Both Super Trend & Pivot HL indicate a highly probable Bearish continuation.
Target - 540.50
Safe Stop Loss - 560.82
About Used Indicators:
A super-trend indicator is plotted on either above or below the closing price to signal a buy or sell. The indicator changes color, based on whether or not you should be buying. If the super-trend indicator moves below the closing price, the indicator turns green, and it signals an entry point or points to buy.
Disclosure: I am part of Trade Nation's Influencer program and receive a monthly fee for using their TradingView charts in my analysis.
———————————
WISH YOU ALL LUCK
SpyBig week here. Rarely do you get big banks and big tech earnings on the same week..
Jpm, Goldman sach, and JNJ are dow jones heavy weights.
This is important because I think Dow will close that gap at 44,850 and most likely retest ATH at around 45,000.
As long as dow closes above 44,200 Monday, they will do this move
Now logically you have to ask yourself, If Dow jones moves 800pts or 2% what will spy do?
Well unless Nasdaq gives it all up early in the week then Spy will grind higher..
NASDAQ:QQQ
2hour chart is mimicking
June's price action
Even similar bearish Divergence on RSI
So will tech Roll over this week?
TSM and NFLX both reporting..
Qqq 30min price action, as long as price holds above 548.50 I wouldn't short this at all
As you can see with the yellow channel price will be range trading between 551-555. Over 558 and 560 comes.. below 548 and 544 comes.
This is actionable trading, I know some of you want a bigger picture on the short side but until we break below the 20sma I really don't like going full bear at the beginning of earning season...
Yes, alot of things are flashing red signaling a major correction is looming , for Example here's XLC. This is the sector of NASDAQ:NFLX and NASDAQ:META
Here's the weekly chart and RSI
Very bearish bigger picture here, I could easily see this sector and the big names inside it going back to April lows
But then You have AMEX:XLY
The sector of NASDAQ:AMZN and NASDAQ:TSLA
Nothing is bearish Herr and as long as it holds 217 they are going to push this back to ATH.
NASDAQ:AMZN chart is completely identical
So let's say NFLX and Meta have down days similar to last Friday but Amzn and Tsla pumps then you will get a small pullback unless the chipsector dumps also 😉. Remember there's always a bull in the market, they'll just rotate into something less overbought..
Only time you really see majority selling off is when there is a catalyst (Carry trade, tariffs) or Seasonality (March, Sept)..
So I'm bearish on Chips NASDAQ:SMH and I'm bearish on AMEX:XLC but you have to be selective..
I wouldn't short
NASDAQ:TSLA
NASDAQ:AMZN
NASDAQ:GOOGL
NASDAQ:AAPL
Those stocks will likely outperform this Quarter.
As far as the banks earnings , even if they pop, I think this will be a sell the news event and this sector AMEX:XLF (Big banks) is headed for a massive correction
The Small banks AMEX:KRE
Have almost completed their V shape recovery and will most likely correct after this week
Daily technicals are overbought similar to IWM but the weekly is where you see caution
Top of weekly Bollingerband always leads to a major sell the following week
AMEX:SPY
15min chart
I'm bullish early in the week, I think they will buy the dip ahead of earnings so if they open up near Friday's low or the 15min 200sma they could buy it there, below 621 and they will go for the gap close at 620; that will be another dip buy opportunity . Stop loss 619.00
Below 619.00 and they have a gap left open at 614.84 to close. Stop loss 15min 200ma
Trade Idea of the week is NASDAQ:GOOGL
Bullish ascending triangle forming under 182.00 resistance.. Price may breakout this week
4hour chart Friday finished with a Shooting star so we could start the week with a pullback but I think googl will hold 177.00 support and that's a good entry for a long.. or wait for conformation which would be a break above 182.00..
So 177 or 182 is my entry
Googl is only bearish below 172.00 or 200ma
Personal opinion This administration Has promised 200 trade deals and have gotten only 3 so far. As we get closer and closer to August investors will get nervous and I think we will see another major sell! He's has kicked the tariff can down the road as far as it can go and still these countries are calling his bluff. Becareful because I think the next time trump won't fold
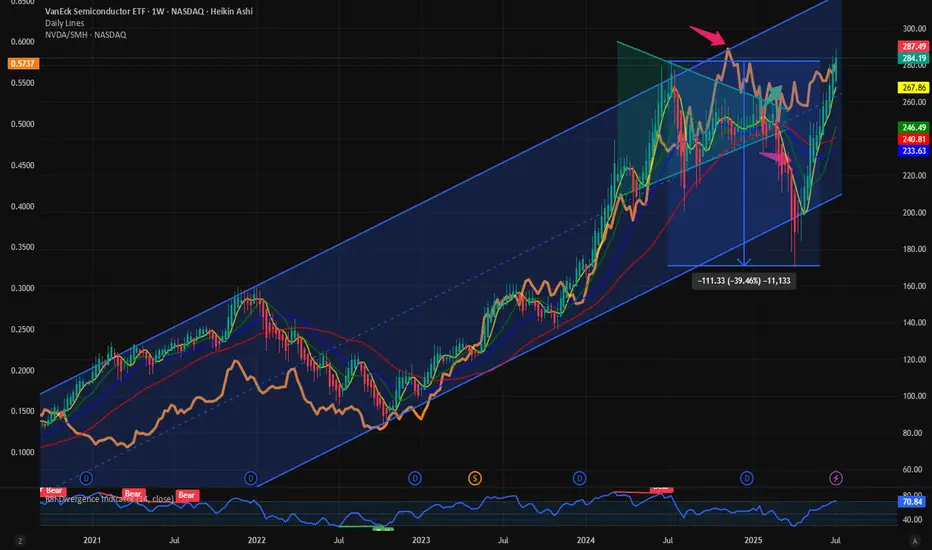
$SMH and $NVDA Dominance: Some more room to run for bothWith NASDAQ:NVDA and NASDAQ:SMH above their respective ATH the focus returns to the fact how far we can expect for both to outperform and make new highs. In this Blog we floated the idea of NASDAQ:NVDA dominance. This indicates the % of return / price movement in NASDAQ:SMH contributed by NASDAQ:NVDA as it is a cap weighted index. It captures the outperformance of the high momentum stocks like NASDAQ:NVDA and $AVGO.
On May 12 I predicated that NASDAQ:NVDA will reach 170$ before end of summer. And we are very close to our price target.
NASDAQ:NVDA : Full on Bull mode. 170 $ before end of Summer for NASDAQ:NVDA by RabishankarBiswal — TradingView
On May 30 we also favoured NASDAQ:SMH over AMEX:HACK and said that the momentum will continue and NASDAQ:SMH will touch new ATH. And here we are with NASDAQ:SMH above 280$.
NASDAQ:SMH vs AMEX:HACK : Recent good correlation with breakout potential for AMEX:HACK by RabishankarBiswal — TradingView
Now the question comes , how far these 2 can go and the bigger question is will NASDAQ:NVDA claim its Dominance in NASDAQ:SMH ? As you can see in the chart below the NASDAQ:NVDA Dominace in NASDAQ:SMH peaked at 0.6 or 60% on Nov 11. Currently we are @ 57% and still below its ATH. My estimate is NASDAQ:NVDA will claim its Dominance and go to the highs of 65% before SMH also completes it highs in this upward slopping channel with 315$ as my price target on $SMH.
Verdict: NVDA Dominance in NASDAQ:SMH can reach 65%. NASDAQ:SMH Target 315 $. NVDA Price target remains 170$ and above.
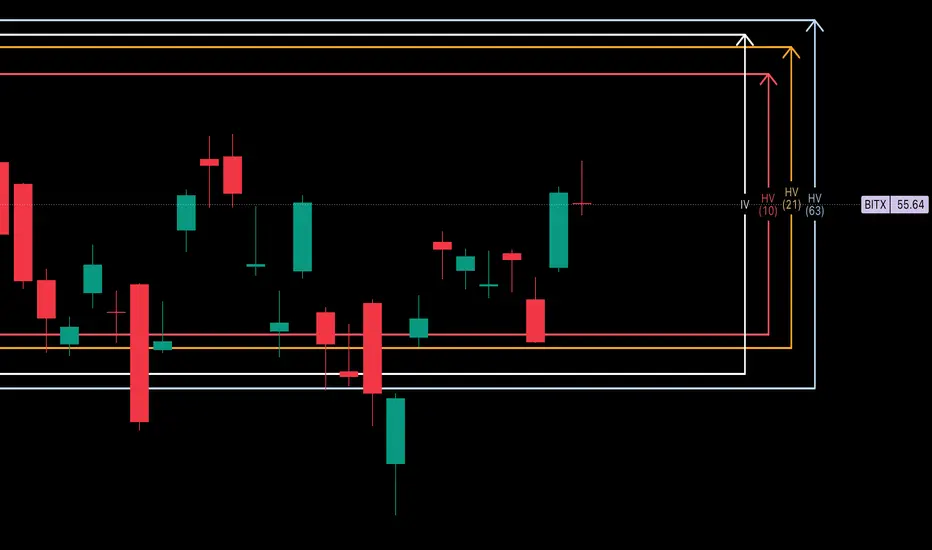
BITx -- Weekly Volatility SnapshotHello Bitcoin community 🤠👾🤑👾🤠
Good morning/Good afternoon, maybe goodnight to you pending where you are in the world!
Nonetheless, I'm glad you found me because here we are going to look over our weekly historical volatility ranges on CBOE:BITX and assess where IV is in perspective to what's trending. Then we will talk targets within my custom adjusted implied weekly ranges.
Entering the week, IV (76.86%) is projecting +17.74% more than what short-term trending markets are showing with HV10 (59.12%) holding a 'strength of IV' of only 76.91%. This is a price differential on the week of -$1.19. Our monthly values with HV21 (71.20%) are hinged slightly below IV, showing a 'strength of IV' slightly more at 92.64%.
In my opinion looking towards this week, IV may be painting the bigger picture of price distribution upwards towards quarterly trends. It is expansive from past weeks and above short-term trending markets with a wider range and with IV percentile slowly creeping up.
If the trend holds that started last week, my price target will be HV63 at $61.07 which draws confluence with the correction impulse wave top of $60.39 -- a price action to implied calculation difference of only +/-$0.69. Fantastic , right?!? This would take BTC approaching new ATHs again. If price action can find quarterly trends we will be seeing a 'strength of IV' of 108.44% -- only slight advantageous over IV premium.
In the end, markets are unpredictably wild and we can only assess and reduce our risk using the tools provided. Always remember your ABCs and to hedge your bias! Come back next week as we recap how the weekly volatility unfolded.
Cheers!
Inevitable Pull Back Coming Soon? | NVDA TSLA AAPL AMZN META MSFStock Market Forecast | CME_MINI:ES1! CME_MINI:NQ1! SPY QQQ
Mag 7 Forecast | NASDAQ:NVDA NASDAQ:TSLA AAPL AMZN META MSFT July 2025 Forecast

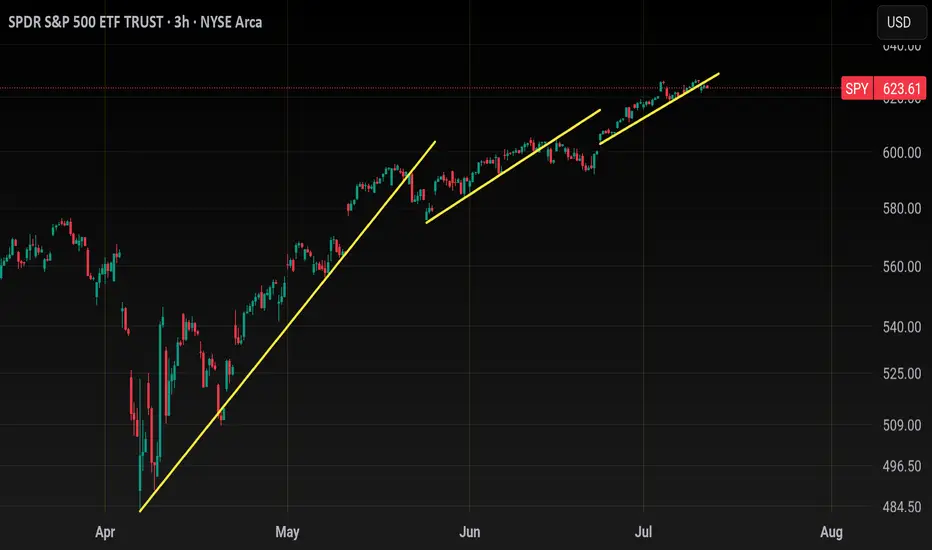
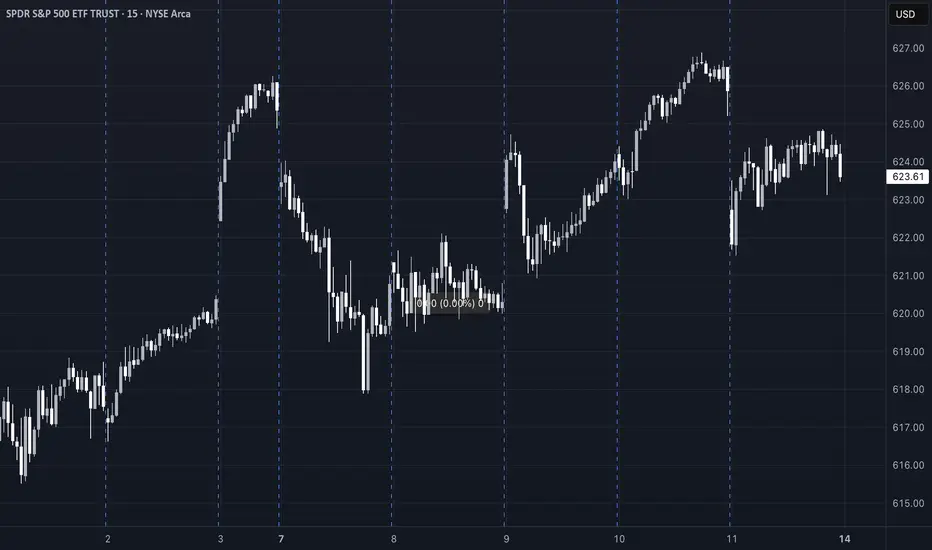
SPY: Short Signal Explained
SPY
- Classic bearish formation
- Our team expects pullback
SUGGESTED TRADE:
Swing Trade
Short SPY
Entry - 623.61
Sl - 633.09
Tp - 606.99
Our Risk - 1%
Start protection of your profits from lower levels
Disclosure: I am part of Trade Nation's Influencer program and receive a monthly fee for using their TradingView charts in my analysis.
❤️ Please, support our work with like & comment! ❤️

How Much Risk Are You Really Taking?
I get two common horror stories from new QS members:
“I followed a few QS signals, nailed some wins… then bled it all back.”
“My first couple signals lost, and my account was toast.”
My first question to both groups is always the same:
“How much risk did you assign to that trade?”
❌ Why Most Traders Dodge This Question
Risk management isn’t sexy.
Green arrows and slam‑dunk gains are fun to talk about. Stop‑losses and position sizing? Not so much.
Gambling feels easier than math.
Going “all‑in” gives you the casino rush. Calculating max drawdown does not.
Accountability hurts.
If the trade blows up, there’s no one to blame except the person who sized it.
⚔️ Trading = War (No, It’s Not “Fun”)
Like I said in “What’s Your Catalyst?” — trading is financial warfare.
Show up without armor (risk rules) and you’re the first casualty.
In basketball you need defense before dunks.
In war you need body armor before bullets.
In trading you need risk management before any strategy.
📏 My Simple Rule
Only risk what you’re prepared to watch burn—completely.
If the idea of that money turning to ash makes you queasy, you’re oversized. Period.
🧠 Questions to Ask Before Every Trade
Position size: How many dollars exactly can I lose and still fight tomorrow?
Probability: Is this setup strong enough to justify that risk?
Stop‑loss: Where is my hard exit? No “I’ll see how it feels.”
Reward‑to‑risk: Is the upside worth at least 2–3× the downside?
Confidence check: If I’m not 100 % cool watching this cash burn, why am I risking it?
🚀 Pair Your Edge with Protection
AI and QS signals give you edge — a slightly better chance in a brutal game.
But edge without risk control is like a sniper without body armor: lethal until one bullet hits.
Next time you celebrate a hot streak or curse a quick wipe‑out, pause and ask:
“How much risk did I really assign to this trade, and was it worth it?”
If you can answer honestly and still sleep at night, proceed.
If not, size down, armor up, and protect your capital first.
Strong defense wins championships — and trading accounts. 🛡️💰

The Myth of Win RateOne of the most common questions I get from QS members:
“What’s the win rate of the signal?”
Sounds like a smart question. But it's often coming from the wrong mindset — the same mindset as a student cramming for a test, hoping for one perfect answer key that’ll give them a 90% score and an easy win.
Let me break this down for you:
🧮 The Only Two Numbers That Matter in Trading
There are only two math truths that actually grow your account:
Win Rate – how often you’re right
Win/Loss Ratio – how much you make when right vs. how much you lose when wrong
Everyone obsesses over #1.
Almost no one truly understands or applies #2 — and that’s the real killer.
---
🤔 So What’s the Ideal Setup?
In a perfect world, you’d have:
A high win rate (80–90%)
AND a high win/loss ratio (make $3, lose $1)
But guess what?
This isn’t a perfect world — this is a war.
See my earlier post: "What’s your catalyst?"
---
⚔️ Trading Is Like War (or Sports)
In war, victory is rare and costly.
In sports, scoring takes hard work, timing, and discipline.
In trading:
You win big when the odds are stacked in your favor
You cut losses quickly when you’re on the wrong side
That's the gold standard — but few do it.
Even worse, many do the exact opposite:
Take quick profits to “lock in a win”
Let losers run hoping for a miracle
Then they wonder why their account bleeds over time.
---
🎰 Vegas Was Built on 51% Win Rate
Casinos don’t need to win every game. They just need:
Slightly better than 50% edge
Strict control over risk and payout
That 1–2% edge? It built every billion-dollar casino on the Strip.
Now think again:
Why are you chasing a 90% win rate when even 55% + smart risk control can make you rich?
---
🧠 Profitability > Win Rate
You don’t need to win all the time.
You need to win big enough and lose small enough.
Your goal should be:
3 steps forward, 1 step back.
That’s the realistic rhythm of trading success.
---
✅ So Next Time You Ask About a Signal...
Don’t just ask:
“What’s the win rate?”
Instead ask:
“What’s the reward if I’m right?”
“What’s the damage if I’m wrong?”
“How do I size this trade so my wins outgrow my losses over time?”
This is how real traders think.
Not about perfection — but about probability, edge, and sustainability.
---
💬 TL;DR
Win rate is just one piece.
Your win/loss ratio and risk management matter more.
Profitability > accuracy.
The market doesn’t reward perfection. It rewards preparation, defense, and discipline.
Keep playing smart, not perfect.
And remember — it’s a long game. 🧠📈
Select Your Trading Time
There’s an old saying:
“Plan your trade, and trade your plan.”
But I want to add something even more important:
“Pick your time to trade.”
---
💰 The Market Is Not Your ATM
Everyone enters trading with one goal: make money.
Some even think of the market as an ATM — pull the handle, cash comes out.
But the truth is:
❌ The market doesn’t care about your goals
❌ It won’t move just because you need to make money today
This is a brutal game. And you don’t control the clock.
---
⚠️ When You Force a Trade...
Too many traders say:
“I have to make money today.”
“I need to hit $X this week.”
“I just took a loss, I must come back now.”
That kind of thinking leads to:
Bad entries
Overtrading
Emotional decisions
Big losses
❗ Trading success doesn’t come from forcing outcomes — it comes from waiting for the right moments.
---
🧠 What Happens on Low-Volatility Days
Let’s take today as an example.
SPY moved in a 2-point range all day.
No momentum, no trend, just chop.
Some traders:
Ran one QS signal after another
Forced trades just to feel busy
Got chopped up by fast reversals
Then blamed the signals
But here’s the truth:
AI or not , you can’t expect any long-volatility trade to work when the market is dead still.
The only winners on days like today? Market makers and options sellers.
---
❓ Why Trade at All on a Day Like This?
If the market isn’t offering opportunity,
Why force it? Why chase trades? Why burn your energy?
The smarter move is:
Sit out
Observe
Wait for better setups
Preserve your mental and financial capital
---
🔄 Recovery? Yes — But on Your Terms
Some traders lose money and say:
“I need to make it back today.”
That’s emotional revenge trading.
What if the market doesn’t give you a clean opportunity today?
Are you still going to go all-in, out of frustration?
❌ That’s not a strategy. That’s gambling.
---
📍 QS Signals Are a Map — Not a Magic Button
QS AI signals help you find opportunities — but even the best map won’t help if:
You're in the wrong city (bad market environment)
You’re rushing without checking road conditions (volatility, news, timing)
Even with QS, you don’t have to trade every day, every hour.
---
✅ What You Should Do
Be patient
Respect market conditions
Take a break on slow or tricky days
Come back when the odds are in your favor
---
🧘♂️ Final Words
You don’t have to win every day.
You don’t have to trade every day.
You don’t even have to be active to be successful.
🎯 Trade less. Trade smarter. Select your time wisely.
That’s how real traders survive and thrive in this game.
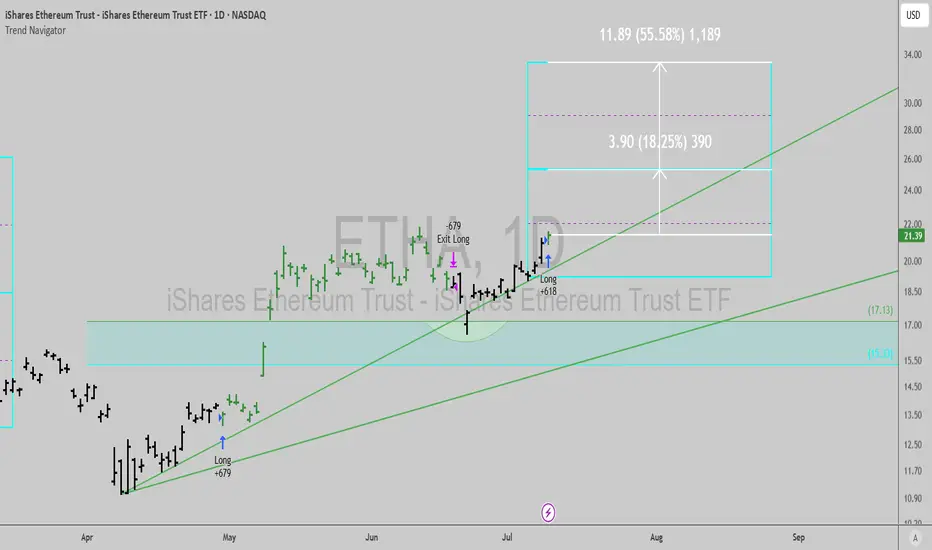
$ETHA: ETH ETF about to explode higher...For now, ETF buyers are down since inception, but that is about to change.
The Trend Navigator algo is flashing a buy signal today, as weekly flashes a Time@Mode signal.
(obligatory to mention that the Trend Navigator algo is up 30% ish in this chart in the same period)
A lot of people are either sidelined or looking to exit the market right as it's about to trend up steadily for months it seems. Don't be like them and hodl.
Best of luck!
Cheers,
Ivan Labrie.
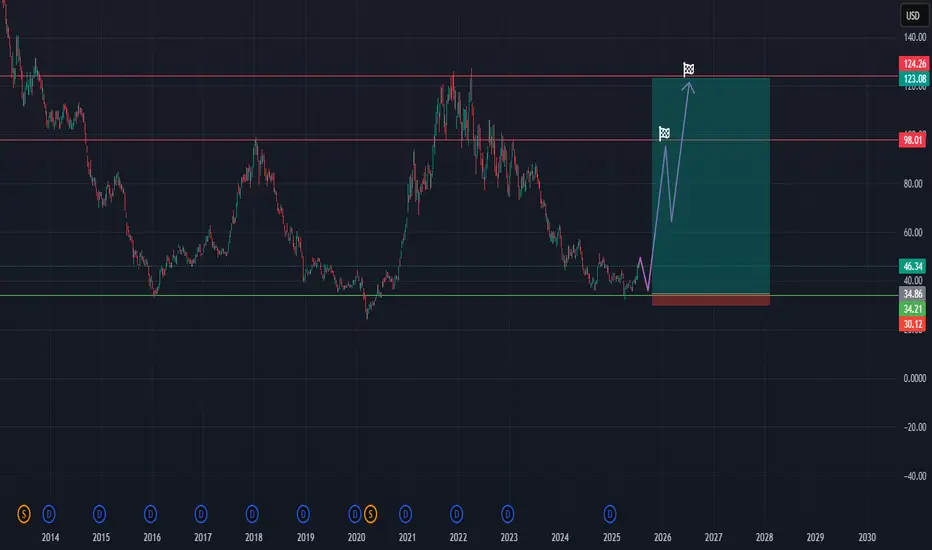
Long REMX (Rare Earth/Strategic Metals ETF)hi traders,
1. The chart shows REMX has experienced a significant downtrend since late 2021/early 2022, reaching levels last seen around 2020.
2. Entry Strategy (Green Box):
The idea is to enter long positions as the price approaches or bounces from this established support area, anticipating a reversal or a significant rebound.
3. Stop-Loss ($30):
A stop-loss is crucial to limit potential losses if the support level fails and the price continues to decline, invalidating the bullish thesis.
4. Price Targets (Purple Arrows and Red Lines):
Target 1 (First Purple Arrow & Red Line): The first target is around $98.01. This level acted as significant resistance/support in the past (around mid-2022 and early 2021).
Target 2 (Second Purple Arrow & Red Line): The second, more ambitious target is around $124.26 to $123.08. This represents a major resistance level from the 2021-2022 peaks.
These targets are based on previous price action, aiming to capture a substantial portion of a potential recovery. The two targets allow for a tiered profit-taking strategy.
* Summary of the Trading Idea:
This trading idea is a long-term bullish bet on REMX, based on the assumption that the ETF is currently near a significant historical support level and is due for a substantial rebound. The strategy involves accumulating positions in the identified entry zone, setting a stop-loss below the key support, and aiming for two distinct profit targets corresponding to prior resistance levels. The time horizon for this trade appears to be medium to long-term, potentially extending into 2026-2028,
Friday afternoon UpdateSPX looks like it's consolidating only. Gold has broken above resistance. OIL and Nat Gas looks like they want to go higher. BTC should go higher, but not too much more.

SOXL Will FLY!Just look at the AD line:
With its sharp V-shaped recovery, the A/D Line (middle area) shows that the recent price rise is being driven by significant capital inflows and strong buying interest.
The Accumulation/Distribution Oscillator (lower panel) underlines this with an exceptionally high green bar, indicating massive buying pressure in the recent trading period.
At the moment there are no obvious negative divergences between price and indicators. Rather, the indicators are signaling strong bullish momentum, which is supporting the current upswing. For an instrument as volatile as a leveraged ETF, this is a remarkable sign of the strength of the current move.
I don't want to sound euphoric, but THIS is a BIG BUY!

Opening (IRA): TLT Sept 19th 83 Short Put... for an .88 credit.
Comments: Camping out with a strike slightly below the 52-week low, where the options contract is paying a smidge more than 1% of the strike price in credit.
I don't really need more TLT, but wouldn't mind being assigned more at a lower price than the stock element of my covered calls.
