$SPY Today’s Trading Range and everything in it /// 7.11.25Beautiful start here right at the bottom of the expected move for the day.
Today’s Trading range and everything in it. How are you playing it?
ETF market

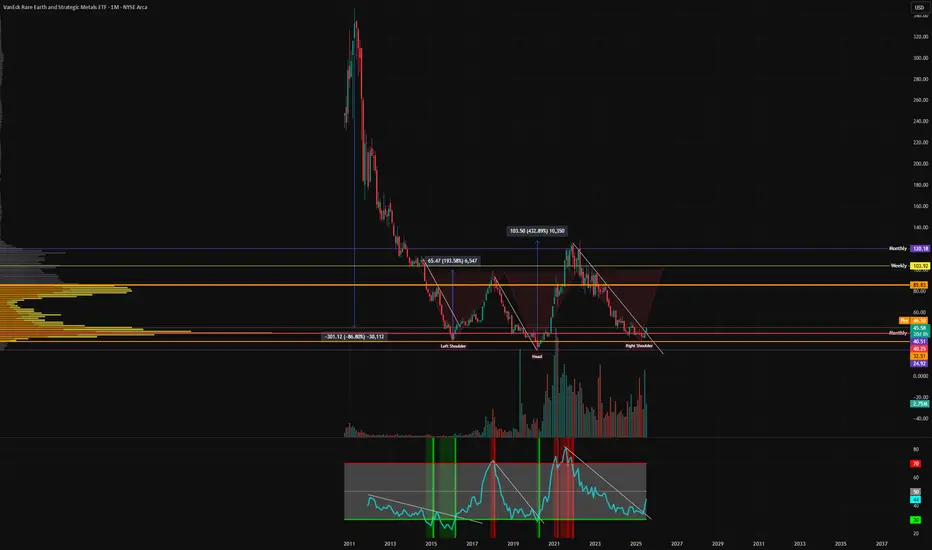
Rare Earth UpdateTo provide an update on why I went long Rare Earth. I noticed the after hours move up on MP materials, at 20% increase before market open which quickly became a 50% move when trading started. This particular ETF holds MP Material as a major holding and it hadn't moved much as it should have. I posted a trade idea on Lynas, which went up the following day. The TA on this chart suggests the move up may have plenty of room to the upside.
This is a highly cyclical ETF, as expected from any mining related asset. There's periods of huge drawdowns followed by sharp moves to the upside. We have broken out of the downtrend, we have held the POC as support and bullish volume suggests the move is not a fakeout.
Zooming out, I see a giant inverse head and shoulders pattern. You can also see the RSI downtrend has been broken.
Not financial advice, congratulations to anyone who took the trade on this with me. I have moved my stop loss to break even, if price breaks below I will get stopped out with no loss.
Not financial advice, do what's best for you.
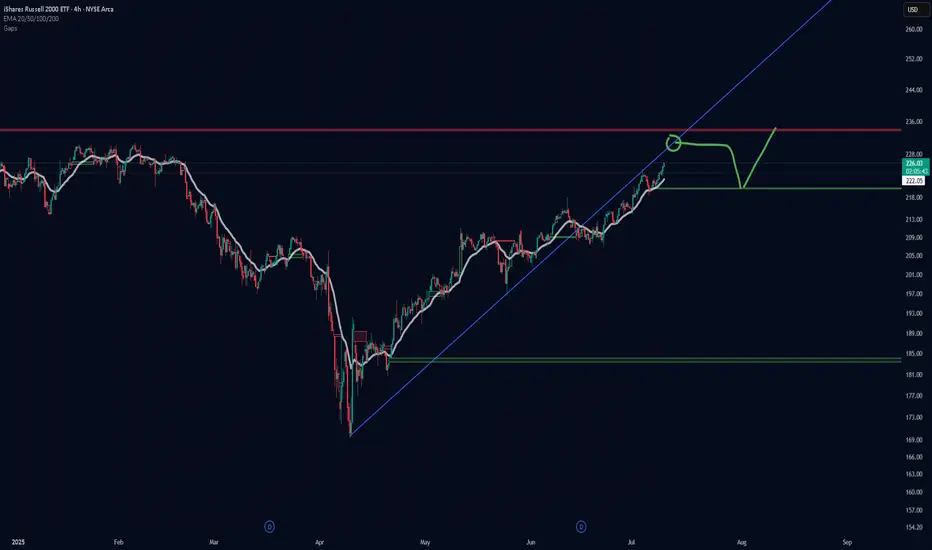
IWM projected pathI have three rooms full of supercomputers and then a few laptops in a spare bathroom plus a refrigerator in my wife's cardboard box running simulations 24/7 about the projected path of the Russell. Based on their findings I have determined that our previous support is now the resistance. When we come into contact with this resistance we will begin to work our way back down to fill the gap before continuing up to achieve a new all time high. When we hit resistance I have prophesized that will go mostly sideways for a numbers of days before we drop down to fill the gap. Thank you. Praise the Lord.
Nightly $SPY / $SPX Scenarios for July 11, 2025🔮 Nightly AMEX:SPY / SP:SPX Scenarios for July 11, 2025 🔮
🌍 Market-Moving News 🌍
🏦 Strong Bank Earnings Amid Tariff Churn
Next week’s Q2 forecasts point to robust earnings from U.S. banks—JPMorgan, Citi, Bank of America, Goldman Sachs, Morgan Stanley, and Wells Fargo—as trading and investment-banking revenue recover, offsetting uncertainties from ongoing tariffs
💬 Dimon Flags Fed Risk Pricing
JPMorgan’s Jamie Dimon cautioned that markets may be underestimating upside in interest rates. He sees a 40–50% probability of higher U.S. rates, driven by inflation from tariffs, migration, and fiscal deficits
⚖️ Tariff “Scattergun” Sparks Sector Disconnect
Trump’s plans to levy up to 200% tariffs on pharma and 50% on copper triggered uneven market reactions—copper prices rose 30% in six months, while European drugmakers remain flat, highlighting divergent sector sensitivities
📉 Tech & Macro Still Bullish
Despite policy turbulence, Nvidia climbed back above a $4 trillion valuation, and JPMorgan projects a $500 billion inflow into equities in H2—supporting gains even as broader macro pressures linger
📊 Key Data & Events
📅 Friday, July 11:
(No major U.S. economic data scheduled)
Markets will focus on bank earnings previews, tariff headlines, and the hold of the tech rally into a thin summer trading week.
⚠️ Disclaimer:
This information is for educational and informational purposes only and should not be construed as financial advice. Always consult a licensed financial advisor before making investment decisions.
📌 #trading #stockmarket #economy #tariffs #banks #tech #Fed #investing

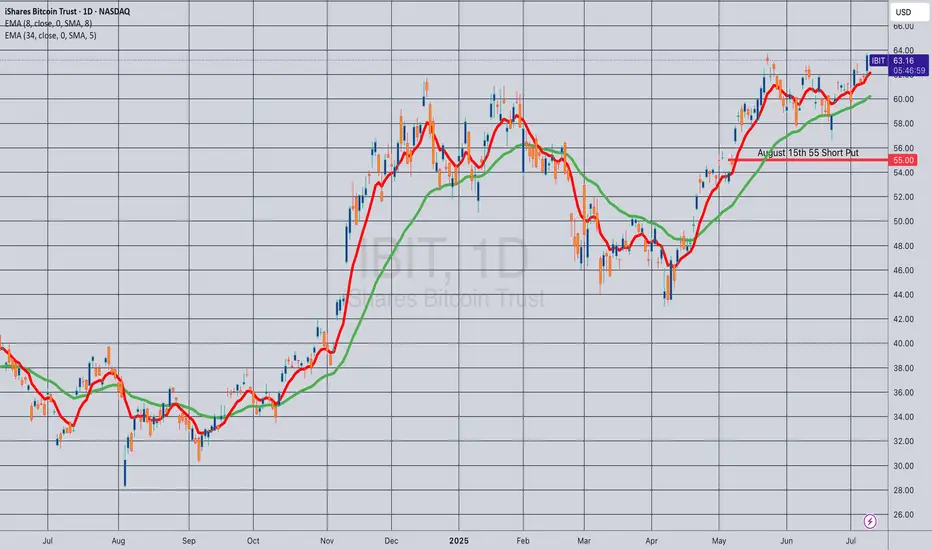
Opening (IRA): IBIT August 15th 55 Short Put... for a .62 credit.
Comments: One of the higher IV ETF's on my board. Targeting the strike paying around 1% of the strike price in credit.
Opening (IRA): IBIT July 18th 51 Short Put... for a .59 credit.
Comments: One of the higher IV ETF's on my board at the moment. A starter position, targeting the strike paying around 1% of the strike price in credit.
Will look to ladder out at intervals ... .

SPY Bullish Patterns C&H Pattern W/ Right Angle Wedge. Wait for confirmation and retest to have a high probability of success.
$DIA Tomorrow’s Trading Range and everything in it /// 7.10.25
Today’s Trading range and everything in it. How are you playing it?
Amazing here how we've stayed right in the iplied move. Green signal line today

$IWM Tomorrow’s Trading Range and everything in it /// 7.10.25
Today’s Trading range and everything in it. How are you playing it?
Really the only thing in the trading range is a bear gap and 35EMA. Easy Trading Range

$QQQ Tomorrow’s Trading Range and everything in it /// 7.10.25
Today’s Trading range and everything in it. How are you playing it?

$SPY Tomorrow’s Trading Range and everything in it /// 7.8.25Today’s Trading range and everything in it. How are you playing it?

$QQQ Tomorrow’s Trading Range and everything in it /// 7.8.25Tomorrow’s Trading range and everything in it. How are you playing it?


Rare Earth super cycle ?If we clear $43 and hold this level, this thing could fly. I’m not going to go too much into this but don’t be surprised if we get an aggressive move up. Not financial advice

XBI eyes on $79.28: Golden Covid fib may mark the BioTech bottomXBI has been getting dumped since Trump and RFK
If biotech is to recover, it might start here and now.
Bulls need to hold or at least orbit this a few times.

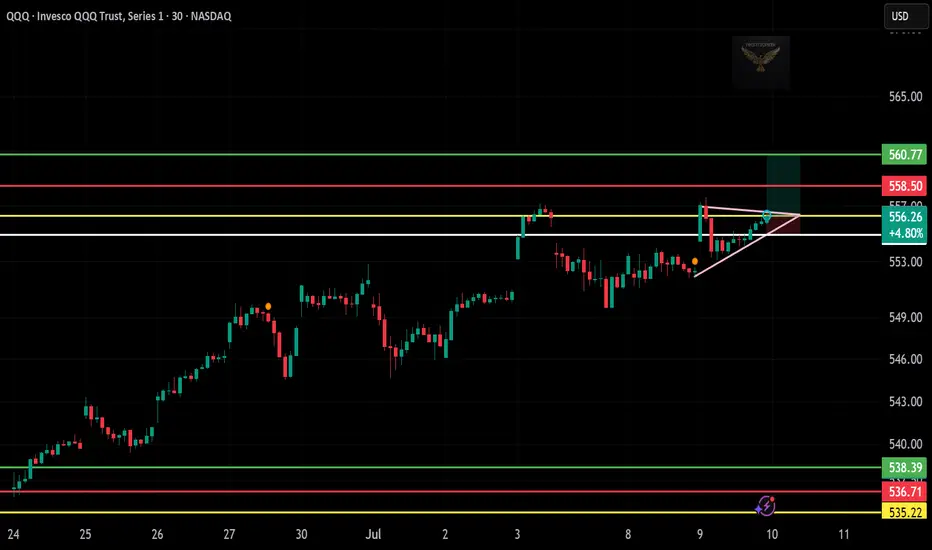
$QQQ Long Trade Setup – July 10📈
Price formed a tight triangle right at resistance—and today we got the breakout. Looks ready for continuation if volume steps in.
📌 Entry: $556.26
🎯 Target: $560.77
🛑 Stop Loss: Below $554.00
⏱️ Timeframe: 30-min chart
🔍 Why I Like This Trade:
Strong bullish flag breakout after retest
Holding above structure with higher lows
Clean path toward the upper resistance zone
🧠 This setup aligns with the overall tech strength—riding the momentum with tight risk!
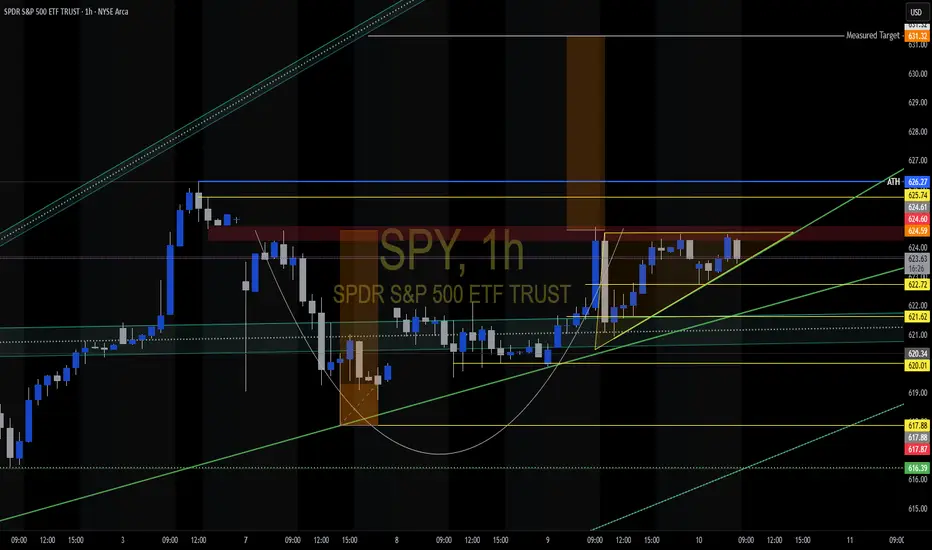
SPY Approaches Gamma Wall-TA for July 10SPY Approaches Gamma Wall: Key Zones to Watch for Tomorrow’s Trade 🔥
GEX Options Sentiment Analysis:
SPY is currently hovering just below the major GEX resistance zone around 624–626, where the highest positive GEX and gamma wall overlap with strong call walls (52.17% and 41.33%). This region has historically capped upside momentum, so traders should prepare for potential rejection or breakout scenarios.
Downside has modest protection around 620 (HVL level), with negative GEX zones building near 619–617, marking a weak PUT wall. The lack of deep PUT dominance signals limited downside hedging pressure.
* IVR: 8.9 (low), IVx avg: 13.8
* Options Flow Sentiment: 24.1% PUTs
* GEX Bias: Mildly bullish unless 623 fails
Options Strategy Suggestions:
* If price breaks and holds above 626.5, consider buying CALL spreads (e.g., 626c/630c) targeting a gamma squeeze into 628+.
* If 623 breaks, look for short-dated PUT spreads (e.g., 623p/620p) targeting a fade back into 620 or even 617.
1-Hour Chart Price Action Analysis:
SPY has reclaimed a bullish posture after the CHoCH (Change of Character) on July 8 and is pushing into a supply zone just beneath the prior swing high. The price structure now forms a clean ascending channel, supported by higher lows and rising demand.
* Support Zones: 622.00, 620.34
* Resistance Levels: 624.72, 626.27
* BOS (Break of Structure): Confirmed earlier, adding bullish confluence
Watch for a breakout above the current supply zone to continue momentum toward 628+. However, failure to break and a rejection near 625 could lead to a retest of 620–622 as the next demand zone.
Trading Outlook for Thursday:
* Bullish Case: Break and close above 626 opens the door to a squeeze into 628+. Use pullbacks to 623–624.2 as entry zones.
* Bearish Case: Rejection at current levels with a breakdown below 622.5 could pull SPY into the 620.3 and possibly 617.9 levels.
* Scalp Setup: Long above 625 with tight stop below 623. Short below 622.5 targeting 620, risk above 624.
This analysis is for educational purposes only and does not constitute financial advice. Always manage risk and follow your own plan.

Nightly $SPY / $SPX Scenarios for July 10, 2025🔮 Nightly AMEX:SPY / SP:SPX Scenarios for July 10, 2025 🔮
🌍 Market-Moving News 🌍
🏦 Global Banks Profit from Tariff Volatility
Major banks like JPMorgan, BofA, and Citigroup are expected to see ~10% growth in trading revenue in Q2, fueled by volatility from President Trump’s tariff policy shifts. Treasury trading volumes hit record highs as markets priced in policy swings
📈 S&P 500 Nears Lull Amid Bull Market Strains
Despite record highs in 2025, investors are warning that the rally may be reaching its limit. Bullish sentiment is strong, but analysts caution that sluggish consumer spending, rising inflation from tariffs, and few rate-cut signals from the Fed could cap downside momentum
🐻 Bear Case Gains Ground
Stifel’s Barry Bannister projected a potential ~12% correction in the second half of 2025. Key risks include slowing consumer spending, weak capital investment under tariff uncertainty, and persistent core inflation above 3%, negatively impacting earnings and growth outlooks
⚖️ “One Big Beautiful Bill” Could Add Trillions in Debt
The new fiscal package signed July 4 will add $3–4 trillion to national debt over the next decade while extending tax cuts and revising EV incentives. Bond market and Fed policy implications may become more pronounced if growth fails to keep pace
📊 Stocks vs Bonds: Diverging Signals
While equities climb and megacaps extend gains, Treasury yields have risen five days straight—signaling growing caution over real growth prospects. The yield curve steepening hints at mixed signals: growth optimism in stocks, but bond market signaling economic risk ahead
📊 Key Data & Events
📅 Thursday, July 10:
No major scheduled economic releases. Markets remain driven by tariff headlines, bank earnings reactions, and evolving Fed signals.
⚠️ Disclaimer:
This is for informational and educational purposes only—not financial advice. Consult a licensed advisor before making investment decisions.
📌 #trading #marketvolatility #tariffs #banks #Fed #debt #technicalanalysis

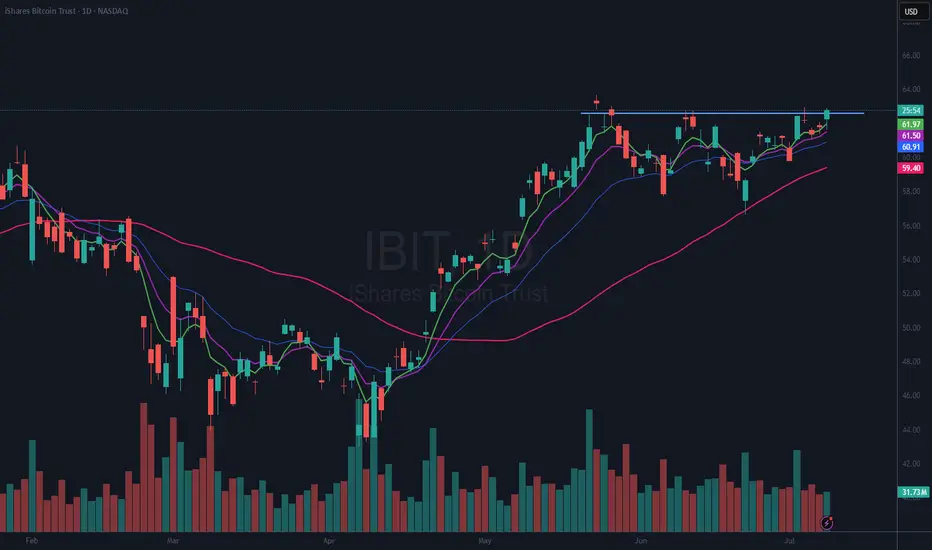
$IBIT a BITCOIN ETF Is Breaking Out of a Flat BaseNASDAQ:IBIT I have been looking at this for quite awhile now. I drew in an “area” of resistance, and it has hit that twice in the last few days. I bought a position on Jul 3rd and was stopped out. It just broke again so I have opened yet another position and will use a stop on a close below the 21 EMA (blue).
If you like this idea, please make it your own and trade it only using your own trading plan. Remember, it is YOUR money at risk.
TOM LEE leading the charge in this new BULL MarketThank you for providing excellent analysis,
being on the right side of the trade
and helping retail with your public speaking on your own channel, podcasts, and of course CNBC.
I wish you continued success in you Granny shots ETF which is already over $1.5 Billion in AUM!

Multi Market Update 7-9-2025SPY likely put in a C wave this morning, I expect a further move down for the rest of the week. Gold starting to look bullish again. Natural Gas likely keeps dropping towards 2.5. BTC at the top of it's range. USOIL is at resistance. The stock I'm trading - aapl - is showing a bear flag on small time frames

Sprott Copper Arbitrage against LME copper futures, discount 20%Currently COP.UN (traded on TSX, Toronto Stock Exchange) is showing some substantial discount again against NAV. Discount is more than 20% which basically means that you can buy copper on the world markets (LME) with a 20% discount! I expect discount will narrow again in coming weeks and wil go back to minus 10 or even better.
A more detailed description can be find below of all facts and figures.
Current Situation:
Discount to NAV: COP.UN is trading at just over a 20% discount to its net asset value (NAV). Essentially, this means you can buy copper exposure at a significant discount to the current market price.
Copper Storage and Transfers: The trust’s copper is stored in LME-approved warehouses and is increasingly being shipped to COMEX warehouses in the U.S. The reason is straightforward: copper prices on COMEX are currently higher than on the LME. By moving copper to COMEX, Sprott can sell inventory at better prices.
Mechanism for Payouts: The proceeds from selling copper at a premium on COMEX versus the LME can be distributed to unitholders as a special cash distribution (dividend). This provides a direct way for investors to benefit from arbitrage between exchanges.
Redemption Option: Institutional investors can redeem trust units for physical copper, subject to minimum tonnages and fees. This helps keep the trust price connected to physical copper markets and offers an arbitrage route if the discount remains wide.
The Opportunity:
This setup offers trading houses huge opportunities:
Arbitrage Play: Buy COP.UN units at a >20% discount, redeem them for physical copper, and sell the metal at spot prices, pocketing the spread (net of costs).
Dividend Upside: Hold COP.UN units and potentially benefit from future special dividends if Sprott continues moving copper to COMEX and realizing higher sales prices.
Useful Resources:
COP.UN Prospectus (Sprott Physical Copper Trust) cop-prospectus-en.pdf

URA Long CallURA and CCJ are sitting at Volume Support and Darvas support levels.
Prices have also set up a minor low signal.
The trend has started to move to sideways, would would be confirmed today. Therefore, we need to be more aggressive in our stop loss and profit target. I like a move back up to the $38 level.
Entry $36.62
Stop Loss: 20% - Due to trend change.
Profit Target - $37.95
