IBIT - Trying to Confirm Upside BreakIf you are wanting BTC to breakout this is a very important chart. There is a chance IBIT is frontrunning the BTC breakout.
For the past 45 days IBIT has been forming some sort of parallel channel breakout with the top trendline being our orange trendline. We have had many touchpoints of resistance on this trendline (red arrows). Recently price broke out to the upside and re tested our orange trendline as new support (green arrow). This is a really good early signal of continuation to our 1.618 extension level. In addition to the trendline retest we have also seen the ltf 0.618 Fibonacci level holding as support.
However BTC is the main factor of if this will be a successful breakout or not. Right now BTC is still struggling with our red trendline of resistance. If BTC fails and starts to fade then IBIT will fall to and this will become a failed breakout. Will update this post when more confirmations develop.
ETF market

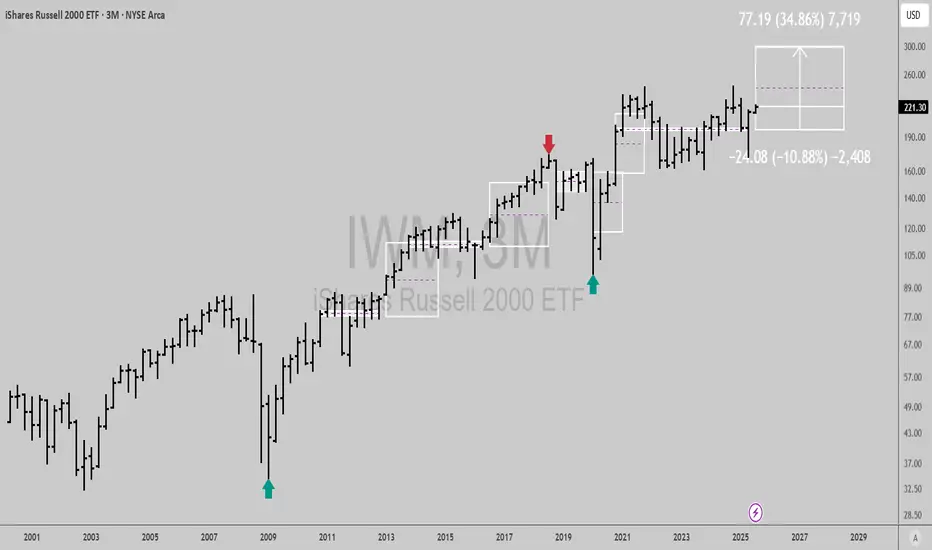
$IWM: Quarterly signal and Fundamental CatalystsQuarterly chart signals from time@mode show AMEX:IWM is bullish, with just 10% downside risk and over 34% upside potential into Q3 2028 or sooner.
Let's break down the key catalysts for the year ahead:
Fed rate cuts are expected to boost small cap stocks by lowering borrowing costs.
Small business sentiment is at multi year highs, supporting Russell 2000 earnings growth.
Valuations remain attractive: AMEX:IWM trades at a discount to large caps, with room for mean reversion.
Sector rotation: Money is flowing into industrials, financials, and cyclicals, core IWM sectors.
Risk reward is compelling: Upside vs risk and strong macro and earnings tailwinds make this a high conviction long idea for the next 12 months and beyond.
Best of luck!
Cheers,
Ivan Labrie.
How Will Uncle Sam Strike Back? – U.S. Treasuries on the Edge📉 How Will Uncle Sam Strike Back? – U.S. Treasuries on the Edge
After covering leveraged loans ( BKLN ), junk bonds ( HYG ), and investment-grade corporates ( LQD ), we now focus on the most important piece of the U.S. credit puzzle: Treasuries.
Specifically, the long end of the curve — tracked by TLT .
📊 What the Chart Shows
Left Panel (3D Chart)
• All-time highs in Feb 2020 at $179.80
• Long-term trendline going back to 2004
• Critical support was broken in 2022 — a structural breakdown
Right Panel (8H Chart)
• Clear descending channel since 2020
• Price has rejected from the channel top multiple times
• Recent bounces off the lower channel suggest a potential final flush
🧠 What Happened in 2022? (can't blame Trump for that...)
This wasn’t politics — it was policy.
• The Fed's fastest hiking cycle in decades
• Liquidity evaporated
• Long-duration bonds were abandoned
• The key trendline that had held for years was finally lost
That line — once support — is now resistance.
📐 My Technical Expectation
I expect one final slide before a reversal.
• Channel base sits at ~$76.32
• My projection targets $71.30 or even $68
• That would mark new all-time lows for TLT
🟡 After that? I expect a macro reversal , targeting:
• 🔼 $101 – mid-channel reversion
• 🔼 $112–115 – former support zone (2019–2022), now resistance
🔍 Macro Context
This chart isn’t just about price.
It reflects how markets are pricing confidence in U.S. debt .
And right now?
That confidence is shaky . With Trump turning 'orange' and taking it out against almost everyone else: China but also his allies(EU, Canada, Japan, etc )
🔄 Recap of the Series So Far:
• BKLN – record leveraged loan outflows
• HYG – junk bonds bounced at historical support
• LQD – investment grade bonds holding steady
• TLT – U.S. Treasuries under pressure, and possibly breaking down
📌 Next up?
🟧 CRYPTOCAP:BTC
Because when the world begins to question Treasuries , the search for alternative stores of value begins.
One Love,
The FXPROFESSOR 💙
ps. wait for the next posts...they might be epic!

[b]No Panic Here – Quality Credit Says Relax[/b]No Panic Here – Quality Credit Says Relax
After watching leveraged loans ( AMEX:BKLN ) and junk bonds ( AMEX:HYG ) take heavy hits, we shift to the quiet giant in the credit space: AMEX:LQD .
What is AMEX:LQD ?
It’s the ETF for investment-grade corporate bonds — meaning bonds issued by highly rated, stable companies.
We’re talking about names like Apple, Johnson & Johnson, Microsoft, JPMorgan, ExxonMobil — the blue-chip elite.
These aren’t the bonds you dump in a panic — they’re the ones you rotate into when credit stress builds.
What’s happening now?
📌 Price just bounced off 103.81 , a key support zone that also held:
• During the 2020 Covid crash
• In the 2022 banking mini-crisis
• Now in 2025 – mid macro uncertainty
From 2003 to 2021, this chart trended upward with pressure on resistance. Since 2022, the pressure flipped — testing support. But structure is still being respected perfectly .
🟢 The ascending channel remains intact
🧱 Support at 103.81 is holding
🔄 No breakdown, no fear — just rotation
Zoomed-in 30m chart shows a clean technical bounce .
If we revisit 100.33, that could be a final test of the base — but unless that breaks, this still looks bullish on a macro timeline.
What it means:
This is not a market panic .
It’s a rotation into quality.
• Junk bonds = sold but found support
• Leveraged loans = stress but not panic, on support
• Investment grade = stable
• ** CRYPTOCAP:BTC 🟧 = crypto wildcard in this macro unwind**
Bottom Line:
LQD is holding up, following the rules, and quietly saying:
"Relax, we've been here before."
One Love,
The FXPROFESSOR 💙

Junk Bonds: Risk Appetite Bounces on Support!Junk Bonds: Risk Appetite on Support!
Credit markets have been buzzing — headlines warn of record outflows and panic rotation. But AMEX:HYG , the high-yield bond ETF, just told a different story.
What is AMEX:HYG ?
It tracks “junk bonds” — loans to companies with weaker credit. They offer high yields, but carry high risk. When investors are confident, they chase these. When fear hits, they dump them — fast.
The Chart Setup:
We've just seen a clean rebound off 75.72 — a long-standing “fear line” going back to:
• 2008 GFC lows
• Covid crash in 2020
• And now, 2025 macro tension
Zooming into the 1H chart (see inset), the rebound off 75.72 was sharp and orderly — not panic-driven.
Why it matters:
📉 Last week: $9.6B exited junk bond funds (20-year record)
💣 AMEX:BKLN saw its biggest outflow ever
But technically? This support is still holding .
The message:
The market might be pricing fear — but not full-blown stress .
Break below 75.72? That changes everything.
Watchlist:
• AMEX:BKLN – leveraged loans
• AMEX:LQD – safer credit rotation?
• NASDAQ:TLT – treasury flow = fear gauge
• CRYPTOCAP:BTC 🟧 – Bitcoin as macro hedge again?
For now, risk appetite is hanging on by a technical thread. Let’s see if it holds.
One Love,
The FXPROFESSOR 💙
ps. things can change fast so we will monitor..alerts are ON

Credit Stress Panic? No, at least not yet!Credit Stress Panic? No, at least not yet!
A friend shared a viral X post claiming we just saw the biggest exodus in the leveraged loan space — and they’re right on the numbers:
• $6.5 billion pulled from US leveraged-loan funds in just a week
• $1.4 billion from AMEX:BKLN alone — the largest outflow in its 13-year history
• $9.6 billion also left high-yield bond funds — the most in nearly two decades
But here’s the thing... dollar flows can be misleading without context.
What is AMEX:BKLN ?
AMEX:BKLN is the Invesco Senior Loan ETF. It tracks floating-rate loans made to riskier corporations — offering higher yields tied to interest rates. These are popular in rising-rate environments… until credit stress kicks in.
So what’s the chart saying?
Despite the outflows, price just bounced off a key historical support level: $20.31 .
This zone has been tested before:
• 2018: Fed tightening – sharp but contained
• 2020: Covid crash – full panic
• 2022: Banking mini-crisis – 💥 and Bitcoin pumped from here 💰🟧…
Now in 2025, we’re seeing the biggest dollar outflow… but not the worst price action.
Perspective check:
The fund is much larger now. $1.4B today ≠ $1.4B in 2018. This move isn’t the apocalypse — not yet.
Final Takeaway:
If $20.31 holds, this may be just another macro shakeout.
Break that, and we enter “panic mode” — but we’re not there yet. (Thank God that Tradingview alerts exist. It's ON)
Watchlist:
• AMEX:BKLN – key support zone
• AMEX:HYG / AMEX:JNK – junk bonds under pressure
• NASDAQ:TLT – treasuries getting love
• CRYPTOCAP:BTC – does it act as safe haven again?
One Love,
The FXPROFESSOR 💙

SPY should continue downSPY bounces will likely be sold but it needs to break 618 for any real down move. Gold, stuck between support and resistance. USOIL at resistance. NG, difficult to say what is happening. BTC may pop the highs but it would likely be a false break.

IWM 4hr chart cannot tell a FIBIWM bouncing out of the FIB golden pocket.... With the daily and this I like the odds of upside continuation..
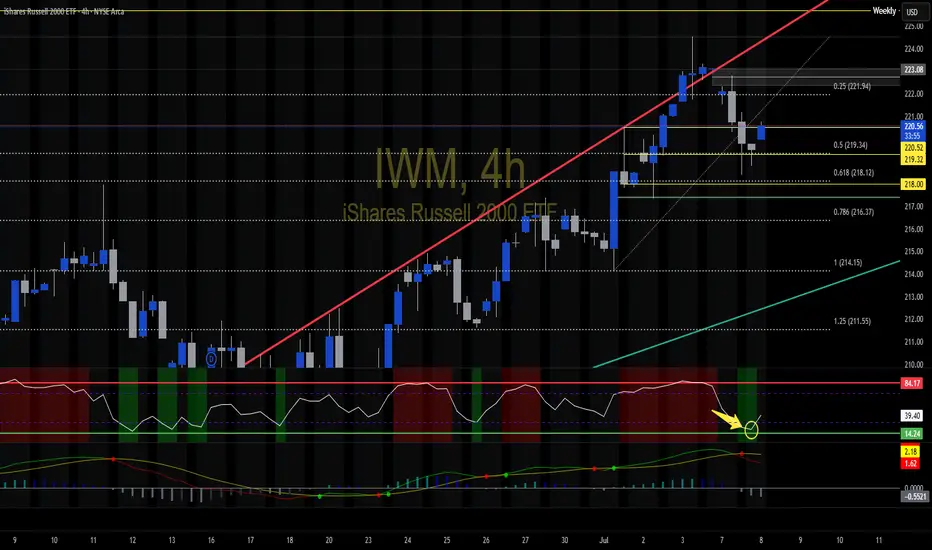
Chart Pattern Analysis Of MSTU.
From K1 to K6,
It is a small scale consolidation or a bullish triangle pattern.
The supply pressure is decreasing too.
It seems that K7 or K8 will break up or fall down.
If the following candles close upon the neckline,
It is likely that another bull run will start here to test 14USD area.
On the other hand,
If the following candles close below the uptrend line,
The risk will sharply increase.
Long-8.18/Stop-7.8/Target-14
Long-8.5/Stop-7.8/Target-14

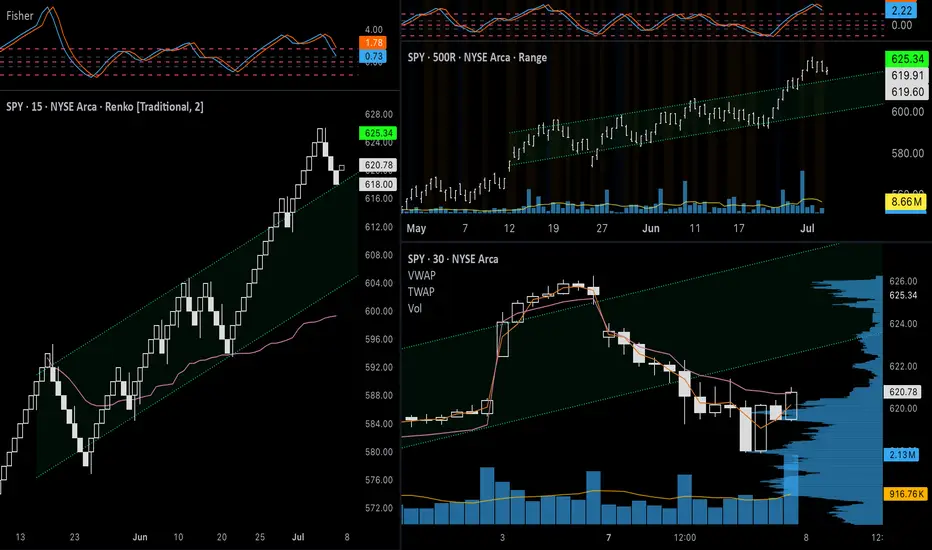
SPY July 8th 2025SPY July 8th 2025
Day 2 of journaling my trades. Ended Monday green but not without mistakes. I am heading into Tuesday with more of a neutral outlook. Previous resistance will be tested as support and could find buyers or fail to do so. As I did yesterday, I will give a breakdown of what I’m seeing on all of my charts for both strategies.
+++++++++++++++++++++++++++
Bullish Analysis
Renko: The price pulled back on Monday, as expected, and may continue lower to retest the top of the channel (around $615). Fisher Transform is still in positive territory and strong support at that level could lead to the price reaching higher highs.
500R ($5) chart: Similar structure to the Renko chart. I’m using a higher range here to compensate for volatility. Just like with the Renko chart, a bounce on the top of the channel would be a healthy pullback before higher highs. There is a high volume node on the volume profile, so interest from buyers here could be strong enough to prevent the price from falling back into the channel.
4h chart: The last three candles have the appearance of a healthy pullback. There was declining volume and
the most recent candle is somewhat of a bullish hammer. I also have an anchored VWAP going back to June 30 that the price seems to be respecting. The price bounced off of it in the first 4h candle on Monday and managed to close above it after a dip during the formation of the second candle.
+++++++++++++++++++++++++++
Bearish Analysis
Renko: Same chart with a lower box size ($1 instead of $2). As you can see, there is bearish divergence on Fisher Transform. The price also found likely temporary support before reaching the top of the channel, suggesting that it could make at least one more wave down if a larger corrective trend unfolds. The 1.382 ($614) and 1.618 ($612) Fibonacci extensions will be important reference points to watch. I would feel less confident about the strength of the bullish trend if the price goes beyond the 1.618 extension.
200R ($2) Range: The Range chart in this layout is the only one that I am including extended hours data on, so the channels have slightly different levels. On this chart I am using two trend lines on the upper level to illustrate the possible areas of support/previous resistance. If the price breaks back into the channel and below the 34VWMA, it could signal a trend failure and the price could return to $600 or lower. Volume bars on range charts also offer a different perspective than on time-based candlesticks. Here, since each bar represents a $2 move up or down, the volume inside of each bar can show the level of effort it took to move the price either direction, whereas the time-based charts are simply showing the level of interest during a particular time period. For this reason, consistently high volume during this last move up could be a sign that there is a larger presence of sellers. Lastly, there is Fisher Transform divergence here as well.
1h chart: CME_MINI:ES1! is green overnight, signaling continuation of the bounce we saw at the end of the day on Monday. With a tighter channel, the top was rejected in a classic bearish reversal candle pattern above the channel and made a clean break down below the channel. The price found support just above the anchored VWAP from the start of the channel, so there could still be institutional interest around $617 and below. If this correction were to unfold into three distinct waves, a 0.618 pullback (to the 0.382 level of the fib extension; $623) would retest the previous demand of the channel. A rejection here could have the price looking for support in a lower volume zone. A (c) wave could take the price down to $615-$611.
+++++++++++++++++++++++++++
Options Analysis
As I have explained, I think it is possible that we will see the price hit $623 during the Tuesday session, so it could be an important level for ATM options. TVC:VIX held its level on Monday after the gap up but failed to make progress - finding resistance at the 200MA on the 1h chart. The rounding bottom and bullish candles on the 30m AMEX:SPY chart looks better than other timeframes. From a Wyckoff Method perspective, however, it looks like puts are in a distribution pattern and calls are in accumulation. Volume is low for both of these contracts, but especially lower on the Put option, indicating lack of interest.
If the put contract makes a lower low on Tuesday (below $3.55 or above $620.75 for SPY), this particular contract could break into a downtrend. Calls seem to be the safer bet since the price has already made a higher high and has wider support. An ideal entry would be a false breakout at $0.95 ($621.00 for SPY) or a retest of the top of the channel after a true upside breakout at $1.50 ($622.50 for SPY) The upside breakout possibility would have stronger confirmation, so it would be worth the higher premium price. This movement would need to be accompanied by high volume, of course.
For puts, I would like to see higher volume at the bottom of the range, since it seems like the underlying price will open higher. I would probably switch to a contract with a lower strike since $623 would be ITM but for the sake of this idea, I would target entry of $623p around $3.65 ($620.75 for SPY).
+++++++++++++++++++++++++++
Targets
Calls: Enter $622.50, Target $628-$630, Stop Loss $621
Puts: Enter: $620.75, Target $615, Stop Loss $621.50
To summarize, I like the risk/reward and volume better for calls, and it fits my original thesis, however if volume increases on puts at these elevated levels, it will be important to get in at a price that minimizes risk exposure to take advantage of a deeper correction.
SPY July 7th 2025SPY July 7th 2025
Day 1 of journaling my day trades on SPY. I am going to start journaling my ideas every night if possible in order to fine tune my setup and to analyze my wins and losses. I will be using Renko (Traditional, 2 box size, 1m) as my main chart, Range Bars (50R, 100R, 200R, or 500R), and candle sticks (various timeframes) to identify supply/demand, price ranges, and trends - placing a high emphasis on volume as it applies to the Wyckoff Method. I will also occasionally refer to real time options charts and VIX, however I will primarily use those for my entries during the day.
Each day I will provide setups for a bullish and bearish bias, which should help minimize instances where the price moves against me - with slow reactions leading to holding losing trades and hesitating to enter a trade on the side of the new trend. I’ll try to come up with a consistent format as time goes on. For today, I will go down the list of my indicators and provide notes that fit the bias of each trading strategy.
+++++++++++++++++++++++++++
Bullish Analysis
Renko: Strong breakout from ascending channel on June 30. Fisher Transform is signaling continuation. A retest of the top of the channel would take the price back to ~$618.
100R ($1) Chart: Price is in an uptrend being supported by high volume. 34VWMA (purple) is above 200MA (green). The bounce on July 2nd (around $616) was supported by a high volume node, indicating genuine interest pushing the price higher.
30m Chart: Price closed on July 3rd at the top of an ascending channel inside of a larger ascending channel. Since the larger ascending channel is one of strength, it can be assumed that the smaller one is a sign of strength as well. A break too far below the lower end of this smaller channel would be a sign of weakness, which does not seem to fit the current market structure after last week’s breakouts, but it is still possible that the trend fails. Fisher transform is forming a “hook” pattern that can signal continuation.
+++++++++++++++++++++++++++
Bearish Analysis
On a smaller scale, the price appears due for a pullback, which can fit both the bullish and bearish trading ideas depending on where the market opens.
Renko: The price closed at the top of an ascending channel on July 2nd and will find more buyers upon a test of the lower band and the anchored VWAP.
50R (50¢) Chart: If the price pulls back to the bottom of the channel (around $620) this would coincide with a retracement of 0.618 - which is a key fib level. A break below the 1.00 extension ($616) could signal a break of the uptrend - a $9+ drop if an entry can be found near the top of the channel, not too bad.
5m Chart: The price left a gap down to $620 on July 3rd. Filling this gap could provide important liquidity to propel the price higher. Additionally, The high volume at the start and end of Thursday’s flat trading day (with low volume in between) could be a sign of accumulation or lack of sellers.
1DTE ATM Put, 2m: If a more prolonged (and profitable) downward move is expected from smart money, we should see volume increase for ATM puts during the session. Depending on where things open, we could see a potential spring/false bearish breakout (below $2.20), or a true bullish breakout (above $2.80). Using an options calculator, $623.75 on AMEX:SPY would set up the Spring and a drop below $622.50 could confirm the put breakout.
+++++++++++++++++++++++++++
Targets
Calls: Enter $618-$620, Target $625-$628, Stop Loss $617.75
Puts: Enter $623-$625, Target $620, Stop Loss $626.25
To conclude, overnight action on CME_MINI:ES1! and the gap up on TVC:VIX shows that the price is already retracing. The top of the wedge for VIX would be just above $20 - a key level to watch for a reversal. Unless the upper part of the channel on SPY is tested and rejected again after the open, I will sit out and wait to hit the bullish targets. We are still in a strong uptrend after last week’s breakouts, so going short is the riskier bet anyway, as buyers could step in at any time.
Looking at ATM calls and puts side by side (bottom two charts), it is clear that calls were not heading into today with a good setup. It would be worth taking a chance on puts if a Spring forms (below $2.20), which, again, would correlate with AMEX:SPY hitting $623.75 during the session - and not much higher.
My main idea for the start of this week is to look for a good pullback for calls, so I will be patient and will try not to force anything. If smart money has a bullish sentiment, there will still need to be a short accumulation phase for calls so I will watch to see what the chart is doing for ATM calls around $620.

$SPY $SPX to 5650 Realistic pull back target AMEX:SPY SP:SPX Realistic pull back target. It’s been a while since I gave a good 5 year volatility based pullback target. 😏
Let’s take a look back in August. 5655 for SPX, 563 SPY

$QQQ – Fibonacci Roadmap to 700+ | VolanX Macro ProjectionPosted by WaverVanir International LLC | July 7, 2025
We're now entering a potentially historic expansion phase in the $QQQ. Our macro model, embedded in the VolanX DSS framework, projects a highly probable move toward the 1.786–2.0 Fibonacci extension zone, targeting $696.80 to $739.27, with 711.45 as a primary convergence level.
🔍 Key Technical Breakdown:
📐 Measured Move Base: November 2023 to March 2025 low
🟡 Fib Anchors: 404.65 low ➜ 540.81 high
🧬 Primary Support Zone: 0.5–0.618 retracement (449–465) held structurally during Q1 volatility
🚀 Resistance Breakout: Sustained break above 540.81 initiated the next Fibonacci leg
📈 Next Major Extension Target:
1.618: 663.46
1.786: 696.80
2.0: 739.27
🎯 Projected Path: Consolidation near current highs, followed by a liquidity-driven breakout into 700+ by mid-2026
🧠 Macro Context via VolanX Alpha Layer:
Liquidity Regimes: Improving risk-on flows with tech sector leadership resurging
AI & Infrastructure Megatrend: QQQ components benefit directly from AI adoption, infrastructure stimulus, and cloud capex
Volatility Compression: VIX continues to trend lower, fueling breakout setups on high beta indices
📊 Strategy Insight – VolanX DSS Signal:
✅ Long bias remains intact while price holds above 528 (last microstructure support)
🔄 Optimal entry zones: Dips toward 540–545 = reload opportunities
⏱️ Swing horizon: 4–6 months
🛡️ Risk Management: Invalidate long thesis on weekly close < 504
📌 Note: This projection is derived from our institutional Decision Support System (DSS), blending Fibonacci confluence, macro catalysts, and structural flows.
🔔 Follow @WaverVanir for more high-conviction macro setups powered by VolanX Protocol.

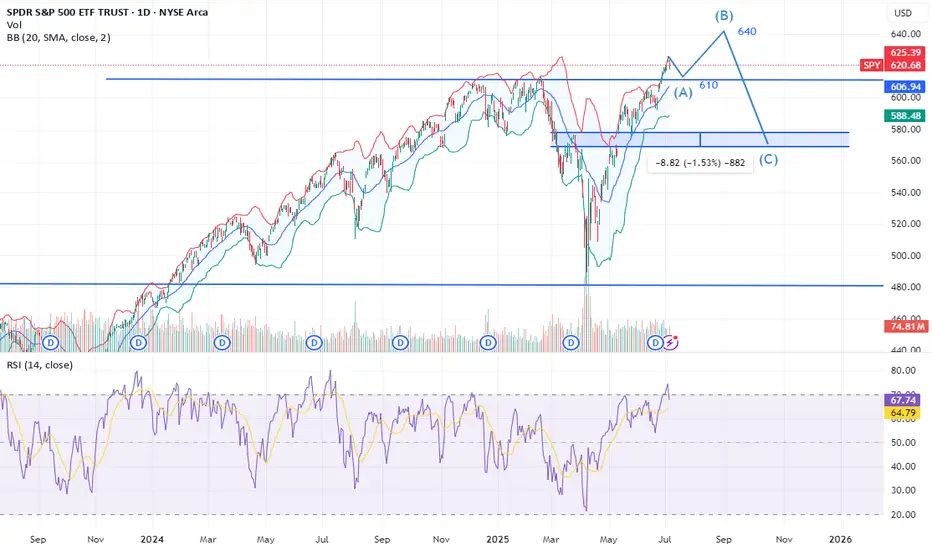
SPY: How are ya?Long time no talk.
Just an update to appease some people requesting updates haha.
Mostly going over the larger term outlook for SPY, the quarterly and some discussions on the weekly.
As always, not advice and remember to follow your strategies and risk management approaches!
Safe trades everyone!

clear path to 640 then 570 spyTariffs news are temporary but pump of any good news can lead us to 640 but remember we have to fill the gap 570.
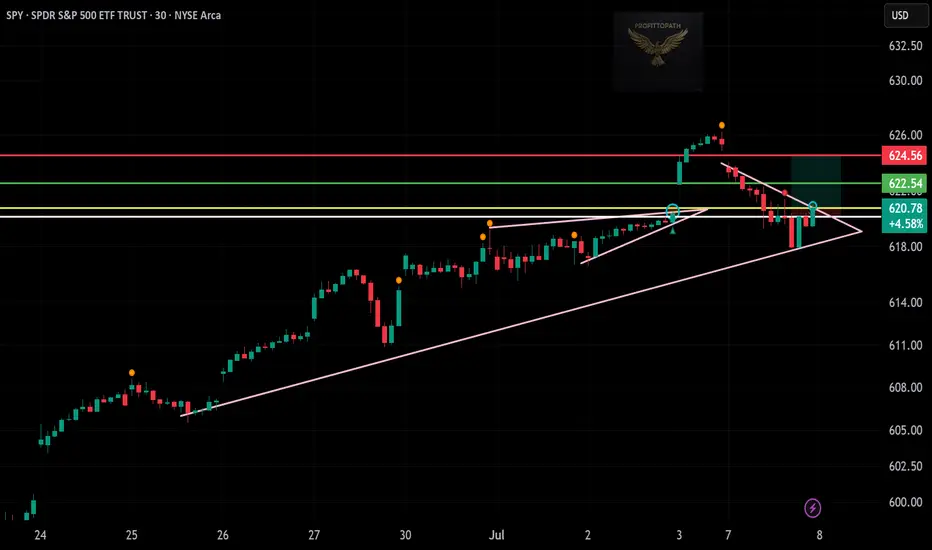
SPY Breakout Setup – Bullish Pattern Watch! 📈 🟢
SPY has formed a clear ascending triangle with strong support at $616. After a pullback, it’s now breaking out above $620.78 with a bounce from trendline support and rejection of lower prices.
📌 Trade Details:
🔹 Entry: $620.78
🔹 Stop Loss: $616.00
🔹 Target: $624.56
🔹 Pattern: Ascending Triangle Breakout
This setup aligns with market momentum and breakout structure. Great risk-reward for bulls watching major index movement.
—
📊 Posted by: ProfittoPath
#SPY #SP500 #ETFTrading #BreakoutSetup #MarketUpdate #ProfittoPath #TechnicalAnalysis #StockTrader #ChartAnalysis
SPY Gamma Squeeze Fading – Key Put Wall Battles Ahead 🧨 GEX Options Sentiment (TanukiTrade GEX Chart)
* Current Price: 619.91
* Major Support Wall:
* GEX Cluster Support: 618 → 617 (Highest Negative Net GEX + 3rd PUT Wall)
* Additional GEX Floor: 616.37 (PUT support overlap with SMC zone)
* Resistance Levels:
* 625.34 → First CALL Wall
* 627 → 2nd CALL Wall
* 630 → Top of CALL Gamma Resistance
* Put Wall Dominance:
* GEX7–GEX10 blocks show heavy negative pressure (-47% to -66%) centered between 617–620
* Options Flow Insight:
* PUTS OI: 41.9% – Signaling downside hedges are still dominant
* IVR: 15.3 (low), IVX avg: 18.2 – Implied volatility suggests premium selling could get tricky unless directional trend returns
🔸 Interpretation:
This is a “put-heavy zone” — large GEX support clusters below price (617–618) are temporarily halting further drop, but unless SPY can reclaim 625.34, there's still gamma-driven downside risk.
🟢 1-Hour SMC Price Action
* Recent Structure:
* BOS confirmed → 626.27
* CHoCH to downside below 620 → confirmed rejection
* Current Setup:
* Price is hovering at minor demand between 617–620
* If 616.37 breaks, it opens room toward SMC demand zone at 604–606
* Strong resistance overhead at 625–627 (OB + GEX call wall + CHoCH retest)
🔸 Scenario 1 – Bullish Reclaim:
* Entry: Above 621
* Target: 625.34 → 627
* Stop: Below 616.00
* Setup: Break/retest of CHoCH + reclaim trendline
🔸 Scenario 2 – Bearish Breakdown:
* Entry: Below 616.37
* Target: 606 → 600
* Stop: Above 620
* Setup: Breakdown from demand + confirmed CHoCH retest
📌 Thoughts & Recommendations:
* Scalpers: Watch 620.50–621.00 as intraday pivot.
* If reclaimed, we may see short squeeze into 625–627
* Below 616.37, put flows will likely accelerate
* Swing Traders: Bearish bias unless 625.34 flips → consider spreads or directional puts
* Neutral Edge: This is a gamma battle zone — don’t overcommit, let price pick a side
Disclaimer: This analysis is for educational purposes only and does not constitute financial advice. Trade based on your risk profile and always use a stop-loss.

Nightly $SPY / $SPX Scenarios for July 8, 2025🔮 Nightly AMEX:SPY / SP:SPX Scenarios for July 8, 2025 🔮
🌍 Market-Moving News 🌍
📉 U.S. Stocks Slip on New Tariff Threats
President Trump announced plans to impose 25% tariffs on imports from Japan, South Korea, Malaysia, Kazakhstan, South Africa, Laos, and Myanmar starting August 1, reigniting trade jitters. The Dow fell ~0.9%, the S&P 500 dropped ~0.8%, and the Nasdaq slid ~0.9% on the news, while bond futures rallied and the dollar strengthened
⚖️ Tariff Pause Deadline Looms
Markets are focused on the July 9 deadline for the current tariff pause, which now hinges on imminent trade negotiations. Investors are balancing the risk of reimposition against progress with agreements involving the U.K., Vietnam, and Canada
💵 Consumer Credit Moderates
June’s consumer credit increase slowed to $10.60 billion vs. April’s $17.87 billion—still strong, but a cooling sign in household borrowing patterns. This tempered the dollar’s rise amid mixed signals on consumer resilience.
🛢️ Oil Drops on Rising OPEC+ Supply
Oil prices fell, with Brent dipping to ~$68.00/barrel and WTI to ~$65.30, after confirmation of OPEC+’s August supply hike—adding to bearish cues for energy stocks .
📊 Key Data Releases & Events 📊
📅 Tuesday, July 8:
3:00 PM ET – Consumer Credit (June)
Moderation in borrowing signals possible easing in consumer-driven growth.
4:30 PM ET – API Weekly Crude Inventories
A key indicator for energy markets; lower inventories lift oil prices, while builds push them down.
Throughout the Day – Tariff Pause Deadline
Market stability hinges on whether trade agreements materialize before the break expires.
⚠️ Disclaimer:
This information is for educational and informational purposes only and should not be construed as financial advice. Always consult a licensed financial advisor before making investment decisions.
📌 #trading #stockmarket #economy #tariffs #consumercredit #oil #technicalanalysis

spy puts on level 610 and 614There some level i would like to meet 610 and 614
Disclaimer- it a opinion

Monday Markets Update SP500 may start pulling back, we'll have to see if they can get any downward pressure hapening. USOIL still looks bearish. Gold and Nat Gas both looks like they are going sideways right now. BTC still hasn't broken out above 110k.

QQQ Massive Short! SELL!
My dear subscribers,
QQQ looks like it will make a good move, and here are the details:
The market is trading on 556.22 pivot level.
Bias - Bearish
My Stop Loss - 564.94
Technical Indicators: Both Super Trend & Pivot HL indicate a highly probable Bearish continuation.
Target - 542.15
About Used Indicators:
The average true range (ATR) plays an important role in 'Supertrend' as the indicator uses ATR to calculate its value. The ATR indicator signals the degree of price volatility.
Disclosure: I am part of Trade Nation's Influencer program and receive a monthly fee for using their TradingView charts in my analysis.
———————————
WISH YOU ALL LUCK

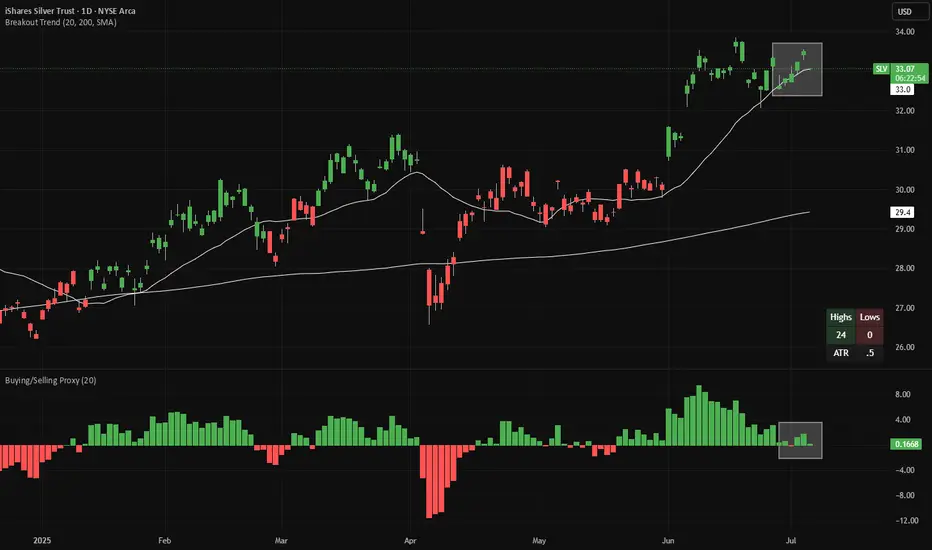
Long Silver - Buy the DipSilver is making 20-day highs (green candles in the main chart), while pulling back towards the 20D EMA line. Meanwhile, looking at a proxy of net buying/selling (bottom panel), we are almost at net selling levels.
There is good risk/reward to buy silver here, with a stop-loss if the price closes at a 20-day low. If a 20-day low is made, the candles will change color from green to red.
Both indicators (Breakout Trend and Buying/Selling Proxy) are available for free on TradingView.