Only by understanding the trend can you be firmly bullish.The market is changing rapidly, and going with the flow is the best way to go. When the trend comes, just go for it. Don't buy at the bottom against the trend, so as not to suffer. Remember not to act on impulse when trading. The market is good at dealing with all kinds of dissatisfaction, so you must not hold on to orders. I believe many people have experienced this. The more you resist, the more panic you will feel, and the floating losses will continue to magnify. You will not be able to eat or sleep well, and you will miss many opportunities in vain. If you also have these troubles, then you might as well follow Tian Haoyang's rhythm and try to see if it can make you suddenly enlightened. If you need help, I will always be here, but if you don't even extend your hand, how can I help you?
Gold rose unilaterally after the positive non-farm payrolls on Friday, hitting a new high this week. This week's K-line closed in a hammer shape, and the gold hourly line has a double bottom structure. However, gold should not have such a big retracement for the time being. The 3335-3330 line below is also an important support. So gold will mainly be bought on dips above 3335-3330 next week. Technically, there is still room for growth next week. The bulls continued to attack at the end of Friday and closed at 3363. Next week, we will continue to pay attention to the short-term suppression at the 3370-3375 line above. In terms of operations, we will continue to maintain retracement and buy. If your current operation is not ideal, I hope I can help you avoid detours in your investment. Welcome to communicate and exchange. Judging from the current gold trend, the short-term resistance above next week will be around 3370-3375, with a focus on the important pressure line of 3395-3400. Keep buying on pullbacks, and try to maintain a stable wait-and-see position in the middle. I will prompt the specific operation strategy at the bottom, so please pay attention in time.
Gold operation strategy: Go long on gold when it retraces to around 3340-3330, target 3370-3375, and continue to hold if it breaks through.
Futures market

Technical Analysis | XAU/USD | 4-Hour Timeframe🔍 Technical Analysis | XAU/USD | 4-Hour Timeframe
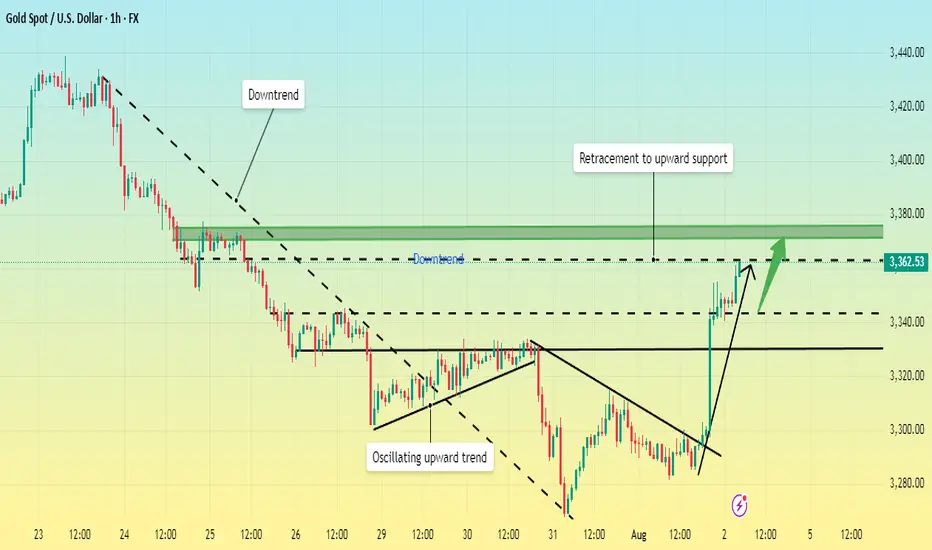
Following the recent drop, gold has shown a bullish reaction from a key support area and is currently trading just below a major resistance level — a zone that has previously acted as a strong barrier to upward movement. At this stage, the market is in a zone of contention between buyers and sellers, with both bullish and bearish scenarios on the table.
🔼 Bullish Scenario:
If the price breaks above and stabilizes beyond the current resistance, there is a strong possibility for the uptrend to continue toward higher resistance zones. This movement could push the price toward previous highs, and if those levels are breached, the blue supply zone marked above would become the next potential target. Confirmation of this scenario would require strong bullish candles and sustained price action above the resistance area.
🔽 Bearish Scenario:
Should the price react negatively in this zone and form a strong bearish candle, it may retreat back toward the recent support area. If this support fails to hold, the correction could deepen, potentially driving the price toward lower support zones that have previously shown strong reversal behavior.
✅ Conclusion:
The market is currently positioned at a critical juncture. Price behavior around this resistance level will determine the next direction. It's advisable to wait for clear confirmation of either a breakout or a rejection before entering any trade.

Will prices stage a comeback? Continue their upward trend?Information Summary:
Market participants currently expect the Federal Reserve to cut interest rates twice before the end of the year, starting in September. Earlier this week, the Fed maintained interest rates at 4.25%-4.50%. Powell stated that it was too early to determine whether a September rate cut would occur, citing the need to monitor inflation and employment data.
Market Analysis:
Looking at the 4-hour and 1-hour charts, gold's Bollinger Bands are showing signs of opening upward after Friday's sharp rise. However, it's important to note that a surge-like top opening typically lacks sustainability, and the Bollinger Bands will close again after returning to technical levels. Currently, prices are trading above the upper band, which is not conducive to a direct rise.
The 1-hour chart shows a blunting of the moving averages, and the upper Bollinger Band is about to close. Overall, while gold is strong, it's not appropriate to be overly bullish. Focus on shorting opportunities next Monday, and then consider a bullish outlook after a price correction.
In the short term, focus on resistance in the 3375-3385 range above, and support in the 3345-3335 range below, followed by support near 3315.
Trading Strategy:
Short around 3365-3375, stop loss at 3385, profit range 3345-3335-3315;
Go long on a pullback to 3335-3340, stop loss at 3325, profit range 3350-3360;

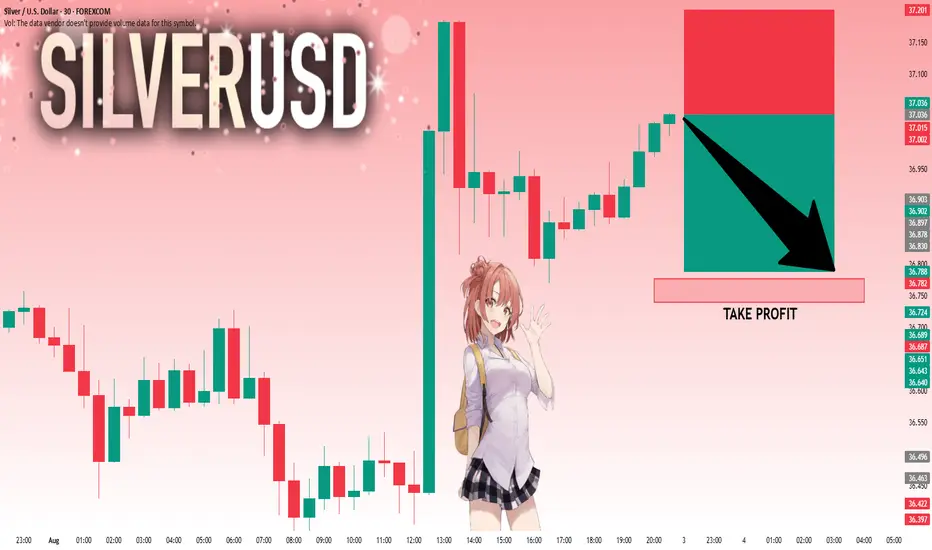
SILVER Move Down Ahead! Sell!
Hello,Traders!
SILVER is about to retest
A horizontal resistance level
Of 37.21$ and its a strong
Key level so after the retest
We will be expecting a
Local pullback
Sell!
Comment and subscribe to help us grow!
Check out other forecasts below too!
Disclosure: I am part of Trade Nation's Influencer program and receive a monthly fee for using their TradingView charts in my analysis.

GOLD CORRECTION AHEAD|SHORT|
✅GOLD is going up now
But a strong resistance level is ahead at 3377$
Thus I am expecting a pullback
And a move down towards the target of 3352$
SHORT🔥
✅Like and subscribe to never miss a new idea!✅
Disclosure: I am part of Trade Nation's Influencer program and receive a monthly fee for using their TradingView charts in my analysis.

Next week's gold price target is above $3,400.Next week's gold price target is above $3,400.
Continue buying on dips.
Any pullback in gold prices next week will be an optimal buying opportunity.
Gold Technical Analysis:
This week's non-farm payroll data demonstrated significant bullish momentum, directly driving gold prices soaring. The price increase has completely erased all of this week's losses, demonstrating exceptionally strong upward momentum.
The current trend shows a significant shift in the balance of power between bulls and bears in the gold market, completely reversing the previous bull-bear pattern.
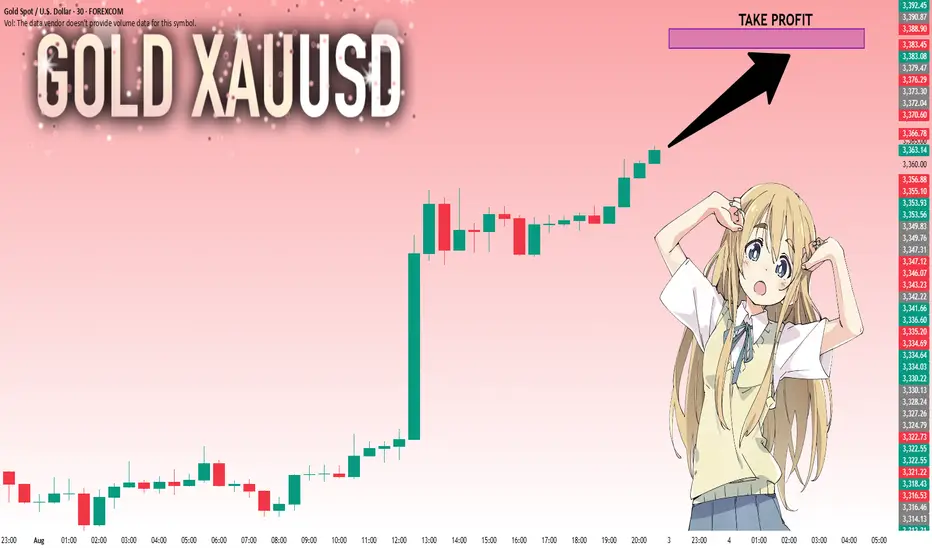
Gold prices broke through the $3,300 mark and have surged strongly, climbing to $3,362 so far, with no signs of stopping.
Based on this strong performance, it's not impossible for gold prices to test the $3,370 level next week. Bullish forces are clearly dominant in the market.
It's worth noting that the rapid market rally was driven by these strong data.
If you didn't buy in on the initial rally or go long when the price broke through support, subsequent pullbacks may provide few entry opportunities.
Therefore, investors need to be more proactive when selecting entry points.
Specifically for next week's trading:
If the price falls back to 3340, we recommend continuing to buy and maintain a bullish outlook.
Upward resistance levels include 3375-3385.
Overall, the short-term gold strategy for next week recommends buying on dips.
Upward resistance levels are 3377-3382.
Downward support levels are 3345-3335.

3$ psychological level natural gas bounceGood long opportunity for natural gas at the 3$ level.
Argument1: Weekly candle held the 3 $ psychological level
Argument2: Gap fill on Ng1! natural gas futures
Argument3: Triple bottom on XNGUSD natural gas

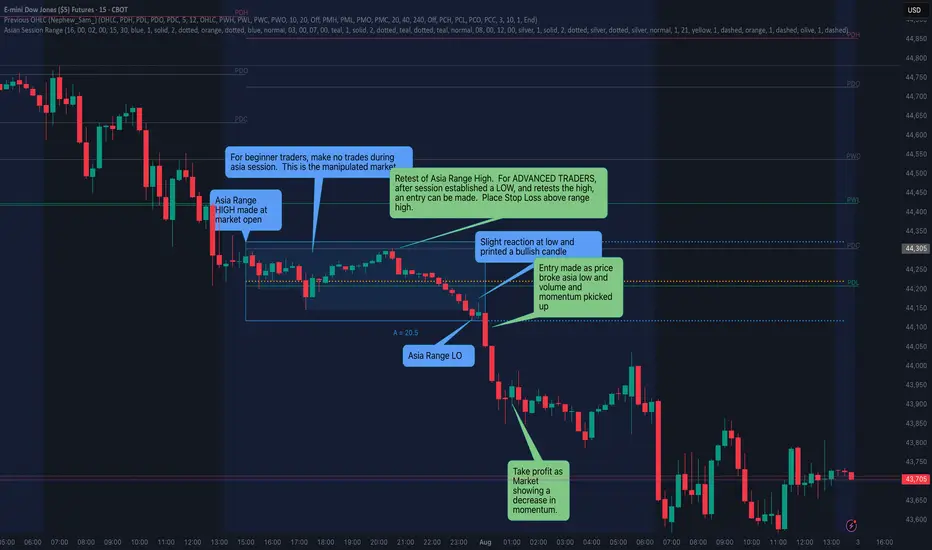
Asia Range Breakout - The trap and the entryDescription:
This chart illustrates a textbook Asia Session Range breakout, highlighting both the manipulative trap and the ideal entry based on the SquawkTradeFX strategy.
🔹 Asia Session Range (Grey Box):
This tight consolidation forms overnight during the Asia session.
Price oscillates within a narrow high/low range, creating the trap zone.
This is the “wick zone” of the eventual daily candle.
🔹 The Trap — Liquidity Sweep:
Notice how price first fakes a breakout to the upside, breaking above the Asia High.
This is a liquidity grab, targeting early breakout buyers and triggering their stop-losses.
🔹 The Confirmation & Entry:
After the upside trap, price quickly reverses, sweeping back down.
Momentum increases and volume picks up as price breaks below the Asia Low.
This break signals a true shift in directional intent and offers a high-probability entry as the daily body forms.
🟢 Entry Zone:
Entry is taken on the bearish breakout of the Asia Low after the sweep.
Ideally confirmed with strong bearish candle structure and volume from the London or NY session.
📌 Why This Matters:
This setup exemplifies the SquawkTradeFX principle:
“Let the traps spring first — then strike with confirmation.”

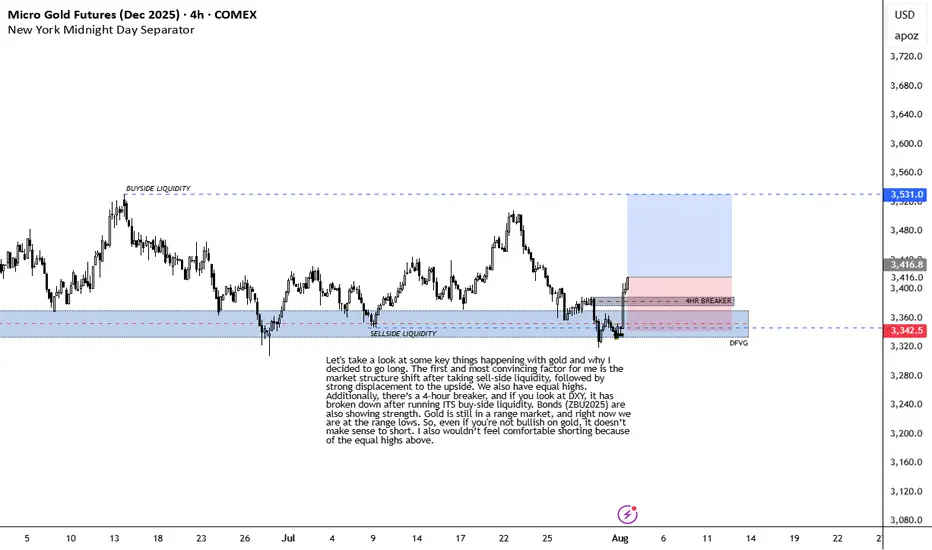
BULLISH ON GOLDLet's take a look at some key things happening with gold and why I decided to go long. The first and most convincing factor for me is the market structure shift after taking sell-side liquidity, followed by strong displacement to the upside. We also have equal highs. Additionally, there’s a 4-hour breaker, and if you look at DXY, it has broken down after running ITS buy-side liquidity. Bonds (ZBU2025) are also showing strength. Gold is still in a range market, and right now we are at the range lows. So, even if you're not bullish on gold, it doesn’t make sense to short. I also wouldn’t feel comfortable shorting because of the equal highs above.
INVALIDATION IS RECENT 4HR LOW.
XAUUSD | Weekly Fakeout → Wedge Breakout | Targeting 3508+🔔 Summary:
Reclaimed liquidity, broke wedge structure with strength, and printed continuation signs.
Expecting bullish move toward 3,508 on higher timeframe if breakout holds.
Will reassess if price closes below 3,314 (invalidates short-term momentum).
🔔 Long Version:
📝 Description:
📆 Date: 2nd August 2025
📊 Timeframe: Weekly → Multi-TF Analysis
📈 Bias: Bullish
🧠 Setup: High-volume breakout from descending wedge + weekly fakeout/liquidity sweep.
⸻
🧱 Structure
• Weekly fakeout below trendline rejected with strength
• 4H bullish engulfing candle broke through EMA stack and wedge resistance
• Price retested previous Fair Value Gap (FVG) and confirmed buyer strength
• Strong volume spike and MACD momentum shift confirmed breakout conviction
📊 Indicators
• EMAs: Price above 20/50/100/200 on H1 & 4H
• MACD: 4H flipping bullish, Weekly still holding green
• Volume: Significant bullish breakout candle, multi-timeframe confluence

BOS/chochcomment on how to catch trade after BOS?
ICT is interesting but no set rule, please share if any universal rule.

Buy Side favaourable @ XAUUSDGold has strong potential for trading on buy side if we see any correction of few 50 $ downwards.
Buy at every Dip is suggested.

SILVER: The Market Is Looking Down! Short!
My dear friends,
Today we will analyse SILVER together☺️
The market is at an inflection zone and price has now reached an area around 37.036 where previous reversals or breakouts have occurred.And a price reaction that we are seeing on multiple timeframes here could signal the next move down so we can enter on confirmation, and target the next key level of 36.788..Stop-loss is recommended beyond the inflection zone.
❤️Sending you lots of Love and Hugs❤️
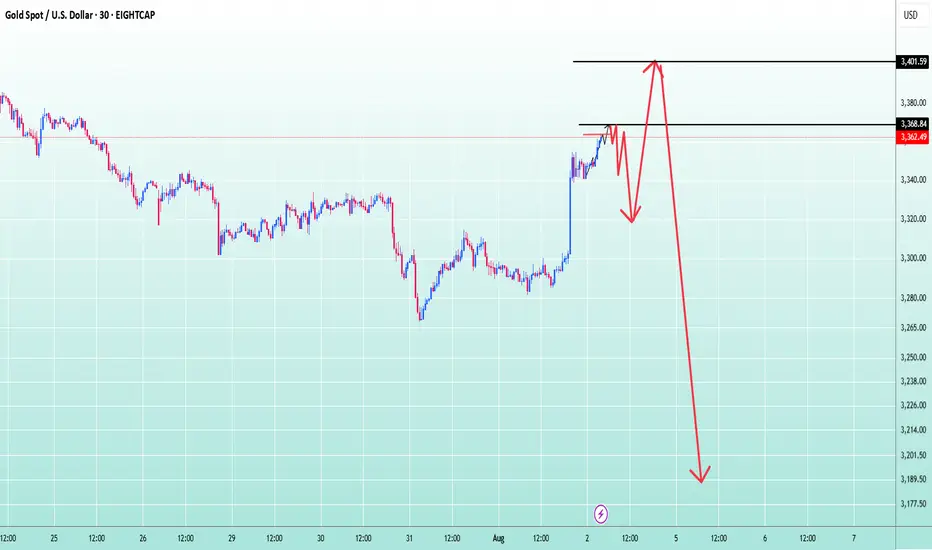
Gold trend analysis!From the price level of 3368 and above, gold is expected to pull back at least until the Stochastic on the M30–H1 timeframes reaches oversold levels.
After that, a bullish continuation is likely, pushing the price up to around 3400.
This area will be a critical decision point — determining whether the market will continue its uptrend or reverse into a downtrend.
If the H4 chart prints a reversal candlestick pattern, it would indicate the beginning of a bearish trend, which could potentially lead to a downward movement of up to 20,000 points.
Still Bullish BiasOn the 4HR , there is already 2 legs down to start the month, similar to what happened in May. Markets typically has had 2 legs down before moving higher. Its August and its gonna be choppy.
We may test the tip of last years candle before we move even higher, which is another probably 80-100 points. However the hourly seems to reject this idea based on a 9 TD Sequential Count as the first alert failed and Bear continues pushing the price down. When in doubt always look at a higher timeframe. Just my thought of the probable outcome. Trade safe.

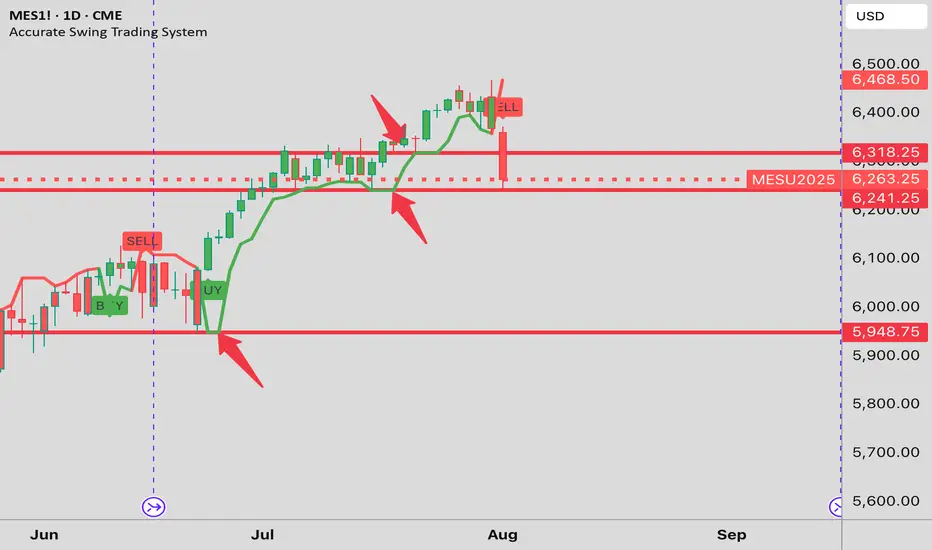
Friday's support clearly shown This is why I use the Accurate Swing Trading System (Ceyhun). Look at it in default configuration on this daily MES1! chart. I drew the red horizontal lines where the indicator line is "flat". That is what I am trying to show you. An "Emergent Quality" of the indicator. I note the line at 6,241 and the LOD at 6239.50. ( line at 6318 failed to support the price) My experience with it says it's better than Fibonacci, Camarilla etc. Where do we go from here?.....The market will show us....Let the Ceyhun show you support and resistance on shorter term charts....You will be glad you did. Happy Trades. DAP
Has a bull market started? In-depth analysis.Friday's non-farm payroll report was unexpectedly disappointing, sending gold soaring.
Data released by the U.S. Department of Labor on Friday showed that non-farm payrolls added only 73,000 jobs in July, far below market expectations of 100,000. The weak employment report quickly shifted market sentiment regarding the Federal Reserve's policy path. Market expectations for a September rate cut have soared to 75%, with another cut expected before the end of the year.
This shift has provided strong support for gold prices. Amidst persistent inflationary pressures and disappointing employment data, a Fed rate cut would be a substantial boon for gold.
Friday's data triggered a sharp rise in gold prices on the daily chart, reversing a week-long decline. This is the first sign of a pattern that breaks a weak downward trend. Following consecutive declines, the daily chart began to rise, directly reversing a week's losses. This pattern is likely to continue next week, forming a bullish pattern, with a potential second leg higher. Therefore, next week will be crucial for bullish sentiment, with key focus on whether it can break through the highs and the continuity of the bullish trend.
The bullish trend is likely to continue next week. It's also important to note that Friday's pullback to around 3340 marked an inflection point, a watershed between bulls and bears and a secondary bullish level. Since Friday's close was near resistance, it's important to watch whether the market will surge directly next week or retreat before rising again. If the rally isn't sustained in the early Asian session, a correction is likely to occur, accumulating upward momentum.
GOLD: Bulls Are Winning! Long!
My dear friends,
Today we will analyse GOLD together☺️
The recent price action suggests a shift in mid-term momentum. A break above the current local range around 3,363.50 will confirm the new direction upwards with the target being the next key level of 3,383.45 and a reconvened placement of a stop-loss beyond the range.
❤️Sending you lots of Love and Hugs❤️
Gold will continue to rise next week✅ Fundamental Analysis
Friday’s Non-Farm Payrolls (NFP) data came in significantly below expectations, with new job additions falling far short of market forecasts. This sparked a sharp rise in expectations for a Fed rate cut later this year. As a result, the U.S. dollar index declined and gold prices surged violently, rallying from the 3281 level to a high of 3362 — a single-day gain of over $85, completely erasing the week's prior losses and reestablishing a strong bullish structure.
✅ Technical Analysis
📊 Weekly Chart
Gold posted a strong bullish weekly candlestick, reversing the previous consolidation trend and signaling a structural shift in market sentiment. Bulls have regained full control. The key resistance zone lies between 3380–3400; if price breaks and holds above this level, the next upside target will be around 3430.
📊 Daily Chart
Gold stabilized at the 3281 low and surged on Friday evening following the NFP surprise, closing near the day’s high — a sign of aggressive buying. The short-term trend has clearly reversed to the upside, and any pullback is now considered a buying opportunity. The key support has moved up to around 3335, serving as a critical pivot zone. Further support is seen near 3316, a previous swing low.
📊 Hourly Chart
Price is currently trading above short-term moving averages, indicating a strong bullish bias. The key level for a potential bullish continuation is around 3355, which represents a recent support-turned-resistance area. If price pulls back to this level and holds, or breaks above it directly, it will confirm bullish strength. If gold opens with a gap higher toward 3385, beware of potential short-term volatility due to a liquidity gap. Chasing highs in such scenarios requires caution.
🔴 Resistance Levels: 3375–3380 / 3400–3430
🟢 Support Levels: 3355–3340 / 3330–3335 / 3316
✅ Trading Strategy Reference
🔺 Primary Strategy – Buy on Dips:
🔰Consider long entries around 3340–3335, with a stop-loss below 3328.
🔰If the market remains strong, a direct long near 3355 is viable, targeting 3375 and above.
🔰A deeper pullback to 3330–3335 is a favorable entry zone for mid-term longs.
🔻 Secondary Strategy – Sell on Rebounds (Short-Term Only):
🔰If gold opens Monday with a sharp spike to around 3385 but fails to break higher, a light short position may be considered, targeting a quick $10–$15 pullback.
🔰If 3385 is broken and held, abandon short setups and revert to a bullish view.
✅ Overall Outlook
Gold has completed a technical reversal following the bullish fundamental catalyst from the NFP data. The trend has shifted from bearish to bullish, and the market has clearly moved into a higher price range. The core trading logic should remain “buy on dips”, and countertrend trades should be approached with caution. Look for long opportunities near key support levels, and consider short positions only at major resistance levels and for quick intraday trades. A confirmed breakout above 3375 will likely open the door to 3400–3430 in the near term

USOIL Technical Analysis! BUY!
My dear followers,
I analysed this chart on USOIL and concluded the following:
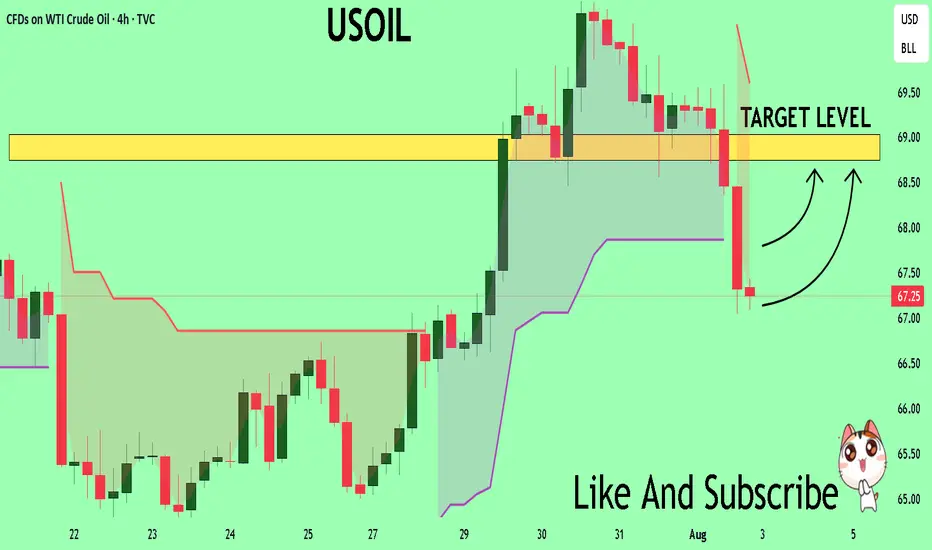
The market is trading on 67.25 pivot level.
Bias - Bullish
Technical Indicators: Both Super Trend & Pivot HL indicate a highly probable Bullish continuation.
Target - 68.74
About Used Indicators:
A super-trend indicator is plotted on either above or below the closing price to signal a buy or sell. The indicator changes color, based on whether or not you should be buying. If the super-trend indicator moves below the closing price, the indicator turns green, and it signals an entry point or points to buy.
Disclosure: I am part of Trade Nation's Influencer program and receive a monthly fee for using their TradingView charts in my analysis.
———————————
WISH YOU ALL LUCK
WTIWTI crude oil (West Texas Intermediate) is one of the main global benchmarks for oil pricing, alongside Brent crude. It is a light, sweet crude oil primarily produced in the United States and traded on the New York Mercantile Exchange (NYMEX). WTI is known for its high quality and low sulfur content, making it ideal for refining into gasoline and other fuels. Crude oil prices are influenced by a wide range of factors including global supply and demand dynamics, geopolitical tensions, OPEC+ decisions, US shale production, and macroeconomic trends such as inflation and economic growth.
Over the past two decades, crude oil has experienced significant volatility. Prices surged to over $140 per barrel in 2008, collapsed during the global financial crisis, and again plummeted during the COVID-19 pandemic in 2020, when demand collapsed and prices briefly turned negative for the first time in history. The years following saw a sharp rebound as the global economy reopened and supply constraints persisted. However, rising interest rates, concerns about slowing global growth, and increasing energy transitions toward renewables have put downward pressure on oil demand in recent years.
As of August 2025, WTI crude oil is trading at $66.59 per barrel, reflecting a relatively weak energy market compared to its highs in 2022. The current price suggests concerns over slowing global industrial demand, increased US oil production, and ongoing geopolitical negotiations that have stabilized some of the previous supply shocks. While energy markets remain sensitive to global conflicts, economic shifts, and OPEC+ policy decisions, WTI at this level represents a market balancing between moderate demand and ample supply. It remains a critical asset for energy traders and a key indicator of global economic health.

LIVE BTC/USD, XAUUSD TRADING, 02/08/2025 SIGNALS PRICE ACTION TRLive BTC/USD, XAUUSD TRADING, 02/08/2025 signal price action trading strategy
