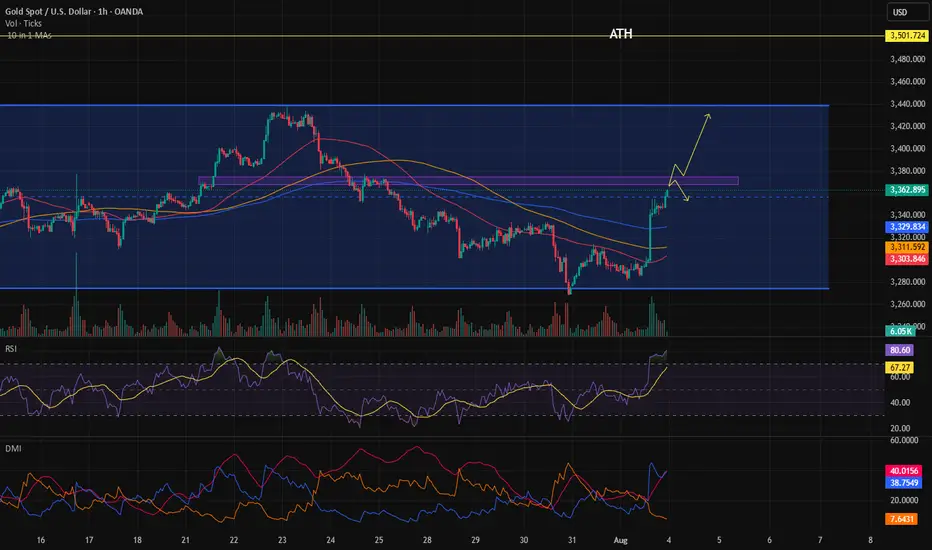
Trend continuation or reversal?Gold bounced strongly from the bottom of the higher time frame channel, and we should also consider that this bounce was triggered by news that was negative for the dollar on Friday. Now we need to wait and see whether this move is truly strong or if it's going to turn out to be a fake and head back down toward the bottom of the channel.
Futures market
Gold Futures Super Strong Resistance - Price Coming Back StrongGold Future has been very strongly pushing up without filling any gapes in the short side before pushing up more further.
One unique line is probably the target super strong resistance.
In a daily chart, probably better wait until it reaches that point to try to check for strong short entries maybe.
Still arriving there it would explode up even more further to transform that line into a super strong probable support.
Keep watching!
(Do we actually have to believe that gold is secretly targeting $10,000) in the Yearly Chart?... Since February 2022 it just went berserk!)

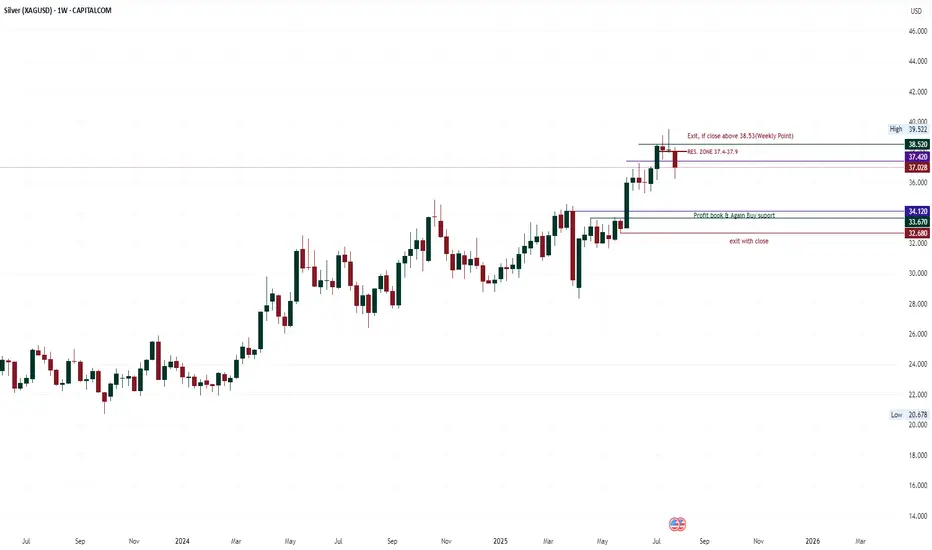
silver correction patternThere has been no close above 38.52 in the last 4 weeks, i.e. every weekend has closed below 38.52. The weekend candle of 7 July is an important candle, apart from this this week's candle has also closed below the low of 14 July, which also indicates a down sign, over all a resistance zone is shown from 37.42 to 37.95. This pattern can go down to 34.1 or 33.67. But use a strict weekend Stop loss of 38.52.
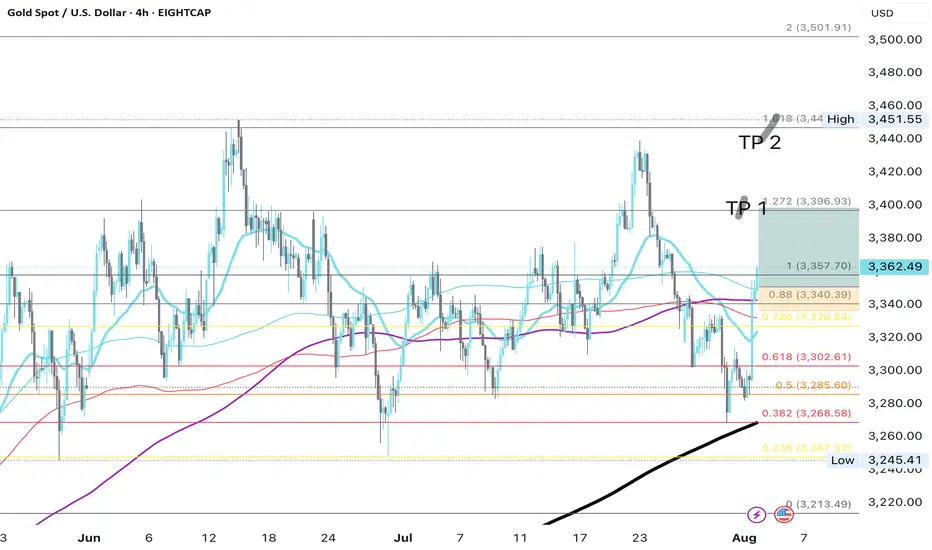
GOLD LONG TRENDAfter price correction and a downward movement that touched the 600 and 300 moving averages on the 4H chart, with a subsequent strong bullish candlestick reversal and a breakout above the MA200, we can expect the bullish trend to continue respecting the Fibonacci levels. In the coming week, upon the first touch of the 3350 price level, we may enter a long position. The price could potentially extend even beyond the specified level, reaching the 1.618 Fibonacci extension. The first target at 3396 seems the most probable scenario...
Oil (WTI) – Upcoming Buy OpportunityBased on the analysis I conducted using fractals, oil is expected to move upward and provide buyers with a 2% gain, equivalent to 140 pips.

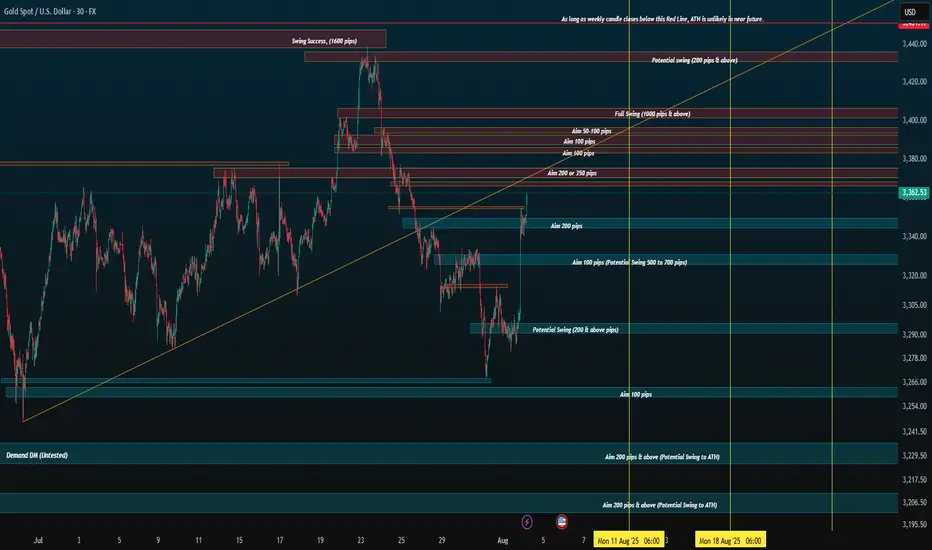
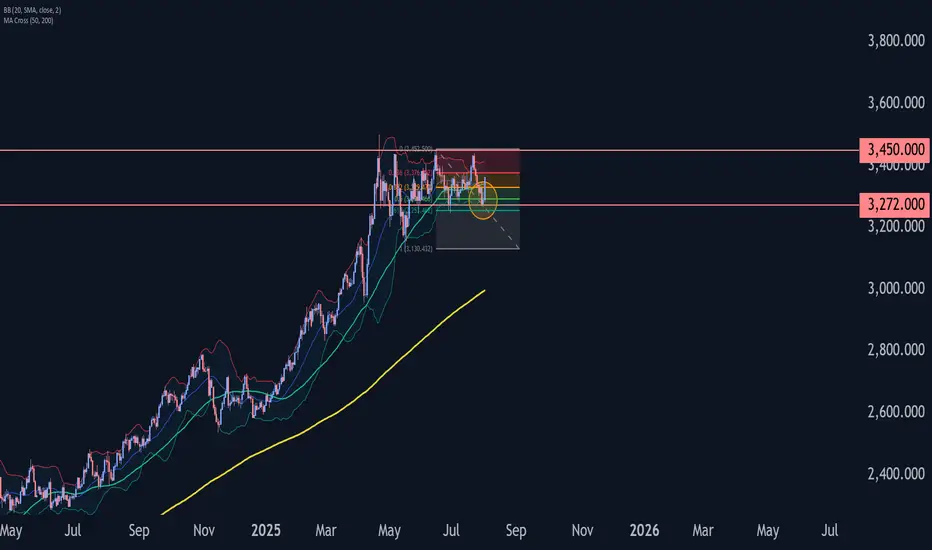
Revised and detailed zones (But messy)I'm very interested to see how August will end. If we break the red line (weekly body), then ATH is on the horizon.
I will only execute from the zones and how the price action coming towards the zone. Otherwise I will just ignore the chart.
USOIL BULLS ARE STRONG HERE|LONG
USOIL SIGNAL
Trade Direction: short
Entry Level: 67.26
Target Level: 68.46
Stop Loss: 66.46
RISK PROFILE
Risk level: medium
Suggested risk: 1%
Timeframe: 1h
Disclosure: I am part of Trade Nation's Influencer program and receive a monthly fee for using their TradingView charts in my analysis.
✅LIKE AND COMMENT MY IDEAS✅

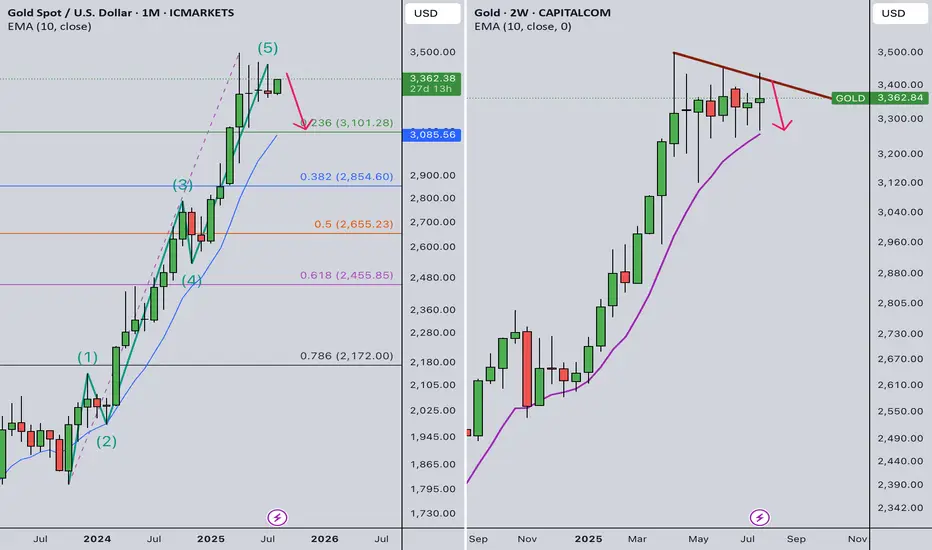
Gold Weekly Summary and Forecast 8/2/2025In monthly TF, gold has completed the full Elliot wave and it should go into a series of correction. But in 2W TF, it printed out a green bar. However, the trendline still valid. As long as the trendline is not broken, I am still bearish in gold in medium term.
Therefore, for next week, gold should first go up and should be capped at 3410. Price could quickly drop after that.
Let's see how the market plays out next week.
SILVER WILL FALL|SHORT|
✅SILVER is going up now
But a strong resistance level is ahead at 37,60$
Thus I am expecting a pullback
And a move down towards the target of 36,69$
SHORT🔥
✅Like and subscribe to never miss a new idea!✅
Disclosure: I am part of Trade Nation's Influencer program and receive a monthly fee for using their TradingView charts in my analysis.

#GOLD #XAUUSD Seems to have ended the correction FX_IDC:XAUUSD Gold Spot might have completed the correction as a complex 3-3-5 FLAT, and is currently turning higher in wave (ii), however this get invalidated if THE LAST LOW OF 3268.19 BREAKS. Till the pivot 3268.19 stays strong, the move should be impulsive and take us to new high near term.

Gold Wave Analysis – 1 August 2025
- Gold reversed from the support zone
- Likely to rise to the resistance level at 3450.00
Gold today reversed from the support zone between the support level 3272.00 (which has been reversing the price from the end of May), lower daily Bollinger Band and the 50% Fibonacci correction of the upward wave B from May.
The upward reversal from this support zone created the daily Japanese candlesticks reversal pattern, Morning Star.
Given the clear daily uptrend and the oversold daily Stochastic, Gold can be expected to rise to the next resistance level at 3450.00 (top of waves B and ii).
08/1/25 Trade Journal, and ES_F Stock Market analysis EOD accountability report: +440
Sleep: 6 hours
Overall health: Good
VX Algo System Signals from (9:30am to 2pm)
— 9:30 AM Market Structure flipped bearish on VX Algo X3!
— 10:12 AM VXAlgo ES X1 Buy signal
— 10:20 AM VXAlgo NQ X1 Buy Signal
—12:30 PM Market Structure flipped bullish on VX Algo X3!
— 1:00 PM Market Structure flipped bearish on VX Algo X3!
— 1:50 PM VXAlgo ES X1 Buy signal,
— 3:00 PM Market Structure flipped bullish on VX Algo X3!**
What’s are some news or takeaway from today? and What major news or event impacted the market today?
Market range expanded a lot today, we dropped over 100 points today and sometimes i forget to adjust my bracket orders to go for 10 -15 points take profits when the volatility is so high. But overall, it was a good day, I knew to be patient as market was wild and sometimes you want to just snipe a few trades and call it a day before you get caught on the wrong side.
The great thing about big moves is that it will eventually hit a major level and it will react really well, you just have to wait for it.
a great question is will the market recover? Or is going back down to April prices?
News
*STOCKS TUMBLE TO END THE WEEK, VIX SPIKES AS SOFT JOBS DATA STOKE ECONOMIC JITTERS
What are the critical support levels to watch?
--> Above 6330= Bullish, Under 6310= Bearish

Daily Orderflow on ES and NQ. 01.08.2025, NFP FridayCME_MINI:NQ1! CME_MINI:ES1!
Orderflow explanation. Sessional delivery and New York Price action

XAUUSDso Gold (XAU/USD) broke support, retested it as resistance, and is holding below. That’s a classic bearish continuation setup.
Structure: Market forming lower highs and lower lows, confirming bearish trend.
Bias: Strongly bearish while price trades under the broken support zone.


Today's Long in Gold! Perfect setup... Lower level support multiple times, Entry WITH small SL and the news followed... 3299- 3350 🚀

I think this strong rebound was a pullback I think this strong rebound was a pullback and the target is much lower.
ID: 2025 - 0158.1.2025
Trade #15 of 2025 executed.
Trade entry at 140 DTE (days to expiration).
Excellent fills this morning, well under mid. Created a GTC working order two days ago and let price come to me. No chasing. There are TONS of external liquidity voids resting below.
Target profit is 5% ROI
Happy Trading!
-kevin

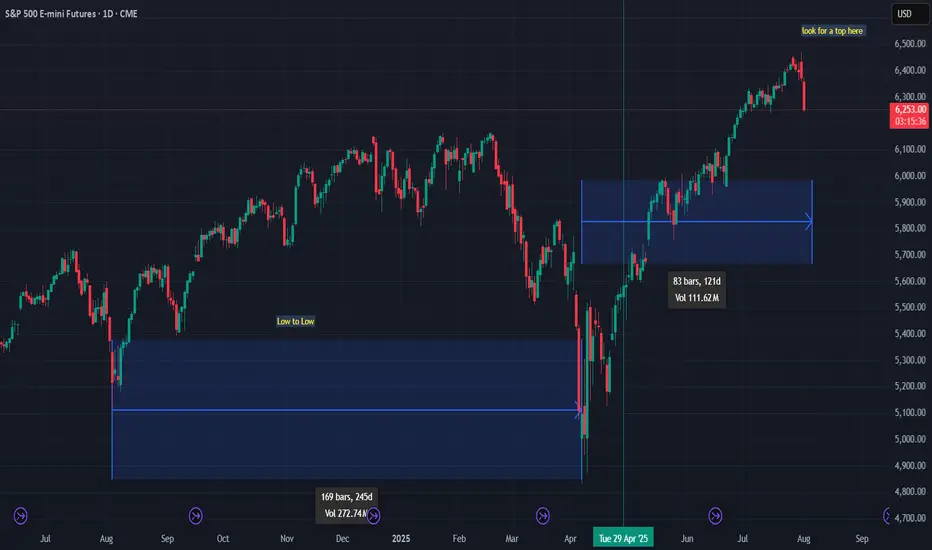
looking for a possible top for SPX500 , cycle highlooking for a possible top for SPX500 , cycle high
How to Use Engulfing Candles in TradingViewEngulfing patterns are among the most powerful candlestick formations because they signal strong momentum shifts and can help you spot dramatic trend reversal opportunities.
What You'll Learn:
• How to identify valid engulfing formations where one candle completely covers another's body
• The two types: bullish engulfing (green candle engulfs red) and bearish engulfing (red candle engulfs green)
• Psychology behind engulfing patterns: when one side completely overwhelms the other
• Using volume analysis to confirm engulfing pattern validity
• Finding meaningful engulfing patterns at trend highs and lows for reversal setups
• Timeframe considerations for engulfing analysis on any chart period
• Step-by-step trading strategy for engulfing reversal setups
• Setting proper stop losses above engulfing candle highs
• Determining profit targets below engulfing candle lows
• Managing wide-range drawdowns common with strong momentum shifts
• Advanced entry technique: waiting for retracements to improve risk-reward ratios
This tutorial may help futures traders and technical analysts who want to use powerful candlestick patterns to identify significant momentum changes.
The strategies covered could assist you in creating effective reversal setups when strong buying or selling pressure appears at key price levels.
Learn more about futures trading with Tradingview: optimusfutures.com
Disclaimer:
There is a substantial risk of loss in futures trading. Past performance is not indicative of future results. Please trade only with risk capital. We are not responsible for any third-party links, comments, or content shared on TradingView. Any opinions, links, or messages posted by users on TradingView do not represent our views or recommendations. Please exercise your own judgment and due diligence when engaging with any external content or user commentary.
This video represents the opinion of Optimus Futures and is intended for educational purposes only. Chart interpretations are presented solely to illustrate objective technical concepts and should not be viewed as predictive of future market behavior. In our opinion, charts are analytical tools—not forecasting instruments. Market conditions are constantly evolving, and all trading decisions should be made independently, with careful consideration of individual risk tolerance and financial objectives.

xauusd sellsell xauusd
XAUUSD
idea order block active with high volume here
and it back to test it
OANDA:XAUUSD

ICICI Bank Futures: Eyes on the Reaction ZonePrice is approaching a high-confluence demand zone marked by:
1.50–61.8% Fibonacci retracement
2.Fair Value Gap (FVG)
This also aligns with sell-side liquidity below recent lows — a classic trap zone where smart money might accumulate before reversal.
Expectations:
⚡ Price may wick into this zone → react bullishly → run for buy-side liquidity near 1490.
Confirmation Needed:
Watch RSI reaction + CHoCH on LTF for entry triggers.

WEAK NFP EFFECTS FOR USA AND DOLLAR#NFP not as expected weakens dollar and shows weaker USA economy growth
Other Currencies and Gold Rising.
Big green candle at 6pm IST exactly when nfp data came
#EURUSD #XAUUSD #USEconomy
