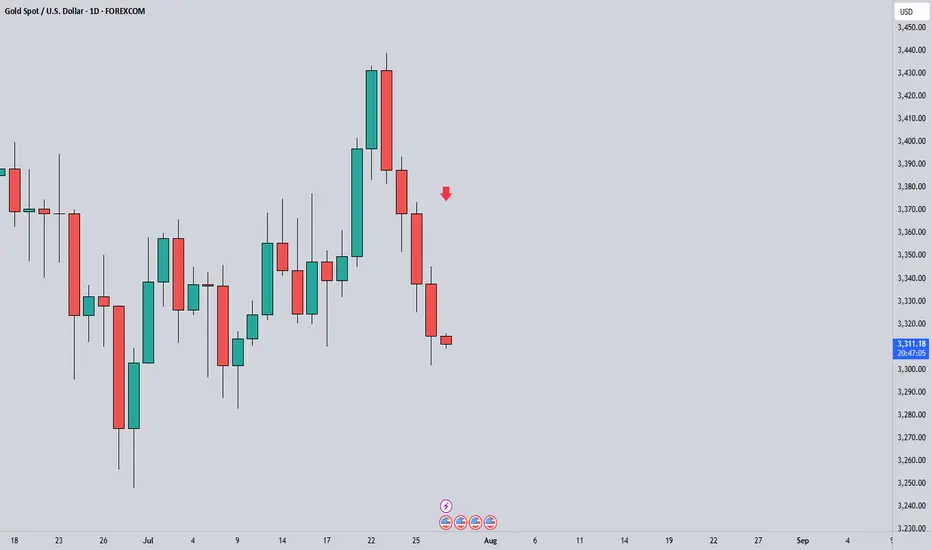
XAUUSD Short ProjectHi guys...😎
It's time to do a Short Project on XAUUSD with 3 key reasons:
1. Price Drivers: institutional shorting
2. Trend: down
3. Momentum: bearish
Action: waiting for entry on the intraday timeframe (entry will be published further)
Futures market
End of GOLD correction#GOLD #XAUUSD
UPDATE
As I mentioned earlier, gold was forming a contracting triangle.
The wave-(e) of the triangle has formed a double pattern diametric-X-triangle and has moved beyond my expectations (the post-pattern movement has passed ), breaking the trendline of (a)-(c). However, since it did not exceed the end of wave-(c), the contracting triangle has not been invalidated.
We expect gold to gradually rise from this range and surpass $3,500.
Good luck
NEoWave Chart

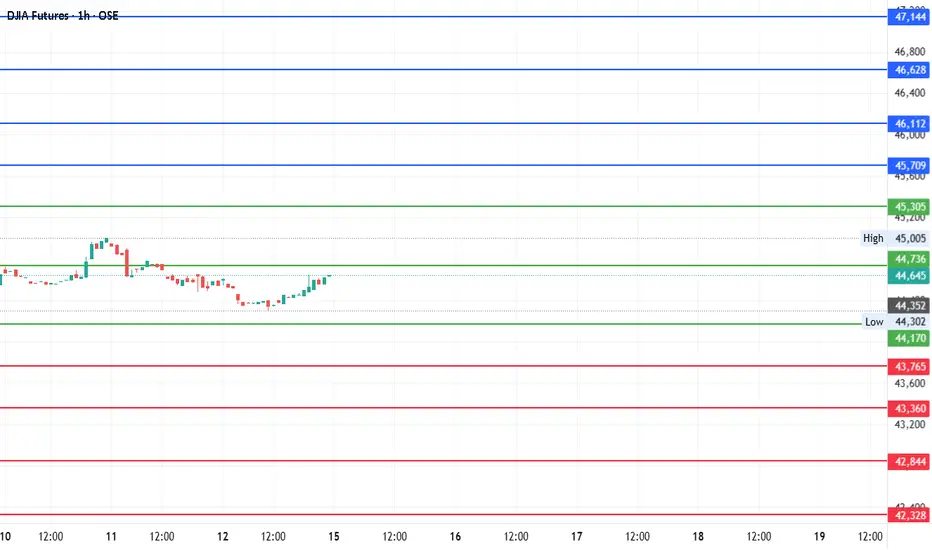
#DJI Futures Outlook: Key Levels to Watch Around Pivot 44,736Date: 14-07-2025
📊 Current Price: 44,645
📍 Pivot Point: 44,736.00
🔼 Upside / Bullish Scenario
If the price sustains above the pivot point (44,736), it could target the following resistance and bullish targets:
Immediate Resistance: 45,305.40
Target 1: 45,708.70
Target 2: 46,112.00
Target 3: 46,628.00
Target 4: 47,144.00
Bullish Bias Trigger: A break and hold above 45,305.40 increases confidence in these targets.
🔽 Downside / Bearish Scenario
If the price moves and holds below the pivot, the focus shifts to support levels and bearish targets:
Immediate Support: 44,170.04
Target 1: 43,765.02
Target 2: 43,360.00
Target 3: 42,844.00
Target 4: 42,328.00
Bearish Bias Trigger: A break below 44,170.04 opens the door to these downside levels.
#DowJones #TradingView #StockMarket #Investing #Trading #DJIFutures
#PivotPoints #DowJones #MarketOutlook #FuturesTrading
GOLD: Target Is Down! Short!
My dear friends,
Today we will analyse GOLD together☺️
The market is at an inflection zone and price has now reached an area around 3,353.10 where previous reversals or breakouts have occurred.And a price reaction that we are seeing on multiple timeframes here could signal the next move down so we can enter on confirmation, and target the next key level of 3,335.20..Stop-loss is recommended beyond the inflection zone.
❤️Sending you lots of Love and Hugs❤️

BITCOIN CME GAP IS FILLING RIGHT NOW!#Bitcoin CME Futures
Bitcoin is dipping — and all signs point to the CME gap getting filled.
Historically, these dips have been aggressively bought, so a strong bounce from here looks likely.


Gold weekly outlookFib Buy and Sell zones for the week ahead. Pay attention to a change in trend. Mondays are usually no trade days and just to watch the market decides.

XAUUSD
XAUUSD Updated in 30M :
The gold signal is marked on the chart based on the latest price changes and the supply and demand in the market. These points include the entry point, stop loss, and take profit.

Gold at Major Turning Point – Breakdown or Reversal Incoming?🔥 GOLD (XAU/USD) Daily Analysis – July 27, 2025
By: Asad Yaseen | Timeframe: 1D
Gold is currently positioned at a crucial turning point, and price action over the next few days will determine the medium-term direction. Here's a breakdown of all possible scenarios based on key supply-demand zones and institutional behaviour:
🔴 Scenario #01 – Bearish Bias Active (Confirmed Setup)
📉 Market Structure: Bearish
The current trend is clearly bearish, with no strong signs of reversal. Even if bullish patterns appear, they are likely just short-term retracements.
confirmed short target is 3302.
going long unless deeper zones show clear rejection.
🟢 Scenario #02 – Possible Bullish Rejection Zone
📍 Key Zone: 3194 – 3202
If the market tests and rejects this demand zone, a strong upside move is expected. This could mark the start of a rally toward 4000+, indicating a shift in macro sentiment.
A bullish rejection here would favour trend reversal trades.
⚫ Scenario #03 – Bearish Expansion Below Demand
📍 Breakdown Zone: 3122 – 3192
If price breaks below this zone with no rejection, expect a deeper drop. Targets are set between 2650 – 2560 in the coming days. Setup for swing or position traders waiting for clean continuation signals.
⚠️ Neutral Consolidation Warning
If price does not engage the 3194–3246 zone, expect sideways movement between 3370 – 3240 with low momentum.
📰 Fundamental Catalyst to Watch:
Expect major volatility after Jerome Powell’s FED Rate Cut announcement.
This news event may trigger massive liquidity shifts and trend-defining moves.
💡 Reminder for Traders:
Trade with structure, not emotions. Watch how price reacts at key levels and align with macro bias.
No confirmation = no trade.
📈 If you find this analysis helpful, don’t forget to like & follow for more high-probability setups.
Drop your thoughts or questions below 👇

XAUUSD – Strong Bullish Reversal from Key Support XAUUSD – Strong Bullish Reversal from Key Support
Chart Summary:
Gold (XAUUSD) has shown a clear reaction from a strong support zone near 3260, suggesting bullish momentum is gaining strength. The chart highlights multiple key market structure elements and confirms the potential for a bullish move.
Technical Highlights:
🔻 Strong Support Zone (3260–3280):
Price tapped into a well-defined demand zone with historical significance, initiating a bullish response.
🔺 Resistance Zone (3460+):
A strong resistance level lies ahead. This area may act as a potential target for bulls.
🔁 Break of Structure (BOS):
Multiple BOS marks on the chart indicate trend shifts and liquidity grabs. Most recent BOS aligns with potential reversal.
💹 Bullish Fair Value Gap (FVG):
A bullish FVG near mid-structure confirms institutional interest and adds confluence to the upside move.
📈 Target: 3,366.984 USD
Marked as the next probable short-term liquidity target. If momentum sustains, price may approach resistance above this.
Price Expectation:
If the current bullish momentum holds above the strong support zone, we may see a rally towards 3,366–3,400 USD.
This move could be driven by:
Buy-side liquidity grab above prior highs
Breakout traders entering above BOS
Reaction to macroeconomic calendar (highlighted on the chart)
✅ Educational Takeaway:
This is a textbook example of:
Support-resistance flip
Liquidity concepts (Buy-Side Liquidity)
Fair Value Gaps usage
Volume Profile confluence

XAUUSD Smart Money Technical Analysis – Bullish Potential XAUUSD Smart Money Technical Analysis – Bullish Potential from Strong Support
Gold (XAUUSD) is currently trading around $3,291.780, showing a potential bullish reversal setup from the strong support zone after a clear liquidity sweep and market structure shifts.
🔍 Key Technical Highlights:
✅ Strong Support Zone (Demand)
Price is reacting from a major demand zone (Strong Low) between $3,275 – $3,225, a level that previously triggered bullish rallies.
Multiple Breaks of Structure (BOS) and CHoCH indicate previous bullish control and a possible re-accumulation phase.
✅ CHoCH Near Support
A recent Change of Character (CHoCH) around the support area shows the first signs of smart money accumulation.
Liquidity below recent lows has been swept, triggering possible bullish intent.
✅ Bullish FVG (Fair Value Gap)
A clear Bullish FVG remains unmitigated around the mid-range, offering target confluence at $3,349.560.
Price may aim to rebalance inefficiency and fill the FVG as part of the bullish move.
✅ Resistance Zone Above
The resistance area near $3,325 – $3,350 acts as a short-term target for long positions.
Further resistance lies at the Buy-Side Liquidity & Weak High zone around $3,450 if momentum sustains.
🧠 Smart Money Concept Interpretation:
Liquidity Grab: Price dipped into strong demand to collect sell-side liquidity before potential reversal.
CHoCH + BOS Alignment: Indicates the market may now transition into a bullish phase.
FVG as Magnet: Price is drawn toward unfilled value zones—ideal for bullish target projection.
🎯 Trade Idea (Educational Purposes Only):
Bias: Bullish
Entry: Around current zone ($3,290)
Target: $3,349.560 (FVG zone)
Invalidation/SL: Below strong low (~$3,225)

Gold Rejected 3280… What’s Next?Price tapped into the key demand zone and bounced hard—exactly what we wanted to see.
Now the question is.
Is Gold ready to reclaim the highs?

Possible Gold Reaction Scenarios to Today's Jobs ReportMarket expectations for today's nonfarm payrolls change to be 104k, with the unemployment rate projected to rise to 4.2% from 4.1%. The divergence between payroll growth and the unemployment rate is mainly due to the birth-death model used in payroll calculations and expectations for either a halt or rebound in the labor force participation rate.
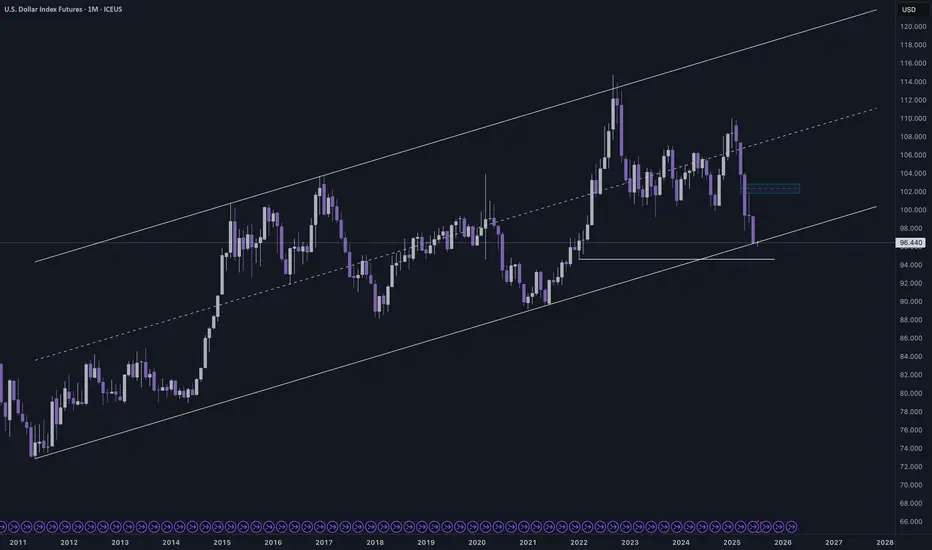
Fed Chair Powell recently stated that the "main number to watch" is the unemployment rate, which raises its importance in today’s data release. If the participation rate rises sharply, the unemployment rate could even increase to 4.3%, which may put a cap on the recent rally in the dollar index.
There is also a risk that a very strong payrolls number could be released alongside a rise in the unemployment rate. This combination may trigger a volatile and uncertain market reaction with multiple direction changes.
In similar past scenarios, markets typically reacted first to the payrolls data, then shifted focus to the unemployment rate shortly after.
For gold, look for 3310 and 3288 as pivot levels that could open the door to 3342 on the bullish case and 3270 on the bearish case.

Closing all my orders in profits I mentioned throughout Today's commentary session:
My strategy is still the same – i took buy from 3290-3294
Very happy with the profits so far.
My medium-term targets remain 3335-3345 which is achieved 300 pips achieved alhumdullilah.
All I say thanks to those who followed us and made profits.
Gold Market Rejected at 3310 as Bearish Channel HoldsGold market faced rejection at 3310, failing to break above the bearish channel, as DXY strength continues to weigh on price action. The inability to sustain above key levels reflects ongoing bearish pressure, unless a clear break occurs.
🔍 Key Insight:
3310 acts as a short-term ceiling
DXY strength supports the bearish stance, follow for more insights coment and boost idea .


Gold is now buy position 40 to 50 pipsGold is now buy position 40 to 50 pips
If you wanted to learn about this analysis system fell free contrect with me .

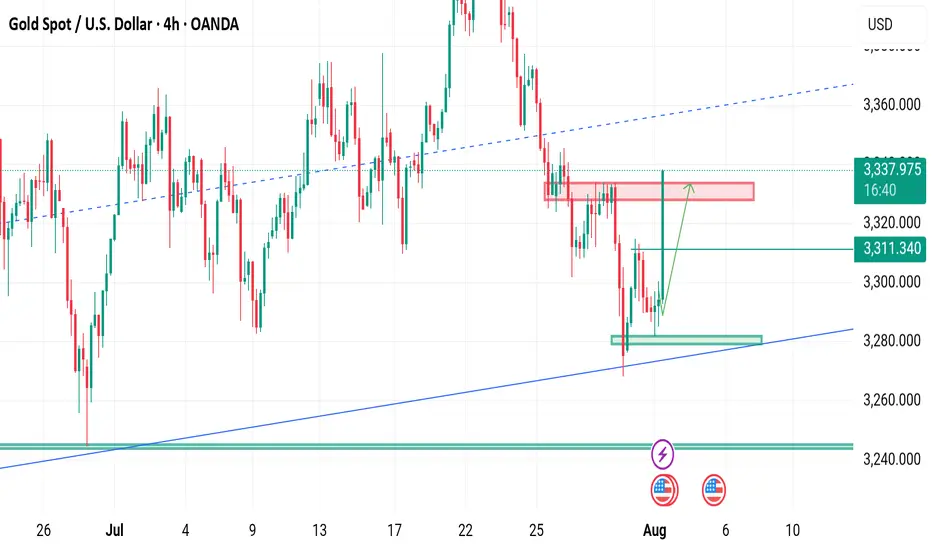
Bearish Sentiment For GoldGold breaks daily trendline leaving a bearish engulfing pattern last Wednesday July 30, Expecting the price go down for correction. In my opinion, Gold will be BEARISH this coming August up to October. This is just my theory.
GOLD/SILVER RATIO TESTING CHANNEL BOUNDARYReasonable chance for ratio to turn lower here i.e. Silver to outperform Gold on a retracement. However, close to breaking the channel i.e. all collapses, Silver tanks.

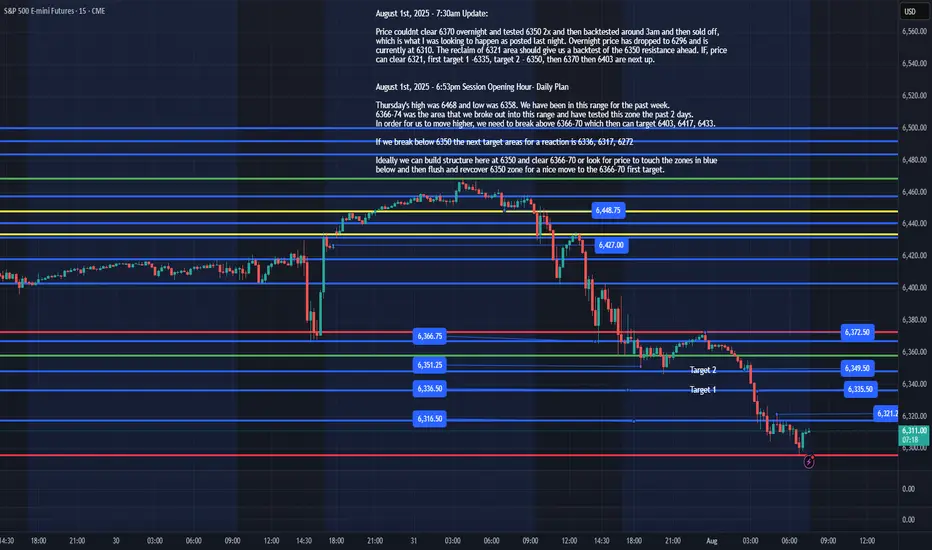
ES - August 1st Daily Plan Update - 7:35amAugust 1st, 2025 - 7:35am Update:
Price couldn't clear 6370 overnight and tested 6350 2x and then back tested around 3am and then sold off, which is what I was looking to happen as posted last night. Overnight price has dropped to 6296 and is currently at 6310. The reclaim of 6321 area should give us a back test of the 6350 resistances ahead. IF, price can clear 6321, first target 1 -6335, target 2 - 6350, then 6370 then 6403 are next up.
IF, we lose 6296, we would want to see a reclaim of it to enter a trade. IF, ES sells off today, better to get out the way and wait for price to reclaim 6296.
August 1st, 2025 - 6:53pm Session Opening Hour- Daily Plan
Thursday's high was 6468 and low was 6358. We have been in this range for the past week.
6366-74 was the area that we broke out into this range and have tested this zone the past 2 days.
In order for us to move higher, we need to break above 6366-70 which then can target 6403, 6417, 6433.
If we break below 6350 the next target areas for a reaction is 6336, 6317, 6272
Ideally, we can build structure here at 6350 and clear 6366-70 or look for price to touch the zones in blue below and then flush and recover 6350 zone for a nice move to the 6366-70 first target.
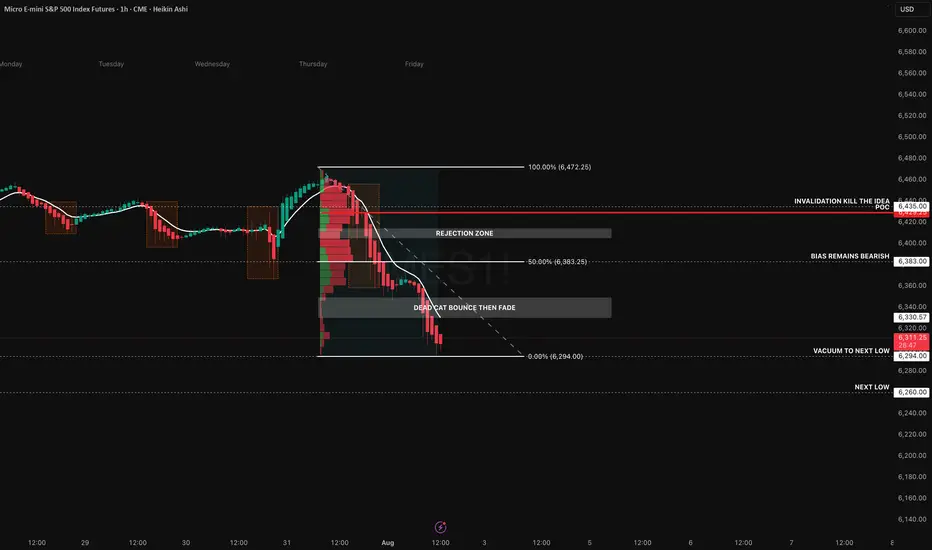
Structure Says Short… But Will News Flip the Script?Price continues to unwind following Thursday’s distribution, where we saw clear seller control above the 6420–6430 zone. Heikin Ashi candles show strong trend conviction with no upper wicks, and the EMA stack remains fully bearish. We're now pressing into the 0% Fibonacci extension at 6294, with the next low sitting around 6260 a clean vacuum zone that could fill quickly if the trend accelerates.
The volume profile from the breakdown range highlights 6429.25 as the point of control, acting as our primary rejection zone. Any pop into the 6383–6420 area will likely meet resistance. That’s our “dead cat bounce then fade” zone a textbook retracement rejection setup. Unless we reclaim 6435+ with conviction, the short bias remains intact.
We’re already short from 6306, targeting 6260. Stops are invalidated on a strong reclaim above the 6435 level.
However, today brings serious macro risk:
Trump has announced sweeping new tariffs on 92 countries, including 35% on Canada and 39% on Switzerland, triggering equity market anxiety. These surprise trade actions could cause intraday spikes or violent reversals, especially if retaliatory news drops intraday.
Amazon’s Q2 earnings missed cloud revenue expectations, putting pressure on tech futures.
U.S. Non farm Payrolls (NFP) are due at 8:30 AM ET, with expectations at +110K and unemployment ticking up to 4.2%. A strong jobs print could derail September rate cut hopes and add fuel to downside continuation or completely reverse sentiment.
We’re aware of this news risk and will adjust intraday. No stubborn bias here. But structurally, price is still in a trend, and this setup favours continuation unless macro flips the table.
My Setup Summary:
- Bias: Bearish (Trend Continuation)
- Entry: 6306 (Short)
- Target: 6260
- Invalidation: 6435 reclaim
- Confluence: POC rejection, Fib retrace, bearish EMAs, weak retrace structure
- News Risk: Tariffs, Amazon earnings miss, NFP at 8:30 AM ET
Good luck today and hope that we end the week profitable.