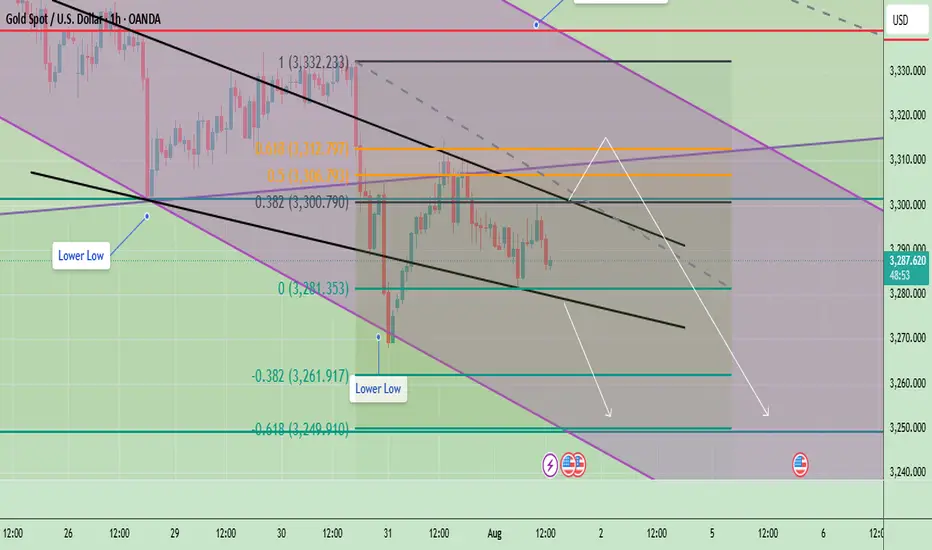
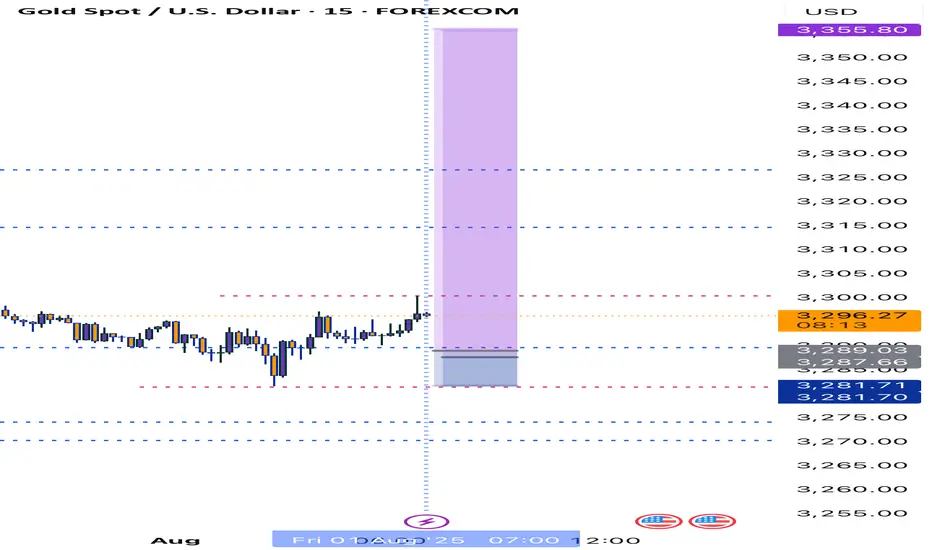
BULLISH THEN BEARISH AFTER HITTING PRZExpecting the news momentum for NFP to push the market into PRZ before a sudden fall into 38.2 and 61.8 fib levels
Futures market


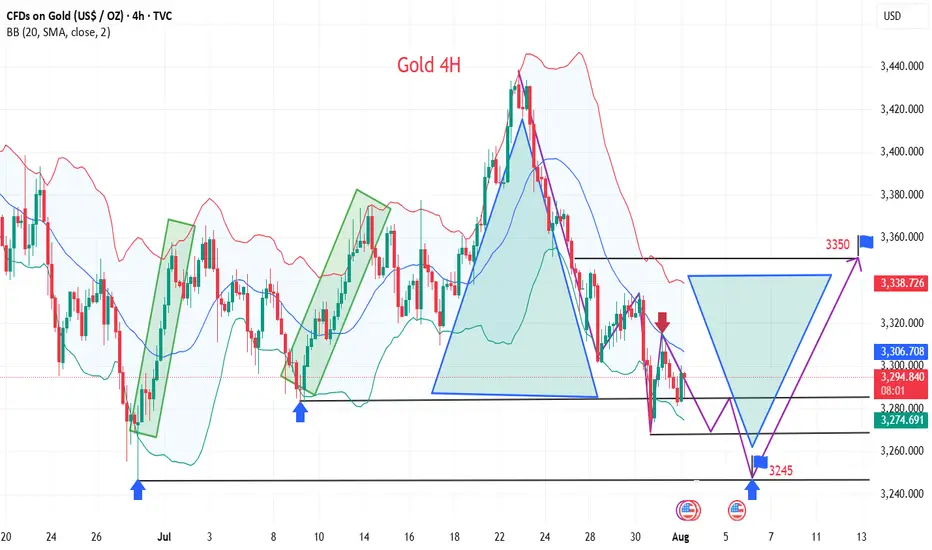
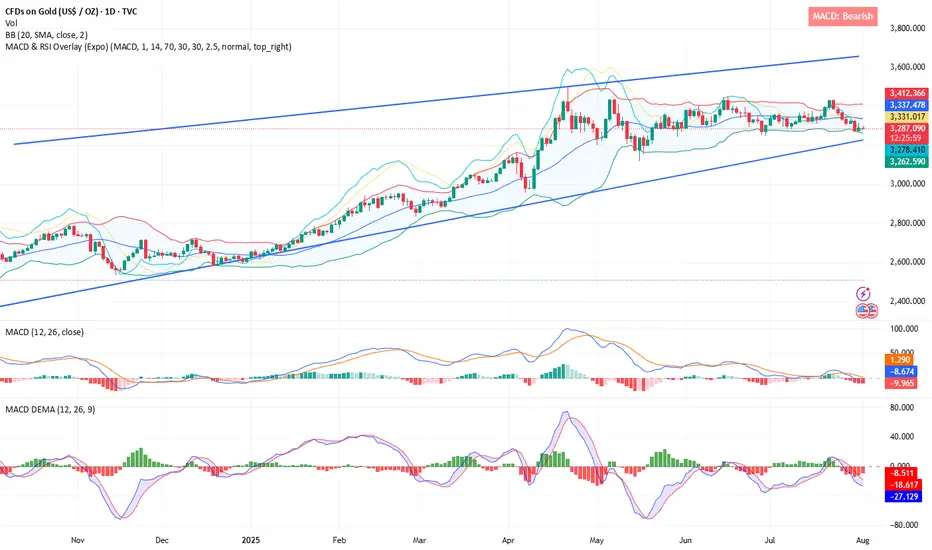
Gold’s Glitter Fades: Why $3,250 Is the Next Big Drop🧠 Fundamental Analysis
Despite recent bullish momentum, several macroeconomic and policy-driven headwinds could pressure gold prices lower toward the $3,250 mark:
1. **Fed Policy Shifts (Higher for Longer):**
The Fed’s persistent “higher-for-longer” stance on interest rates has kept real yields elevated. With the U.S. economy still showing resilience (strong labor market, consumer spending), markets are pricing out aggressive rate cuts. Higher real yields reduce gold’s appeal as a non-yielding asset.
2. **Strengthening U.S. Dollar (DXY):**
Renewed dollar strength, driven by global risk aversion and higher U.S. yields, is acting as a headwind for gold. Since gold is priced in dollars, a rising DXY typically puts downward pressure on bullion.
3. **China & India Demand Weakness:**
Physical gold demand in key markets like China and India has been softening. High local prices, subdued consumer sentiment, and tighter liquidity conditions in China are dampening jewelry and investment demand.
4. **Geopolitical Easing:**
As geopolitical tensions (e.g., Middle East or Ukraine) show signs of stabilization, the fear premium embedded in gold could start to unwind.
---
## 📉 Technical Analysis – Bearish Setup to $3,250
From a chartist’s view, gold shows early signs of technical exhaustion and potential reversal:
1. **Rising Wedge Breakdown:**
Gold recently broke down from a **rising wedge pattern** on the daily timeframe—a classic bearish continuation setup. Price failed to hold the breakout above \$2,450 and is now forming lower highs.
2. **Bearish Divergence (RSI & MACD):**
Both RSI and MACD are flashing **bearish divergence** on the weekly chart. While price made new highs, momentum indicators did not confirm—suggesting weakening buying pressure.
3. **Fibonacci Retracement Targets:**
A pullback toward the **50% retracement** of the March–July rally aligns closely with the \$3,250 level. This would be a logical technical correction zone.
4. **Volume Profile Gaps:**
The VPVR (Volume Profile Visible Range) shows a low-volume node around $3,250, implying weak support. If price breaches the $3,400 psychological level, a swift drop to $3,250 is plausible.
5. **Elliott Wave Perspective:**
If the recent top was wave 5 of a larger impulsive structure, we may now be entering an **ABC corrective wave**, with Wave C potentially targeting the $3,250 area.
---
## 📍 Key Levels to Watch
* **Resistance:** $3,420 $3,500
* **Support:** $3,400 → $3,250 → $3,000
* **Trigger Point:** Break below $3,400 with volume confirmation
---
## 📊 Strategy Notes
* **Short Bias**: Watching for rallies to short near \$3,400–\$3,450 with tight stops.
* **Risk Management**: Be cautious around key macro events (NFP, CPI, FOMC).
* **Confluence is Key**: Look for alignment between macro headwinds and chart setups.
---
📌 **Conclusion:**
While gold’s long-term bull thesis remains intact, a medium-term correction to $3,250 appears increasingly likely due to weakening fundamentals, overbought technical conditions, and waning momentum. Traders should prepare for volatility and focus on disciplined execution around key support zones.

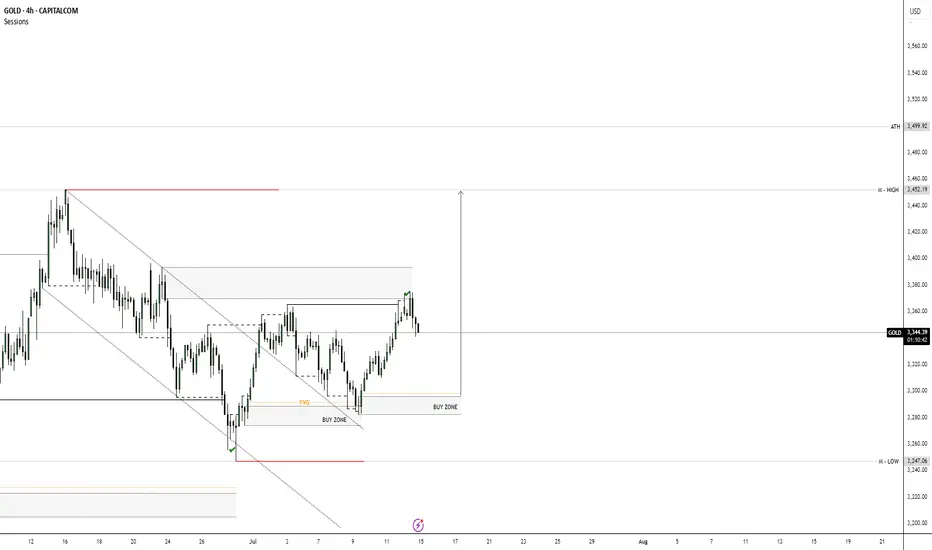
XAUUSD ANALYSYS 💸GOLD💸
Market Outlook: Bullish
• Price broke out of a downtrend channel and is now forming higher highs and higher lows — clear sign of a trend reversal.
• Current move is a pullback after a strong push up.
⸻
📍 Key Zones:
• Buy Zones and Fair Value Gaps (FVGs) are marked.
• These are areas where buyers may step in again.
• Price is pulling back into these zones — potential long entry area.
⸻
🎯 Target:
• The top red line marks a liquidity zone or resistance.
• Price is likely aiming to reach this area next.
⸻
📈 Trade Setup Idea:
• Buy on pullback to the FVG / Buy Zone.
• Stop Loss: Below the Buy Zone.
• Take Profit: At the previous high (resistance zone).
⸻
⚠️ Risk to Watch:
• If price breaks below the Buy Zone, bullish setup is invalidated — wait for new structure.
Gold non-farm payroll layout strategy
💡Message Strategy
Gold prices (XAU/USD) remained under pressure in Asian trading on Friday, trading below $3,300, not far from the January low reached earlier this week. Gold failed to extend its modest overnight rebound, primarily due to the strong US dollar.
The Federal Reserve's latest hawkish tone has prompted a reassessment of the timeline for interest rate cuts, boosting demand for the US dollar and weighing on the non-interest-bearing asset of gold.
The US dollar index rose for the seventh consecutive day, reaching a new high since late May, further weakening gold's appeal. Key to driving the dollar was the latest inflation data: the US PCE price index rose to 2.6% year-on-year in June, while the core index remained stable at 2.8%, exceeding market expectations and reinforcing the view that inflation is persistent.
The U.S. July non-farm payroll report, due on Friday, is seen as a key indicator for assessing economic resilience and the outlook for interest rates. It is expected that employment will increase by 110,000 and the unemployment rate will rise slightly to 4.2%.
📊Technical aspects
From the current technical perspective:
1: The technical pattern suggests a weak rebound and weak continuation.
2: The weak sideways trend is expected to trigger a third phase of bottoming out, stimulated by data.
To summarize: Technically, based on the data, the pattern suggests a downward trend, driven by negative data, leading to a bottoming-out and rebound. Therefore, caution must be exercised against this type of bottoming-out and rebound after the data has been released.
💰Strategy Package
Strategy: Fall first, then rise
Short Position:3310-3315,SL:3325,Target: 3245-3250
Long Position:3240-3250,SL:3220,Target: 3300-3320
XAU/USD 01 August 2025 Intraday AnalysisH4 Analysis:
-> Swing: Bullish.
-> Internal: Bullish.
You will note that price has targeted weak internal high on three separate occasions which has now formed a triple top, this is a bearish reversal pattern and proving this zone is a strong supply level. This is in-line with HTF bearish pullback phase.
Remainder of analysis and bias remains the same as analysis dated 23 April 2025.
Price has now printed a bearish CHoCH according to my analysis yesterday.
Price is now trading within an established internal range.
Intraday Expectation:
Price to trade down to either discount of internal 50% EQ, or H4 demand zone before targeting weak internal high priced at 3,500.200.
Note:
The Federal Reserve’s sustained dovish stance, coupled with ongoing geopolitical uncertainties, is likely to prolong heightened volatility in the gold market. Given this elevated risk environment, traders should exercise caution and recalibrate risk management strategies to navigate potential price fluctuations effectively.
Additionally, gold pricing remains sensitive to broader macroeconomic developments, including policy decisions under President Trump. Shifts in geopolitical strategy and economic directives could further amplify uncertainty, contributing to market repricing dynamics.
H4 Chart:
M15 Analysis:
-> Swing: Bullish.
-> Internal: Bullish.
H4 Timeframe - Price has failed to target weak internal high, therefore, it would not be unrealistic if price printed a bearish iBOS.
The remainder of my analysis shall remain the same as analysis dated 13 June 2025, apart from target price.
As per my analysis dated 22 May 2025 whereby I mentioned price can be seen to be reacting at discount of 50% EQ on H4 timeframe, therefore, it is a viable alternative that price could potentially print a bullish iBOS on M15 timeframe despite internal structure being bearish.
Price has printed a bullish iBOS followed by a bearish CHoCH, which indicates, but does not confirm, bearish pullback phase initiation. I will however continue to monitor, with respect to depth of pullback.
Intraday Expectation:
Price to continue bearish, react at either M15 supply zone, or discount of 50% internal EQ before targeting weak internal high priced at 3,451.375.
Note:
Gold remains highly volatile amid the Federal Reserve's continued dovish stance, persistent and escalating geopolitical uncertainties. Traders should implement robust risk management strategies and remain vigilant, as price swings may become more pronounced in this elevated volatility environment.
Additionally, President Trump’s recent tariff announcements are expected to further amplify market turbulence, potentially triggering sharp price fluctuations and whipsaws.
M15 Chart:

Wedge Pattern: A Key to Trend Reversals and Continuations📈 Wedge Pattern: A Key to Trend Reversals and Continuations
A wedge pattern is a technical chart formation that signals a potential reversal or continuation in the market. It’s formed when price moves between two converging trendlines — either sloping upward or downward — creating a narrowing range over time.
There are two main types of wedge patterns:
🔻 Falling Wedge (Bullish)
Formed during a downtrend or as a correction in an uptrend.
Characterized by lower highs and lower lows, with the slope of the support line steeper than the resistance line.
Typically signals a bullish reversal as momentum builds for a breakout to the upside.
✅ Confirmation: Break above the resistance line with volume surge.
🔺 Rising Wedge (Bearish)
Appears during an uptrend or as a correction in a downtrend.
Shows higher highs and higher lows, but the support line is steeper than the resistance line.
Often leads to a bearish reversal, especially when volume declines into the pattern.
⚠️ Confirmation: Break below the support line with increasing volume.
🧠 Key Characteristics
Volume tends to decrease as the pattern forms, indicating a pause in momentum.
The breakout direction (up or down) determines whether it’s a continuation or reversal signal.
Wedges can appear on any time frame and are useful for both day traders and long-term investors.
📊 Trading Tip
Always wait for confirmation of the breakout before entering a trade. False breakouts can be common, especially in low-volume environments

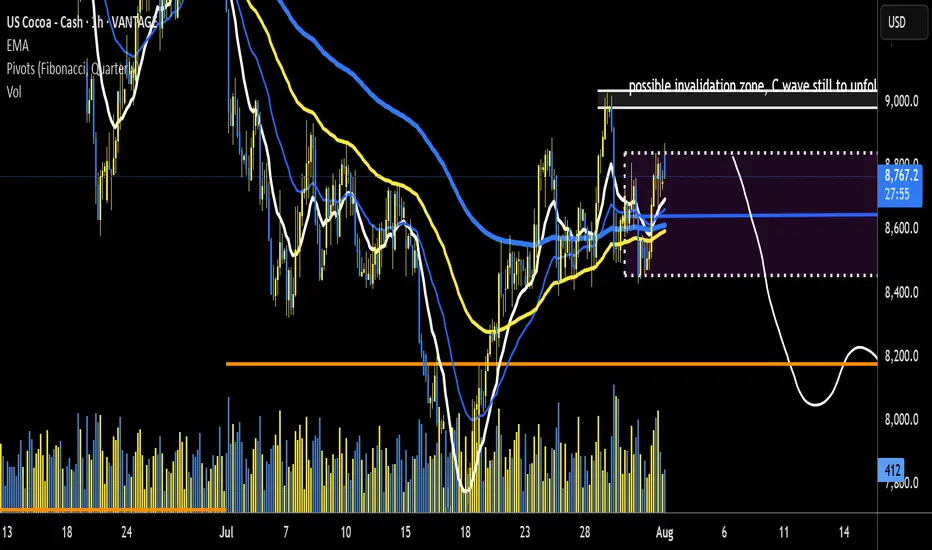
US Coco potential leg downRoad map laid. impulsive wave down - looking for entry signal and SL zone 15 and 5 min chart. a break of recent highs a good zone for SL a break above SL ZONE is possibly C in ABC structure unfolding. could imply even higher on cards. current risk ratio of min 1:5 ROI.
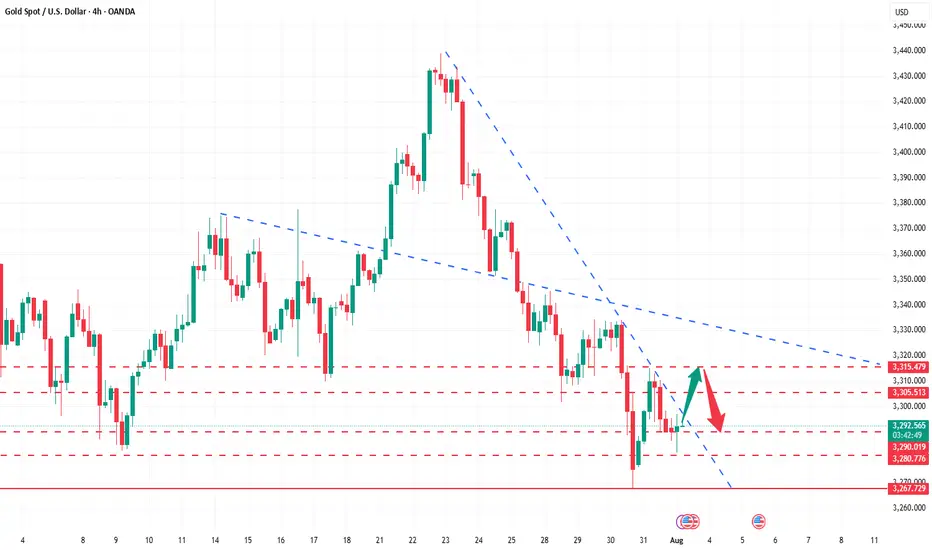
Sell now or the bounce from resistanceIm planning to sell either at the yellow line, (waiting for confirmation) , or if the price goes all the way to to my sell zone

How to correctly grasp the gold trading opportunities?Yesterday, gold prices saw a technical rally amidst volatile trading, followed by a downward trend under pressure. Bulls strongly supported a rebound at 3280 in the Asian session. The European session saw an accelerated upward move, breaking through 3314 before retreating under pressure. We also precisely positioned short positions below 3315, achieving a perfect target of 3290-3295. During the US session, the market again faced pressure at 3311, weakening in a volatile trend before breaking through 3300. The daily chart ultimately closed with a medium-sized bullish candlestick pattern, followed by a pullback and then a decline.
Overall, after yesterday's rebound, gold prices remain under pressure at the key resistance level of 3314. The short-term bearish weakness line has moved down to this level. If pressure continues in this area in the short term, gold will maintain a weak and volatile structure, with intraday trading remaining focused on rebounds and upward moves. If you are currently experiencing confusion or unsatisfactory trading strategies, please feel free to discuss your options and help avoid investment pitfalls.
From a 4-hour analysis perspective, focus on resistance at 3305-3315 on the upside. A rebound to this level is a good opportunity to short against resistance. Focus on support at 3280-3270 on the downside. Unless the price stabilizes strongly, consider not entering long positions below this level. The overall strategy remains to short on rebounds, with the same rhythm. I will provide timely notifications of specific levels from the bottom, so keep an eye on them.
Gold Trading Strategy: Short on rebounds near 3305-3315, with targets at 3290-3280-3270.
Waiting for non-farm payroll dataGold prices (XAU/USD) remained under pressure in Asian trading on Friday, trading below $3,300, not far from the January low reached earlier this week. Gold failed to extend its modest overnight rebound, primarily due to the strong US dollar.
The Federal Reserve's latest hawkish tone has prompted a reassessment of the timeline for interest rate cuts, boosting demand for the US dollar and weighing on the non-interest-bearing asset, gold.
The US dollar index rose for the seventh consecutive day, reaching a new high since late May, further weakening gold's appeal. Key to the dollar's momentum lies in the latest inflation data: the US PCE price index rose to 2.6% year-on-year in June, while the core index remained stable at 2.8%, exceeding market expectations and reinforcing the view of persistent inflation.
"Both inflation data and GDP data suggest the US economy remains resilient, giving the Fed little reason to rush into easing," said a Fed observer. "This limits gold's near-term potential as a hedge."
Meanwhile, US President Trump signed an executive order on Thursday imposing import tariffs ranging from 10% to 41% on several trading partners, including Asian countries. Countries with trade deficits will face tariffs of at least 15%. This move has heightened global trade concerns, boosted market demand for safe-haven assets, and provided some support for gold.
Despite this, gold prices remain mired in a downward trend. Investors are generally maintaining a wait-and-see approach, awaiting Friday's release of the US July non-farm payroll report. This data is seen as a key indicator of economic resilience and the interest rate outlook. Expectations suggest an increase of 110,000 jobs and a slight rise in the unemployment rate to 4.2%.
The daily gold chart shows that prices are in a weak consolidation phase, capped by key resistance near $3,320. If gold prices fail to break through this area, there is a risk of further decline in the short term. Stronger resistance lies above $3,350. A breakout on strong volume could trigger a rebound towards the $3,380 area, potentially pushing the price above $3,400.
As for downside support, the 100-day moving average provides initial support near $3,270. A break below this could trigger further downward pressure, targeting the $3,240 area, the June low. A further break below this level would target the psychologically important $3,200 level.
In terms of indicators, the MACD death cross continues, with a shortening red bar, indicating weakening bearish momentum but no reversal. The RSI remains in neutral to weak territory, not clearly oversold.
The current gold trend is characterized by a "structurally bearish, sentimentally supportive" pattern. Despite the trade war and heightened global risk aversion, the Federal Reserve's caution about inflation and the strong dollar are exerting significant pressure.
If the July non-farm payroll data is strong, gold could test further technical support. Conversely, weak data or a pullback in the dollar could trigger a technical rebound. PEPPERSTONE:XAUUSD ACTIVTRADES:GOLD VANTAGE:XAUUSD FOREXCOM:GOLD EIGHTCAP:XAUUSD FOREXCOM:GOLD
Gold on NFP : Bearish OutlookGold is moving on fundamentals. Technical also validates the fundamental changes in market.
This week’s Fundamental developments:
• FED kept interest rates un changed: Bearish for Gold
• Trade/tariff war seems to settle Down: Bearish for Gold.
• US GDP Results Positive: Bearish for Gold
• Inflation: Results High inflation in US: Bearish for Gold.
Now today on Friday we have US Nonfarm payroll announcement. If the NFP also comes positive. It will add more fuel in dollar buying and DXY bullish chart will add more bullish candles.
Technicals:
Price structure is bearish with Head and shoulders structure at top.
We are having bearish death cross on Daily chart. Last day daily candle present rejection of 3300 level. Lower chart show multiple rejections near 3300 level.
In such a case I see price testing 3250 & When price breaks it 3200 on horizon.
As of current 100 DMA is defending the Bulls at 3270.
Chart says the rest. Good Luck !

Gold Price Consolidates in Symmetrical Triangle, Breakout Ahead?Gold shows a clear bearish trend within a well-defined downward channel. Price action continues to form lower highs and lower lows, reinforcing the ongoing downtrend. The recent rejection from $3,312 suggests that bulls are struggling to regain control, and the market remains pressured by selling momentum. The price is currently hovering near $3,287 just above horizontal support zone.
📉 Potential Scenarios
- Bearish Continuation (Most Likely)
- If price continues to stay below $3,300 and breaks below $3,281, it may aim for $3,261 and $3,249.
- A close below $3,281 would confirm further bearish pressure and signal downside continuation toward the $3,240s range.
- Short-Term Bullish Retracement
- If price holds above $3,281 and breaks above $3,300–$3,312, a relief rally may occur at first resistance: $3,306 and second resistance: $3,312.
- However, unless gold breaks above $3,332 (previous swing high), this would still be considered a bear market rally.
- Range-bound Movement
- A third scenario is sideways price action between $3,281 and $3,312, where neither bulls nor bears take control immediately. This would represent market indecision or awaiting external catalysts (e.g., economic data, Fed policy).
🔍 Trend Outlook
- Short-Term Trend: Bearish
- Medium-Term Trend: Bearish, unless price breaks and sustains above $3,312
- Long-Term Trend: Neutral-to-bullish, as long as price holds above the macro support zone near $3,240
1D Chart Long Term Possible Scenario
The price is currently trading around $3,285, sitting just above the triangle’s ascending trendline support and within a key horizontal demand zone around $3,250–$3,300, which has held multiple times in the past.
If bulls manage to push the price above $3,360–$3,400, it could confirm a breakout and open the door toward the next major resistance at $3,450. However, if price fails to hold above the current ascending trendline, a breakdown could retest the base support near $3,248 or even lower toward $3,150
Gold is currently in a neutral consolidation phase within a symmetrical triangle, with both bullish and bearish breakout scenarios possible. The breakout direction from this pattern—expected in the coming weeks, will likely set the tone for gold's medium-term trend.
Note
Please risk management in trading is a Key so use your money accordingly. If you like the idea then please like and boost. Thank you and Good Luck!
a retest sell setup idea for xauusd quick move. This setup ideas is price retesting previous lev and giving sellers the signal to sell with candle stick confirmations,
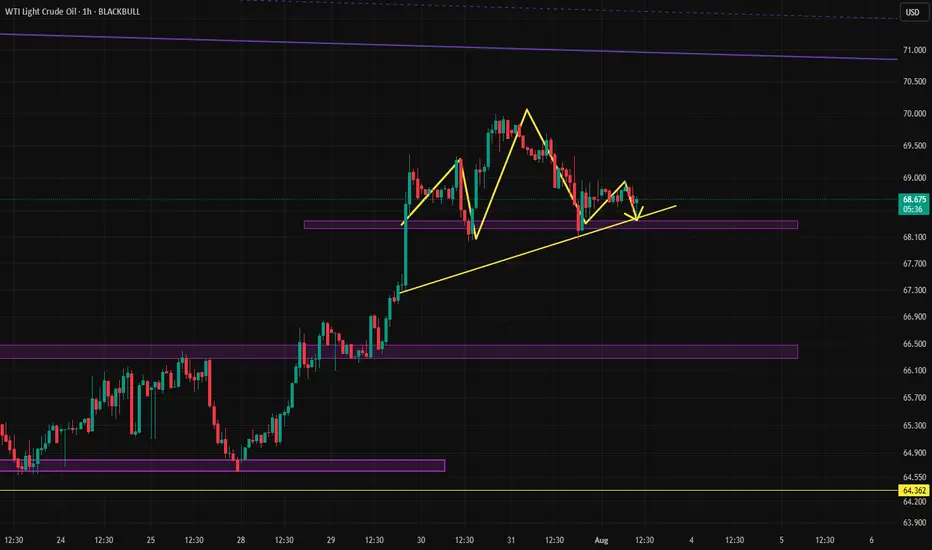
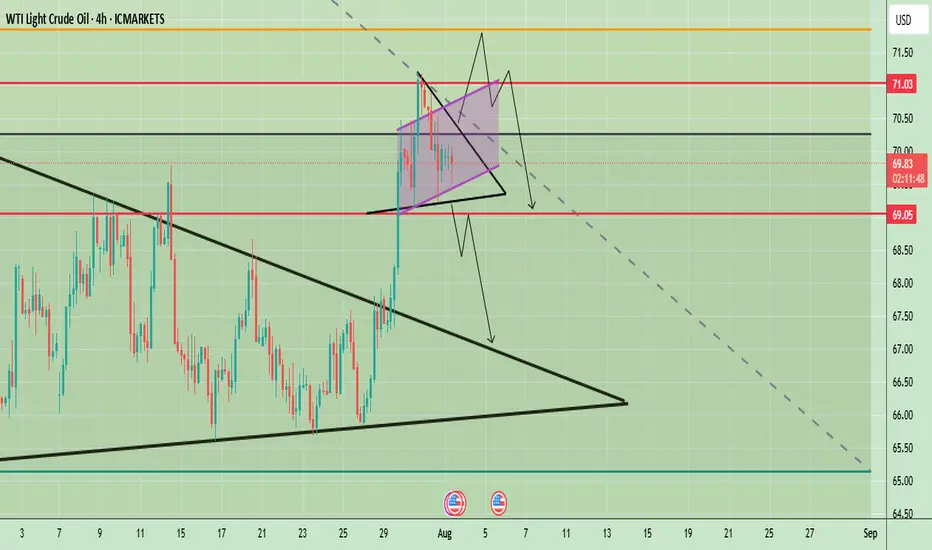
Activation of the head and shoulders pattern?Oil has formed a clean head and shoulders pattern, which, if activated, could lead the price to drop to 67.125. However, if the pattern fails and turns out to be a fakeout, we can expect the price to rise toward the \$71 area.
WTI Crude Oil Technical Outlook – Key Breakout or BreakdownWTI Crude Oil 4-hour chart suggests a potential inflection point after a strong bullish breakout from a larger symmetrical triangle pattern in late July. The price surged past key resistance levels and is now consolidating in a smaller symmetrical triangle formation just below the psychological $70 mark. This indicates a phase of indecision following a strong move, with market participants awaiting further confirmation.
Price is currently hovering around $69.82, with key levels marked at $71.03 (resistance) and $69.05 (support). The short-term price action within the tight triangle could determine the next move, with both bullish continuation and bearish reversal scenarios on the table.
Prices remain supported by supply concerns after Trump threatened to impose 100% secondary tariffs on buyers of Russian crude and warned China, a major oil consumer of severe penalties if it continues its purchases of Russian oil.
🔍 Potential Scenarios
- Bullish Breakout Scenario
If price breaks out of the smaller symmetrical triangle to the upside and clears the $70 resistance level with strong momentum, it may quickly test the $71.03 zone. A clean break above $71.03 would confirm the continuation of the previous uptrend, potentially opening room toward $72.50 and beyond in the medium term. The pattern would resemble a bullish pennant — a continuation pattern following the late July rally.
-Bearish Rejection and Breakdown
Conversely, a failure to sustain above $70 followed by a break below the lower boundary of the smaller triangle could lead to a sharper decline. The first critical level to watch would be $69.05; a break below this would likely invalidate the bullish setup and initiate a retest of the previously broken upper trendline of the larger triangle near $67.50. A further breakdown could lead price towards the larger support zone around $65–$66.
📈 Trend Outlook
- Short-Term: Neutral to Bullish — Consolidation in a smaller symmetrical triangle suggests a pause before continuation. However, the structure is still technically bullish unless $69.05 is broken.
- Medium-Term: Bullish Bias — The breakout from the large symmetrical triangle in late July indicates a shift in market sentiment, favoring higher prices unless the price fails to hold above $67.50.
- Long-Term: Cautiously Bullish — As long as WTI holds above the $65–$66 structural support area, the longer-term outlook remains constructive.
Note
Please risk management in trading is a Key so use your money accordingly. If you like the idea then please like and boost. Thank you and Good Luck!
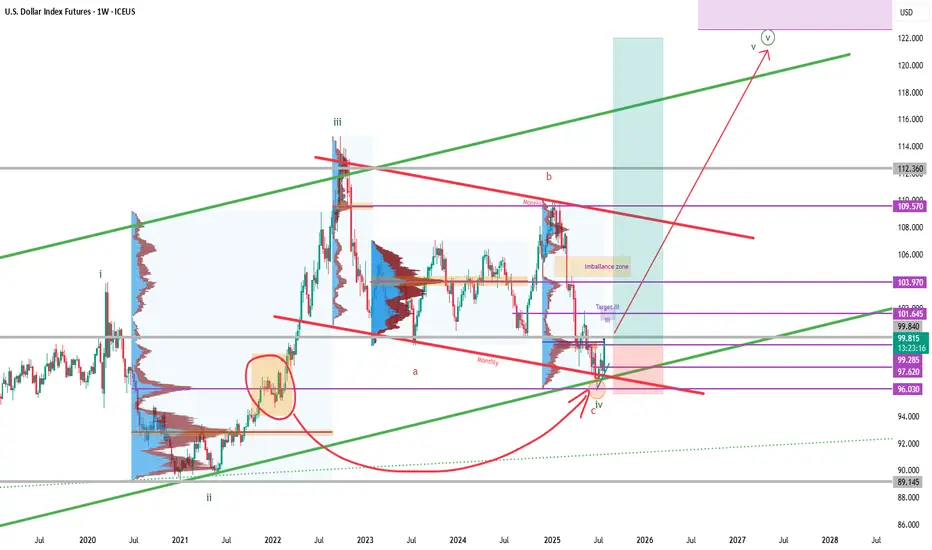
DXY - Dollar Index - Potenzial New Long phase
As we see in the chart .. in 2022 december we had a big volume accumulation before the october 2022 top to 112
After that we had a rebound and a laterality from sep. 22 to july 25.
In this moment we touche this volume and from my point of view we completed an ABC pattern.
Probably we have completed the pattern with a final Impulsive wave C and in this moment we start the final LONG wave 5
USOIL WTIWest Texas Intermediate (WTI) oil is a major benchmark for crude oil pricing, known for its high quality—being both light and sweet due to its low sulfur content and low density. WTI is sourced primarily from inland Texas and is the underlying commodity for oil futures traded on the New York Mercantile Exchange (NYMEX). The main physical delivery point is Cushing, Oklahoma, a critical U.S. oil storage and trading hub.
Current Price (as of August 1, 2025)
WTI crude oil is trading around $69.15–$69.36 per barrel.
Recently, WTI prices have seen volatility due to global economic factors, including U.S. tariffs, OPEC+ production, and shifts in oil demand. Despite a small decline on the day, oil prices have posted their strongest weekly performance since June, rising over 6% for the week.
Market and Outlook
Recent price movement reflects concerns about global trade tensions, new tariffs, and their impact on economic growth and energy demand. At the same time, supply risks remain due to geopolitical factors such as potential sanctions on Russian oil and U.S.-China trade developments.
Analyst forecasts for the remainder of 2025 suggest continued volatility, with WTI potentially ranging between $56 and $73 per barrel, influenced by demand, OPEC+ decisions, and geopolitical events.
Quick Facts Table
Feature Detail
Type Light, sweet crude
Benchmark NYMEX (U.S.), major global reference
Main Delivery Point Cushing, Oklahoma
Latest Price (Aug 1, 2025) $69.15–$69.36 per barrel
Typical Drivers U.S. tariffs, OPEC+ decisions, trade policy, supply risks, global demand
WTI oil plays a central role in global energy markets, serving as a benchmark for North American and international oil pricing. Its price reflects both supply fundamentals and broader macroeconomic and geopolitical developments.
#OIL #WTI

BuyLondon Session
Daily Volume
Untapped Zone
Market Structure
NT:: Limit order must be tapped before the breach of the red line
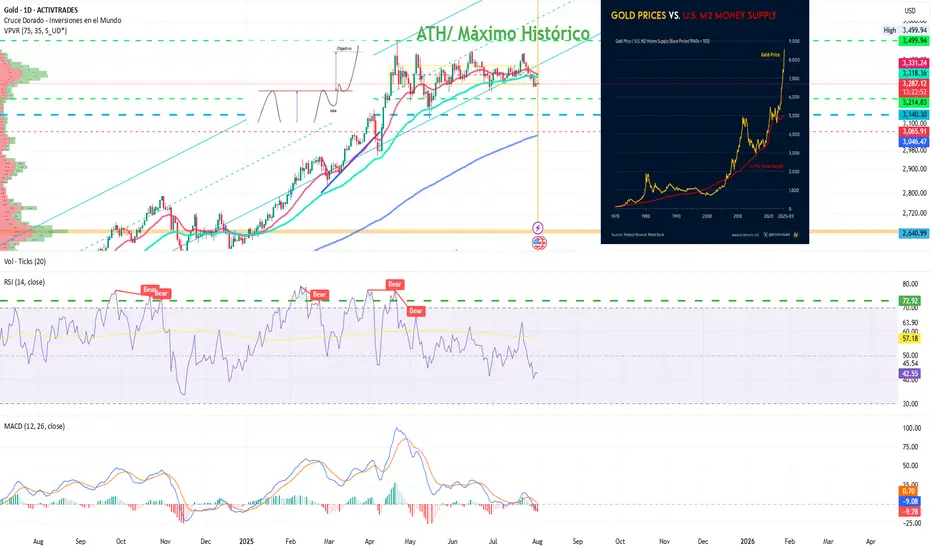
Gold: Are the Bulls Still Behind It?Ion Jauregui – Analyst at ActivTrades
Fundamental Analysis
In 2025, gold has appreciated around 27% year-to-date, reaching a peak of 33.37% at the end of April, driven by structural factors. Its strength is based on global de-dollarization, central bank purchases, persistent inflation, and expectations of real rate cuts in the U.S. Since real interest rates peaked in July 2023, gold has risen 74%, reinforcing its role as a hedge against monetary policy.
In addition, countries like China and Russia continue to accumulate gold as protection against the dollar and potential sanctions, supporting long-term structural demand. Diversifying with physical and financial gold (ETFs, mining stocks) is an increasingly common strategy in an environment of high debt, geopolitical tensions, and doubts about traditional safe-haven assets. A suggested allocation in a classic model portfolio could range between 10% and 25%, depending on the risk profile, in a typical equity-focused investment portfolio.
Technical Analysis
From a technical standpoint, gold has completed a long-term “cup with handle” formation that began in 2012, with an upside projection toward the $4,000 per ounce area. This pattern supports the continuation of its long-term upward structure.
In the short term, however, the price is in a consolidation phase after reaching all-time highs of $3,499.94 at the end of April. Since then, the lateral movement suggests a pause within the primary trend.
Technical indicators are showing mixed signals: RSI and MACD are pointing toward a possible oversold condition, suggesting a risk of short-term correction. Additionally, a bearish crossover between the 50-day and 100-day moving averages may reinforce selling pressure.
If this corrective scenario unfolds, gold could retrace toward a key support zone around $3,140, a level that has served as the base of the current range and where renewed buying interest could emerge.
Despite a possible pullback, the broader technical outlook remains constructive. Any correction would likely present tactical opportunities to re-enter the market—especially if expectations of real rate cuts or global geopolitical tensions persist.
Gold Consolidates After Highs
All in all, despite potential short-term pullbacks, gold continues to offer value as a tool for diversification, wealth protection, and a hedge against systemic risks. Its inclusion in portfolios remains relevant, even at current levels.
*******************************************************************************************
The information provided does not constitute investment research. The material has not been prepared in accordance with the legal requirements designed to promote the independence of investment research and such should be considered a marketing communication.
All information has been prepared by ActivTrades ("AT"). The information does not contain a record of AT's prices, or an offer of or solicitation for a transaction in any financial instrument. No representation or warranty is given as to the accuracy or completeness of this information.
Any material provided does not have regard to the specific investment objective and financial situation of any person who may receive it. Past performance and forecasting are not a synonym of a reliable indicator of future performance. AT provides an execution-only service. Consequently, any person acting on the information provided does so at their own risk. Political risk is unpredictable. Central bank actions can vary. Platform tools do not guarantee success.
XAUUSD Intraday Technical Analysis – Bullish Breakout SetupGold (XAUUSD) is showing signs of bullish recovery after a sharp sell-off, with current price action around 3305.86 USD hinting at a potential breakout on the 1-hour timeframe.
- Technical Overview
Price structure: After a steep decline, gold formed a base near the 3284–3299 zone and is now climbing back, with a potential inverse head-and-shoulders formation taking shape.
EMA cluster: Price is approaching the confluence of the EMA 50, EMA 100, and EMA 200, currently acting as dynamic resistance around 3309–3323. A break above these levels may confirm bullish strength.
Fibonacci retracement: The bounce appears from the 0.874 extension, indicating the end of the previous bearish leg.
Volume analysis: Increasing bullish volume supports the idea of a potential breakout.
- Key Levels to Watch
Zone Type
Price Level (USD)
Remarks
Immediate Resistance: 3,309 – 3,323 - Major test zone; overlaps with EMA 50/100
Major Resistance : 3,337 – 3,340 - Previous high; if broken confirms bullish continuation
Support Zone: 3,299 – 3,302 - Intraday support turned demand zone
Critical Support: 3,284 – 3,285 - Recent swing low; invalidates bullish view if broken
- Intraday Strategy Suggestion
Scenario 1 – Bullish Breakout
Entry: Buy on breakout and retest of 3,309–3,323
SL: Below 3,299
TP1: 3,337
TP2: 3,355
- Confirmation by strong bullish candle closing above EMA cluster and above resistance zone.
Scenario 2 – Buy on Pullback
Entry: Buy limit at 3,300–3,302
SL: Below 3,284
TP1: 3,323
TP2: 3,337
- Look for RSI divergence or bullish engulfing candle at support for higher conviction.
- Final Note
The bulls are attempting to reclaim momentum after a major correction. If gold can sustain above the 3,309 resistance and hold the 3,300 base, a short-term bullish reversal could materialize.

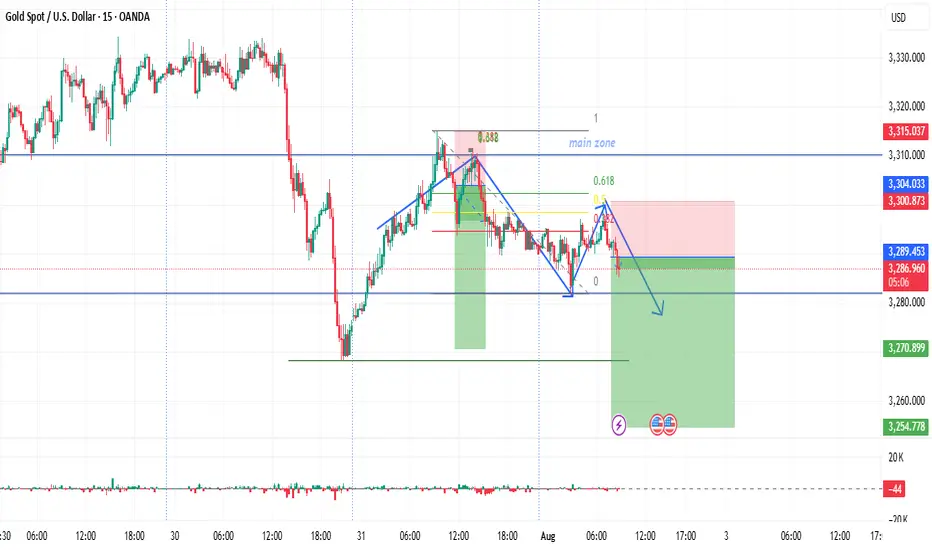
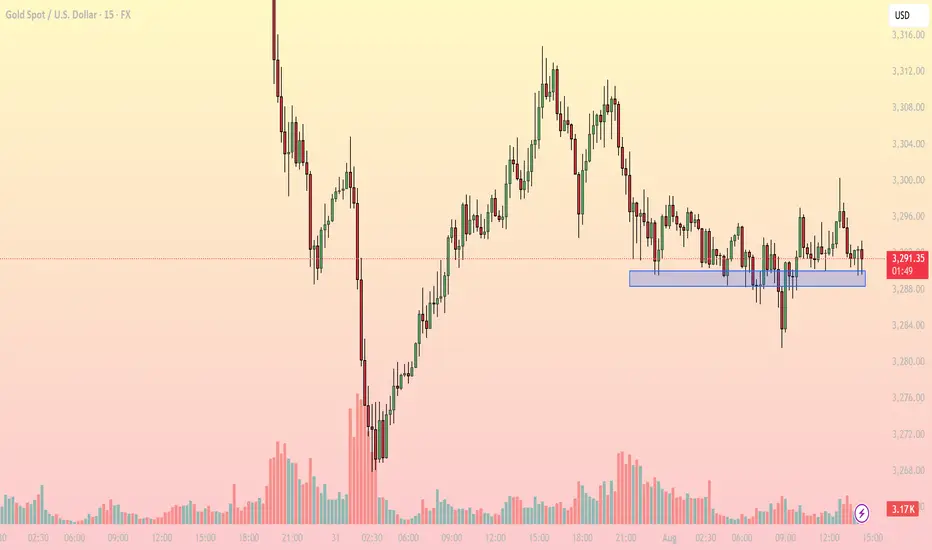
Gold consolidates near key support – What's next for?1. Market Overview
On the 15-minute chart, XAUUSD is trading around 3,290–3,292 USD, hovering just above a critical intraday support zone at 3,287–3,289 USD (highlighted in blue). This area has repeatedly provided a bounce in recent sessions, indicating persistent buying interest.
The current price action reflects sideways movement within a narrow range (3,287–3,296 USD), and notably, declining volatility, as shown by reduced candle range and trading volume.
2. Technical Breakdown
EMA: Price is moving around the EMA20 and EMA50, reflecting indecision and lack of directional momentum.
RSI (inferred): Likely hovering near the neutral 50–55 zone, confirming a balanced market.
Trendline: A descending series of lower highs from the 3,312 peak suggests bearish pressure, though buyers still defend key support.
Fibonacci: The 3,287 USD zone aligns with the 61.8% Fibonacci retracement level, reinforcing its strength as a bounce area.
3. Key Levels to Watch
3,287–3,289: Support - Repeated reactions here – key demand zone
3,296: Immediate resistance - Needs breakout to confirm bullish move
3,302: Next resistance - Breakout target – short-term top
3,275: Deeper support - Retest level if support breaks
4. Trading Strategy Scenarios
🔹 Scenario 1 – Long setup at support
Entry: 3,287–3,289 (wait for bullish reaction like pin bar or engulfing)
Stop Loss: Below 3,284
TP1: 3,296 | TP2: 3,302
🔹 Scenario 2 – Short setup on breakdown
Entry: Below 3,284 (after clear bearish candle close)
Stop Loss: 3,288
TP1: 3,275 | TP2: 3,268
5. Conclusion
Gold is in a tug-of-war at a sensitive support zone. Whether bulls defend or bears break below will set the tone for the rest of the session. Focus on price reaction around 3,287 to determine direction – avoid blind predictions.
Make sure to follow for more live strategies as the New York session unfolds – and save this post if you find it helpful!
What’s your view on this support zone? Let’s discuss below!
XAUUSD 1HR ANALYSIS🔔 XAUUSD 1H Analysis | August 1, 2025
Gold is currently consolidating inside a symmetrical triangle on the 1-hour timeframe. Price action has tightened, indicating a potential breakout scenario is near. Two key paths are highlighted:
🔹 Bullish Scenario:
A breakout above the triangle resistance may lead to a clean push towards $3,310, and if momentum sustains, $3,334 becomes the extended upside target (liquidity zone and prior supply area).
🔹 Bearish Scenario:
A breakdown below triangle support could send price toward $3,270 first. If this level fails to hold, further downside toward $3,245 is expected — a major support and demand zone.
📍 Current Price: $3,291.98
⏳ Wait for breakout confirmation with volume and momentum before committing to direction.
