a retest sell setup idea for xauusd quick move. This setup ideas is price retesting previous lev and giving sellers the signal to sell with candle stick confirmations,
Futures market
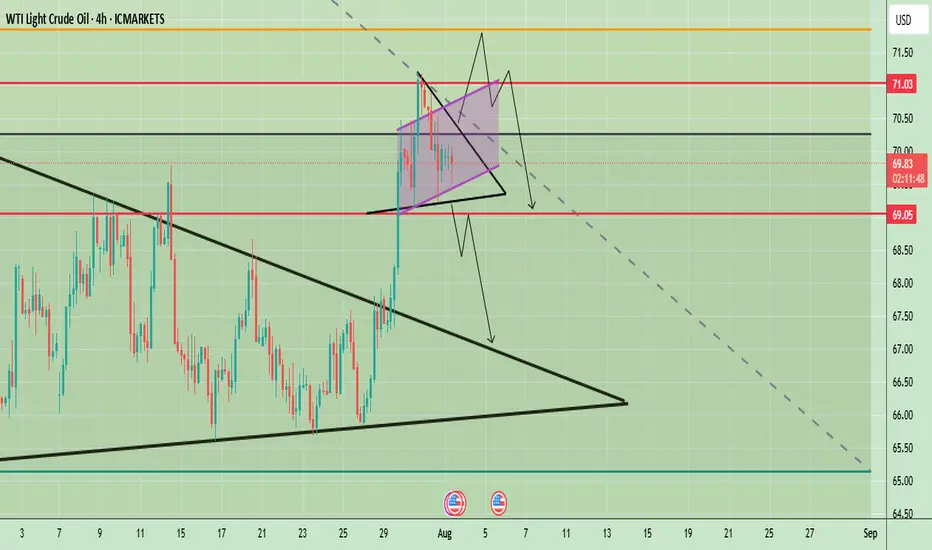
Activation of the head and shoulders pattern?Oil has formed a clean head and shoulders pattern, which, if activated, could lead the price to drop to 67.125. However, if the pattern fails and turns out to be a fakeout, we can expect the price to rise toward the \$71 area.
WTI Crude Oil Technical Outlook – Key Breakout or BreakdownWTI Crude Oil 4-hour chart suggests a potential inflection point after a strong bullish breakout from a larger symmetrical triangle pattern in late July. The price surged past key resistance levels and is now consolidating in a smaller symmetrical triangle formation just below the psychological $70 mark. This indicates a phase of indecision following a strong move, with market participants awaiting further confirmation.
Price is currently hovering around $69.82, with key levels marked at $71.03 (resistance) and $69.05 (support). The short-term price action within the tight triangle could determine the next move, with both bullish continuation and bearish reversal scenarios on the table.
Prices remain supported by supply concerns after Trump threatened to impose 100% secondary tariffs on buyers of Russian crude and warned China, a major oil consumer of severe penalties if it continues its purchases of Russian oil.
🔍 Potential Scenarios
- Bullish Breakout Scenario
If price breaks out of the smaller symmetrical triangle to the upside and clears the $70 resistance level with strong momentum, it may quickly test the $71.03 zone. A clean break above $71.03 would confirm the continuation of the previous uptrend, potentially opening room toward $72.50 and beyond in the medium term. The pattern would resemble a bullish pennant — a continuation pattern following the late July rally.
-Bearish Rejection and Breakdown
Conversely, a failure to sustain above $70 followed by a break below the lower boundary of the smaller triangle could lead to a sharper decline. The first critical level to watch would be $69.05; a break below this would likely invalidate the bullish setup and initiate a retest of the previously broken upper trendline of the larger triangle near $67.50. A further breakdown could lead price towards the larger support zone around $65–$66.
📈 Trend Outlook
- Short-Term: Neutral to Bullish — Consolidation in a smaller symmetrical triangle suggests a pause before continuation. However, the structure is still technically bullish unless $69.05 is broken.
- Medium-Term: Bullish Bias — The breakout from the large symmetrical triangle in late July indicates a shift in market sentiment, favoring higher prices unless the price fails to hold above $67.50.
- Long-Term: Cautiously Bullish — As long as WTI holds above the $65–$66 structural support area, the longer-term outlook remains constructive.
Note
Please risk management in trading is a Key so use your money accordingly. If you like the idea then please like and boost. Thank you and Good Luck!
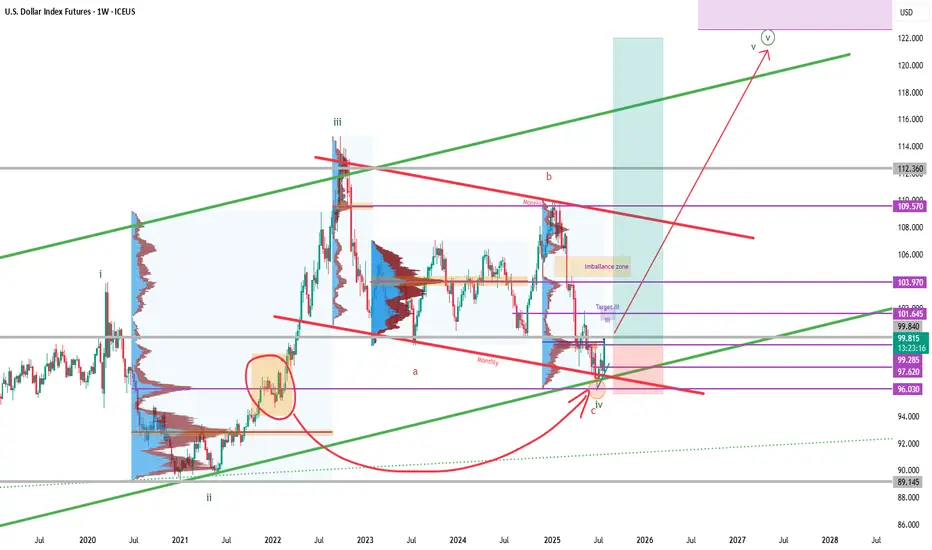
DXY - Dollar Index - Potenzial New Long phase
As we see in the chart .. in 2022 december we had a big volume accumulation before the october 2022 top to 112
After that we had a rebound and a laterality from sep. 22 to july 25.
In this moment we touche this volume and from my point of view we completed an ABC pattern.
Probably we have completed the pattern with a final Impulsive wave C and in this moment we start the final LONG wave 5
USOIL WTIWest Texas Intermediate (WTI) oil is a major benchmark for crude oil pricing, known for its high quality—being both light and sweet due to its low sulfur content and low density. WTI is sourced primarily from inland Texas and is the underlying commodity for oil futures traded on the New York Mercantile Exchange (NYMEX). The main physical delivery point is Cushing, Oklahoma, a critical U.S. oil storage and trading hub.
Current Price (as of August 1, 2025)
WTI crude oil is trading around $69.15–$69.36 per barrel.
Recently, WTI prices have seen volatility due to global economic factors, including U.S. tariffs, OPEC+ production, and shifts in oil demand. Despite a small decline on the day, oil prices have posted their strongest weekly performance since June, rising over 6% for the week.
Market and Outlook
Recent price movement reflects concerns about global trade tensions, new tariffs, and their impact on economic growth and energy demand. At the same time, supply risks remain due to geopolitical factors such as potential sanctions on Russian oil and U.S.-China trade developments.
Analyst forecasts for the remainder of 2025 suggest continued volatility, with WTI potentially ranging between $56 and $73 per barrel, influenced by demand, OPEC+ decisions, and geopolitical events.
Quick Facts Table
Feature Detail
Type Light, sweet crude
Benchmark NYMEX (U.S.), major global reference
Main Delivery Point Cushing, Oklahoma
Latest Price (Aug 1, 2025) $69.15–$69.36 per barrel
Typical Drivers U.S. tariffs, OPEC+ decisions, trade policy, supply risks, global demand
WTI oil plays a central role in global energy markets, serving as a benchmark for North American and international oil pricing. Its price reflects both supply fundamentals and broader macroeconomic and geopolitical developments.
#OIL #WTI

BuyLondon Session
Daily Volume
Untapped Zone
Market Structure
NT:: Limit order must be tapped before the breach of the red line
Gold: Are the Bulls Still Behind It?Ion Jauregui – Analyst at ActivTrades
Fundamental Analysis
In 2025, gold has appreciated around 27% year-to-date, reaching a peak of 33.37% at the end of April, driven by structural factors. Its strength is based on global de-dollarization, central bank purchases, persistent inflation, and expectations of real rate cuts in the U.S. Since real interest rates peaked in July 2023, gold has risen 74%, reinforcing its role as a hedge against monetary policy.
In addition, countries like China and Russia continue to accumulate gold as protection against the dollar and potential sanctions, supporting long-term structural demand. Diversifying with physical and financial gold (ETFs, mining stocks) is an increasingly common strategy in an environment of high debt, geopolitical tensions, and doubts about traditional safe-haven assets. A suggested allocation in a classic model portfolio could range between 10% and 25%, depending on the risk profile, in a typical equity-focused investment portfolio.
Technical Analysis
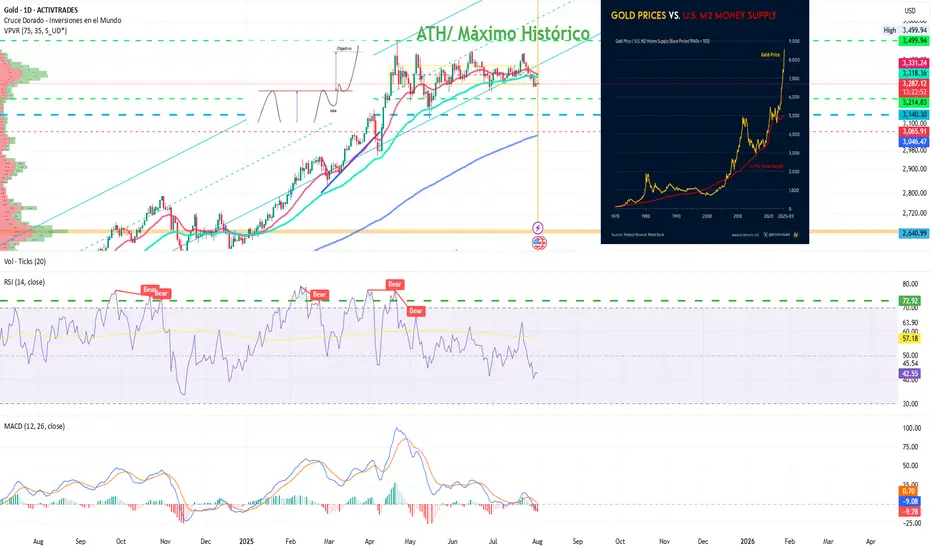
From a technical standpoint, gold has completed a long-term “cup with handle” formation that began in 2012, with an upside projection toward the $4,000 per ounce area. This pattern supports the continuation of its long-term upward structure.
In the short term, however, the price is in a consolidation phase after reaching all-time highs of $3,499.94 at the end of April. Since then, the lateral movement suggests a pause within the primary trend.
Technical indicators are showing mixed signals: RSI and MACD are pointing toward a possible oversold condition, suggesting a risk of short-term correction. Additionally, a bearish crossover between the 50-day and 100-day moving averages may reinforce selling pressure.
If this corrective scenario unfolds, gold could retrace toward a key support zone around $3,140, a level that has served as the base of the current range and where renewed buying interest could emerge.
Despite a possible pullback, the broader technical outlook remains constructive. Any correction would likely present tactical opportunities to re-enter the market—especially if expectations of real rate cuts or global geopolitical tensions persist.
Gold Consolidates After Highs
All in all, despite potential short-term pullbacks, gold continues to offer value as a tool for diversification, wealth protection, and a hedge against systemic risks. Its inclusion in portfolios remains relevant, even at current levels.
*******************************************************************************************
The information provided does not constitute investment research. The material has not been prepared in accordance with the legal requirements designed to promote the independence of investment research and such should be considered a marketing communication.
All information has been prepared by ActivTrades ("AT"). The information does not contain a record of AT's prices, or an offer of or solicitation for a transaction in any financial instrument. No representation or warranty is given as to the accuracy or completeness of this information.
Any material provided does not have regard to the specific investment objective and financial situation of any person who may receive it. Past performance and forecasting are not a synonym of a reliable indicator of future performance. AT provides an execution-only service. Consequently, any person acting on the information provided does so at their own risk. Political risk is unpredictable. Central bank actions can vary. Platform tools do not guarantee success.
XAUUSD Intraday Technical Analysis – Bullish Breakout SetupGold (XAUUSD) is showing signs of bullish recovery after a sharp sell-off, with current price action around 3305.86 USD hinting at a potential breakout on the 1-hour timeframe.
- Technical Overview
Price structure: After a steep decline, gold formed a base near the 3284–3299 zone and is now climbing back, with a potential inverse head-and-shoulders formation taking shape.
EMA cluster: Price is approaching the confluence of the EMA 50, EMA 100, and EMA 200, currently acting as dynamic resistance around 3309–3323. A break above these levels may confirm bullish strength.
Fibonacci retracement: The bounce appears from the 0.874 extension, indicating the end of the previous bearish leg.
Volume analysis: Increasing bullish volume supports the idea of a potential breakout.
- Key Levels to Watch
Zone Type
Price Level (USD)
Remarks
Immediate Resistance: 3,309 – 3,323 - Major test zone; overlaps with EMA 50/100
Major Resistance : 3,337 – 3,340 - Previous high; if broken confirms bullish continuation
Support Zone: 3,299 – 3,302 - Intraday support turned demand zone
Critical Support: 3,284 – 3,285 - Recent swing low; invalidates bullish view if broken
- Intraday Strategy Suggestion
Scenario 1 – Bullish Breakout
Entry: Buy on breakout and retest of 3,309–3,323
SL: Below 3,299
TP1: 3,337
TP2: 3,355
- Confirmation by strong bullish candle closing above EMA cluster and above resistance zone.
Scenario 2 – Buy on Pullback
Entry: Buy limit at 3,300–3,302
SL: Below 3,284
TP1: 3,323
TP2: 3,337
- Look for RSI divergence or bullish engulfing candle at support for higher conviction.
- Final Note
The bulls are attempting to reclaim momentum after a major correction. If gold can sustain above the 3,309 resistance and hold the 3,300 base, a short-term bullish reversal could materialize.

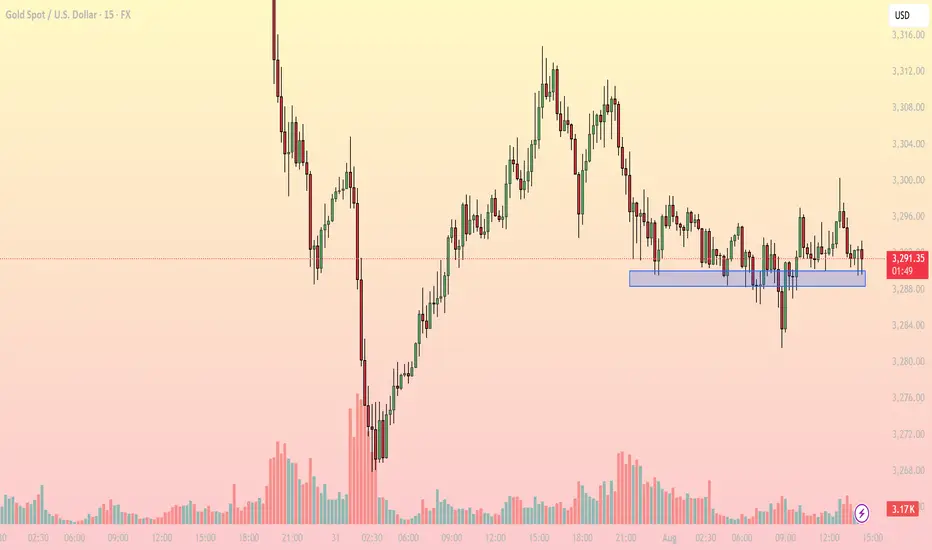
Gold consolidates near key support – What's next for?1. Market Overview
On the 15-minute chart, XAUUSD is trading around 3,290–3,292 USD, hovering just above a critical intraday support zone at 3,287–3,289 USD (highlighted in blue). This area has repeatedly provided a bounce in recent sessions, indicating persistent buying interest.
The current price action reflects sideways movement within a narrow range (3,287–3,296 USD), and notably, declining volatility, as shown by reduced candle range and trading volume.
2. Technical Breakdown
EMA: Price is moving around the EMA20 and EMA50, reflecting indecision and lack of directional momentum.
RSI (inferred): Likely hovering near the neutral 50–55 zone, confirming a balanced market.
Trendline: A descending series of lower highs from the 3,312 peak suggests bearish pressure, though buyers still defend key support.
Fibonacci: The 3,287 USD zone aligns with the 61.8% Fibonacci retracement level, reinforcing its strength as a bounce area.
3. Key Levels to Watch
3,287–3,289: Support - Repeated reactions here – key demand zone
3,296: Immediate resistance - Needs breakout to confirm bullish move
3,302: Next resistance - Breakout target – short-term top
3,275: Deeper support - Retest level if support breaks
4. Trading Strategy Scenarios
🔹 Scenario 1 – Long setup at support
Entry: 3,287–3,289 (wait for bullish reaction like pin bar or engulfing)
Stop Loss: Below 3,284
TP1: 3,296 | TP2: 3,302
🔹 Scenario 2 – Short setup on breakdown
Entry: Below 3,284 (after clear bearish candle close)
Stop Loss: 3,288
TP1: 3,275 | TP2: 3,268
5. Conclusion
Gold is in a tug-of-war at a sensitive support zone. Whether bulls defend or bears break below will set the tone for the rest of the session. Focus on price reaction around 3,287 to determine direction – avoid blind predictions.
Make sure to follow for more live strategies as the New York session unfolds – and save this post if you find it helpful!
What’s your view on this support zone? Let’s discuss below!
XAUUSD 1HR ANALYSIS🔔 XAUUSD 1H Analysis | August 1, 2025
Gold is currently consolidating inside a symmetrical triangle on the 1-hour timeframe. Price action has tightened, indicating a potential breakout scenario is near. Two key paths are highlighted:
🔹 Bullish Scenario:
A breakout above the triangle resistance may lead to a clean push towards $3,310, and if momentum sustains, $3,334 becomes the extended upside target (liquidity zone and prior supply area).
🔹 Bearish Scenario:
A breakdown below triangle support could send price toward $3,270 first. If this level fails to hold, further downside toward $3,245 is expected — a major support and demand zone.
📍 Current Price: $3,291.98
⏳ Wait for breakout confirmation with volume and momentum before committing to direction.

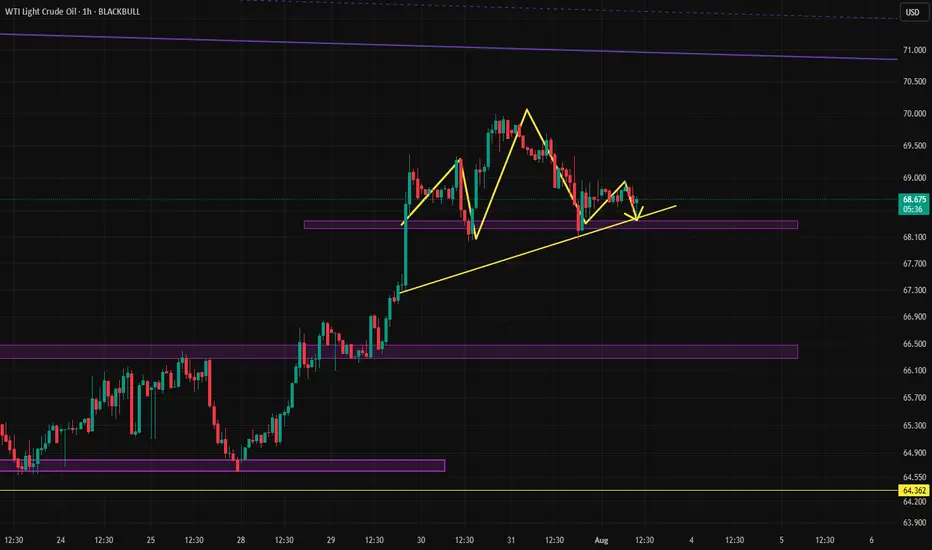
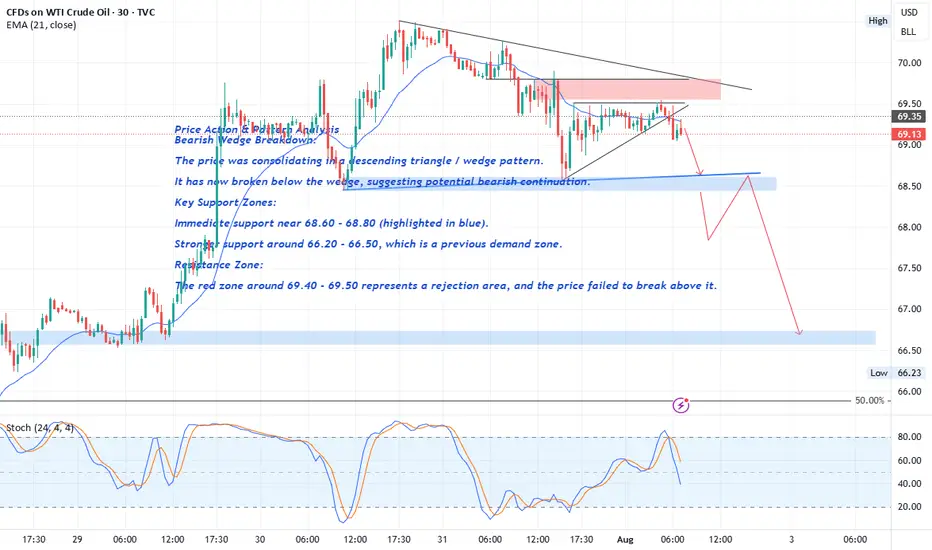
Crude Oil Price Action & Pattern Analysis
Bearish Wedge Breakdown:
The price was consolidating in a descending triangle / wedge pattern.
It has now broken below the wedge, suggesting potential bearish continuation.
Key Support Zones:
Immediate support near 68.60 - 68.80 (highlighted in blue).
FOREXCOM:USOIL
The break of the 68.60 level with a strong bearish candle would serve as confirmation of a Head and Shoulders (H&S) pattern , with solid bearish implications.
Stronger support around 66.20 - 66.50 , which is a previous demand zone.
Resistance Zone:
The red zone around 69.40 - 69.50 represents a rejection area , and the price failed to break above it.
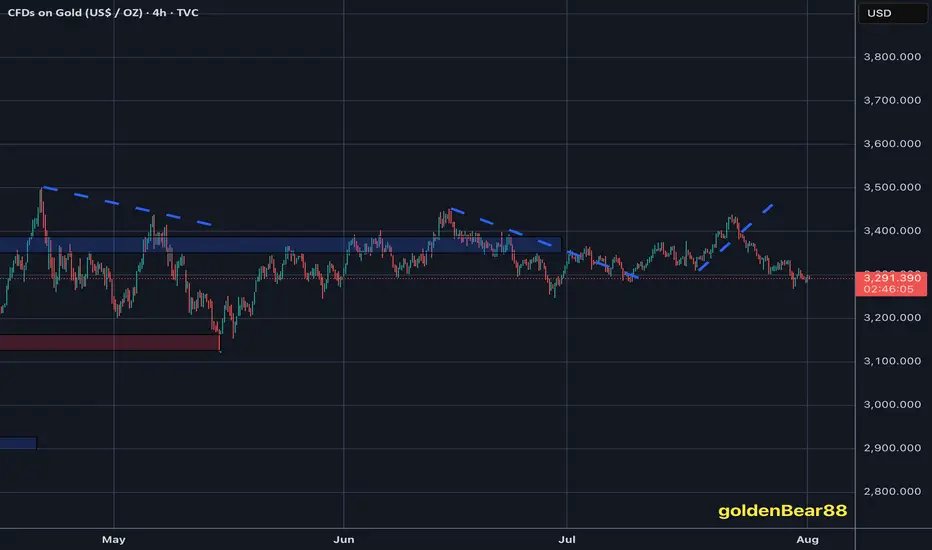
gold ranginggold has been raging between 3260-3310
probably gonna be a sideways before confirming directions.

GOLD - Monthly breakout retest may confirm multi-year bull cycleHello everyone, what are your thoughts on the long-term outlook for XAUUSD?
Looking at the monthly chart (1M), we can clearly see that XAUUSD has broken out of the long-standing ascending channel that has held since 2015 — a major signal suggesting the start of a new bullish cycle. Price is now retesting the previously broken trendline, hinting at the possibility of a fresh upward leg to resume the longer-term bullish trend we've seen recently.
Personally, I'm targeting $3,600 in the medium term, and potentially $4,000 by 2026–2028 if institutional capital continues to rotate back into safe-haven assets like gold.
What about you — do you think BTC/USD will rise or fall in the coming years?
And what’s your target for it?

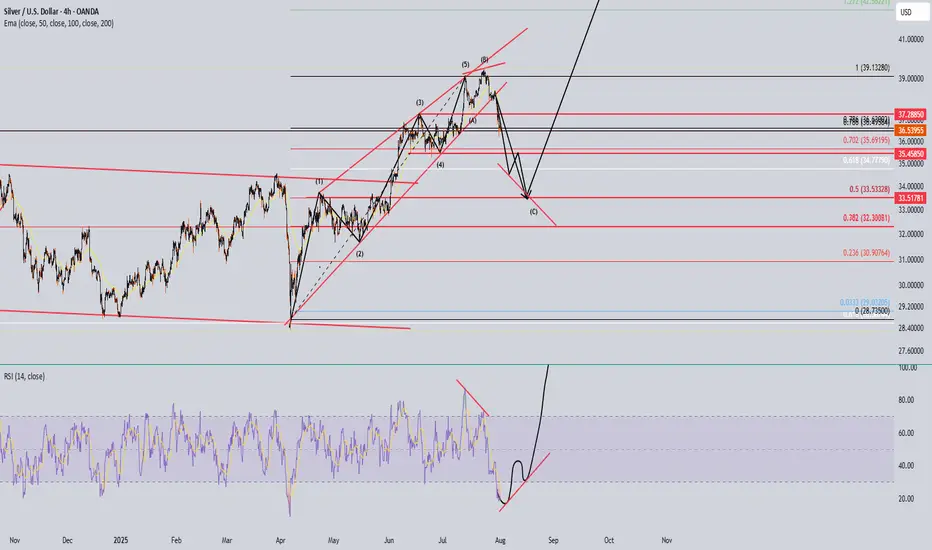
Wait SIlverLook at the RSI to form something like this in combine with the last 2 waves down. Then hopefully that power move to the 600?? Macro on the monthly its forming a cup and handle. If plays out silver will be super pricy
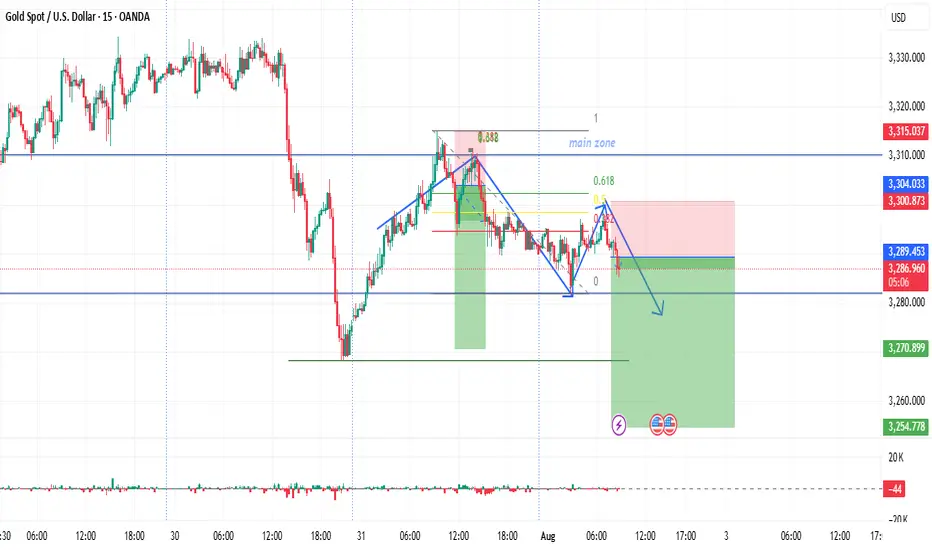
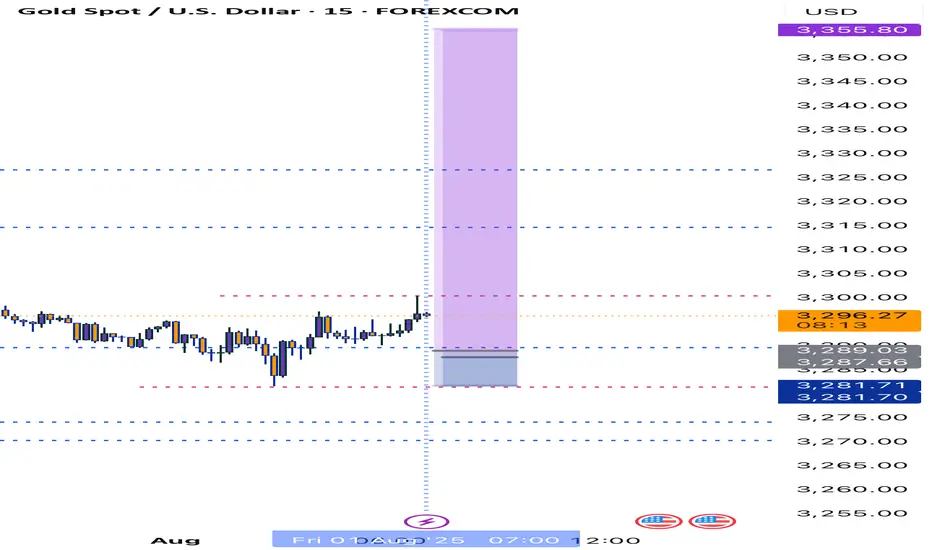
I maintain my #3,277.80 and #3,252.80 TargetsI didn't engaged any re-Sell orders throughout yesterday's session and re-Sold Gold on #3,295.80 ahead of Asian session, with plan to keep orders over-night. However due NFP, Gold might be stationary / ranging until the news as I closed both of my orders on #3,291.80 / each #9.000 Eur Profit and my #3,300.80 pending Sell limit has been triggered over-night which is now running in Profits with Stop on breakeven. I do expect #3,277.80 and #3,252.80 Targets to be met within #1 - #3 sessions and if there aren't NFP numbers, I would keep all three orders / set of Selling orders maintaining my first #3,277.80 Target. Due the news, Gold might fluctuate within Neutral Rectangle until the news.
Technical analysis: My earlier Selling configuration / Technical expectations was confirmed on Hourly 4 chart under prolonged weakness and Price-action respecting the trend-line guarding the downtrend (very Bearish formation) as Hourly 1 chart is already an aggressive Descending Channel (width opened on Williams) that should reach it’s next local Low’s (currently Trading slightly below Double Bottom) and Oversold state near my take Profit of #3,252.80 benchmark. If the bands are widened Traders may witness #3,277.80 test, also if gets invalidated and #3,270.80 gives away, #3,252.80 mark extension test is inevitable. In any case I will update my Targets or levels of Profit taking if I decide to exit earlier than #3,252.80 benchmark to be in accordance with the Daily chart’s period / I already ride Selling wave since #,3,300's and my Profit will be already good to ignore.
My position: DX is soaring, Gold is under Bearish Technical developments and #3,252.80 benchmark is my final Target of current Selling leg. Only factor which can reverse this Intra-day but not postpone is NFP. I expect downside Jobs surprise which may reverse DX from local High's however hot upside surprise will make Gold test #3,252.80 Intra-day. NFP or not I do believe Gold is Bearish. Trade accordingly.

Gold Outlook – Friday August 1st | Navigating NFP VolatilityGold has been in a clear downtrend all week, confirmed on the 4H chart and pushed further by the Fed rate decision earlier this week.
With NFP ahead today, I’m staying sharp and focused only on confirmed setups:
🔻 Sell Setup: Below 3274.33
First TP: 3268 (+50 pips)
Final TP: 3264 (+97 pips)
🟢 Buy Setup: Above 3343
Target: 3359 (+160 pips)
🎯 This is not the day to guess — it’s about being fast, clean, and rule-based.

I maintain my #3,277.80 and #3,252.80 TargetsI didn't engaged any re-Sell orders throughout yesterday's session and re-Sold Gold on #3,295.80 ahead of Asian session, with plan to keep orders over-night. However due NFP, Gold might be stationary / ranging until the news as I closed both of my orders on #3,291.80 / each #9.000 Eur Profit and my #3,300.80 pending Sell limit has been triggered over-night which is now running in Profits with Stop on breakeven. I do expect #3,277.80 and #3,252.80 Targets to be met within #1 - #3 sessions and if there aren't NFP numbers, I would keep all three orders / set of Selling orders maintaining my first #3,277.80 Target. Due the news, Gold might fluctuate within Neutral Rectangle until the news.
Technical analysis: My earlier Selling configuration / Technical expectations was confirmed on Hourly 4 chart under prolonged weakness and Price-action respecting the trend-line guarding the downtrend (very Bearish formation) as Hourly 1 chart is already an aggressive Descending Channel (width opened on Williams) that should reach it’s next local Low’s (currently Trading slightly below Double Bottom) and Oversold state near my take Profit of #3,252.80 benchmark. If the bands are widened Traders may witness #3,277.80 test, also if gets invalidated and #3,270.80 gives away, #3,252.80 mark extension test is inevitable. In any case I will update my Targets or levels of Profit taking if I decide to exit earlier than #3,252.80 benchmark to be in accordance with the Daily chart’s period / I already ride Selling wave since #,3,300's and my Profit will be already good to ignore.
My position: DX is soaring, Gold is under Bearish Technical developments and #3,252.80 benchmark is my final Target of current Selling leg. Only factor which can reverse this Intra-day but not postpone is NFP. I expect downside Jobs surprise which may reverse DX from local High's however hot upside surprise will make Gold test #3,252.80 Intra-day. NFP or not I do believe Gold is Bearish. Trade accordingly.
U.S. NATURAL GAS SUCCESSFULLY REBOUNDED FROM FIRM SUPPORT.U.S. NATURAL GAS SUCCESSFULLY REBOUNDED FROM FIRM SUPPORT.
Yesterday the natural gas storage report came out higher than expected. U.S. natural gas inventories increased by 48 billion cubic feet last week to 3,123 Bcf, increasing the surplus over the five-year average to 195 Bcf from 171 Bcf the week before, the EIA reports. The storage increase was bigger than the 24 Bcf average for the week, and above the 36 Bcf estimate. However, the price rised on 2.35% afterwards, supported by increased volume, which indicates the strength of the level. The upward movement towards the 3.3000 level is highly expected.
Additionally, seasonals suggest us that current prices may become the lowest till the end of the year. Historically, since August the natural gas prices increase in anticipation of a new heating season and higher energy demand (pic2).

Gold (XAU/USD) on the 1‑hour timeframeGold (XAU/USD) on the 1‑hour timeframe
Chart Structure & Bias
* Price remains trapped in a **rising channel** (\~\$3,328–3,333), pressing against resistance near **\$3,340–3,345**.
* Short-term momentum is bearish: both EMA 7 and EMA 21 sit above current price, with declining volume signaling weakening buyer strength.
* Overall trend leans neutral‑to‑bearish until market clears key zones decisively.
Trade Scenarios
**Bearish Breakdown (Preferred)**
* **Trigger:** Break and close below channel support (\~\$3,326).
* **Targets:** Initial drop toward **\$3,320**, then **\$3,300**, and possibly lower if momentum intensifies.
* **Invalidation:** Price pushes back above **\$3,333–3,335**, negating bearish structure.
**Bullish Breakout (Conditional)**
* **Trigger:** Clean breakout and sustained close above **\$3,342–3,345**.
* **Targets:** Upward stretch toward **\$3,355–3,360**, and if strong, **\$3,367–3,375+**.
* **Invalidation:** Fails to hold structure—retesting from above back beneath **\~\$3,338**.
Macro Drivers & Market Conditions
* Caution prevails pre‑Fed decision and ADP / GDP releases—market awaits cues on interest rate direction.
* Safe‑haven demand has softened as global trade sentiment improves, while U.S. dollar strength continues to cap upside in gold.
* Analysts favor **sell‑on‑rise positioning**, bumping up potential for controlled pullbacks.
Verdict
Gold is consolidating in a tight upward channel, showing short-term bearish pressure. The **bearish breakdown scenario holds the edge** unless price convincingly clears above **\$3,345** on strong volume, which could flip bias. A confirmed break below **\$3,326** sets the stage for downward moves toward **\$3,300** or lower.

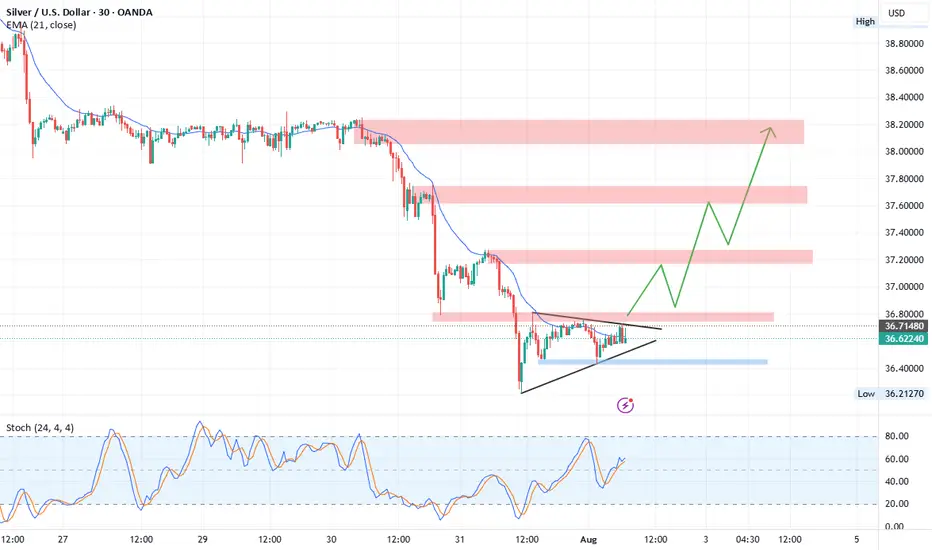
XAGUSD Technical Outlook (Silver/USD)Currently, Silver is trading inside a symmetrical triangle formation , signaling a potential breakout.
Upside Scenario:
A breakout above 36.80 resistance may trigger strong bullish momentum. The next target zone lies at 37.18 – 37.30, which is a relatively weak resistance and could potentially form a Head and Shoulders pattern . If momentum continues, Silver could extend gains toward 37.75 and 38.00 resistance levels.
Downside Scenario:
If the triangle breaks to the downside, we may see a short corrective move toward 3 6.25 – 36.20 support zone before any possible rebound.
Overall, the chart structure currently favors an upside breakout with continuation toward higher resistance zones.
short XAU USD If the price returns to the 3296 area in the next hour or two, you can enter with a stop of 3301 with a target of 150 to 200 pips. It is only valid for the next hour or two.

GOLD (XAUUSD): Bearish Continuation Ahead?!
Gold retested a recently broken significant liquidity cluster.
I see a clear sign of strength of the sellers after its test
with multiple intraday confirmation.
I think that the price will retrace to day to 3276 level.
❤️Please, support my work with like, thank you!❤️
I am part of Trade Nation's Influencer program and receive a monthly fee for using their TradingView charts in my analysis.

Market Stuck in Limbo? XAGUSD Update & Likely Range AheadLet’s talk silver.
The market's clearly undecided — no real momentum, just hesitation.
We’re approaching overextended RSI levels, so don’t expect fireworks just yet.
Im Skeptic from Skeptic Lab and In this quick update, I’ll show you what I’m watching for both long and short triggers …
and why a range might dominate the next few days.
👉 Watch till the end to avoid getting trapped by fake breakouts.
