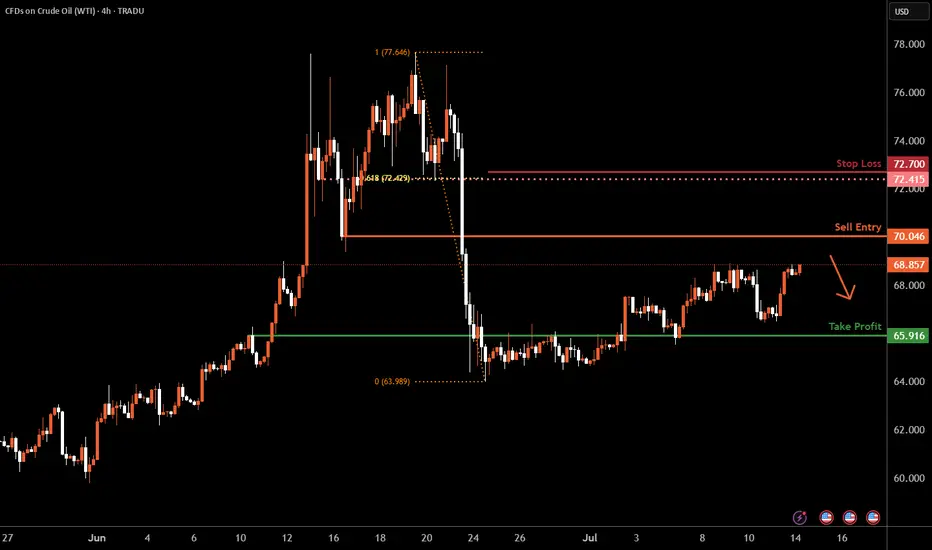
WTI Oil H4 | Rising into a pullback resistanceWTI oil (USOIL) is rising towards a pullback resistance and could potentially reverse off this level to drop lower.
Sell entry is at 70.04 which is a pullback resistance.
Stop loss is at 72.70 which is a level that sits above the 61.8% Fibonacci retracement and a pullback resistance.
Take profit is at 65.91 which is an overlap support.
High Risk Investment Warning
Trading Forex/CFDs on margin carries a high level of risk and may not be suitable for all investors. Leverage can work against you.
Stratos Markets Limited (tradu.com ):
CFDs are complex instruments and come with a high risk of losing money rapidly due to leverage. 63% of retail investor accounts lose money when trading CFDs with this provider. You should consider whether you understand how CFDs work and whether you can afford to take the high risk of losing your money.
Stratos Europe Ltd (tradu.com ):
CFDs are complex instruments and come with a high risk of losing money rapidly due to leverage. 63% of retail investor accounts lose money when trading CFDs with this provider. You should consider whether you understand how CFDs work and whether you can afford to take the high risk of losing your money.
Stratos Global LLC (tradu.com ):
Losses can exceed deposits.
Please be advised that the information presented on TradingView is provided to Tradu (‘Company’, ‘we’) by a third-party provider (‘TFA Global Pte Ltd’). Please be reminded that you are solely responsible for the trading decisions on your account. There is a very high degree of risk involved in trading. Any information and/or content is intended entirely for research, educational and informational purposes only and does not constitute investment or consultation advice or investment strategy. The information is not tailored to the investment needs of any specific person and therefore does not involve a consideration of any of the investment objectives, financial situation or needs of any viewer that may receive it. Kindly also note that past performance is not a reliable indicator of future results. Actual results may differ materially from those anticipated in forward-looking or past performance statements. We assume no liability as to the accuracy or completeness of any of the information and/or content provided herein and the Company cannot be held responsible for any omission, mistake nor for any loss or damage including without limitation to any loss of profit which may arise from reliance on any information supplied by TFA Global Pte Ltd.
The speaker(s) is neither an employee, agent nor representative of Tradu and is therefore acting independently. The opinions given are their own, constitute general market commentary, and do not constitute the opinion or advice of Tradu or any form of personal or investment advice. Tradu neither endorses nor guarantees offerings of third-party speakers, nor is Tradu responsible for the content, veracity or opinions of third-party speakers, presenters or participants.
Futures market
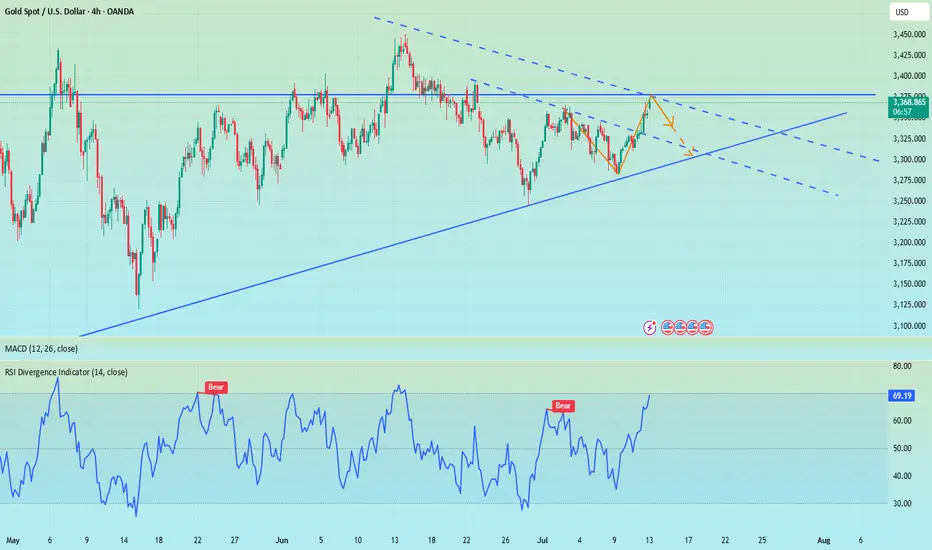
Gold Price Analysis: Bearish Trend Likely to ContinueGold Price Analysis: Bearish Trend Likely to Continue
Gold prices have been forming lower lows, signaling a sustained **bearish trend in the market. This downward movement indicates weakening bullish momentum, with sellers dominating price action. Currently, the price is moving in a secondary trend (a short-term correction within the broader primary trend). However, in the upcoming trading sessions, this secondary trend may conclude, leading to a resumption of the primary bearish trend.
A key factor to watch is the emergence of a candlestick reversal pattern, such as a bearish engulfing or evening star formation, which could confirm further downside momentum. If such a pattern appears, gold prices may extend their decline, potentially testing the critical support level near $3,250. A decisive break below this level could accelerate selling pressure, opening the door for deeper corrections.
On the upside, $3,450 remains a strong resistance zone. Any rebound attempts could face rejection near this level unless there is a significant shift in market sentiment—such as a dovish Fed policy change or renewed safe-haven demand. Traders should monitor key economic data, including inflation reports and interest rate decisions, as these factors heavily influence gold’s direction.
Key Levels to Watch:
- Support: $3,250 (Break below may trigger further selling)
- Resistance: $3,450 (Reversal point if buyers regain control)
Trading Strategy:
- Short-term traders may look for selling opportunities near resistance levels, targeting $3,250.
- Long-term investors should wait for a confirmed trend reversal before entering bullish positions.

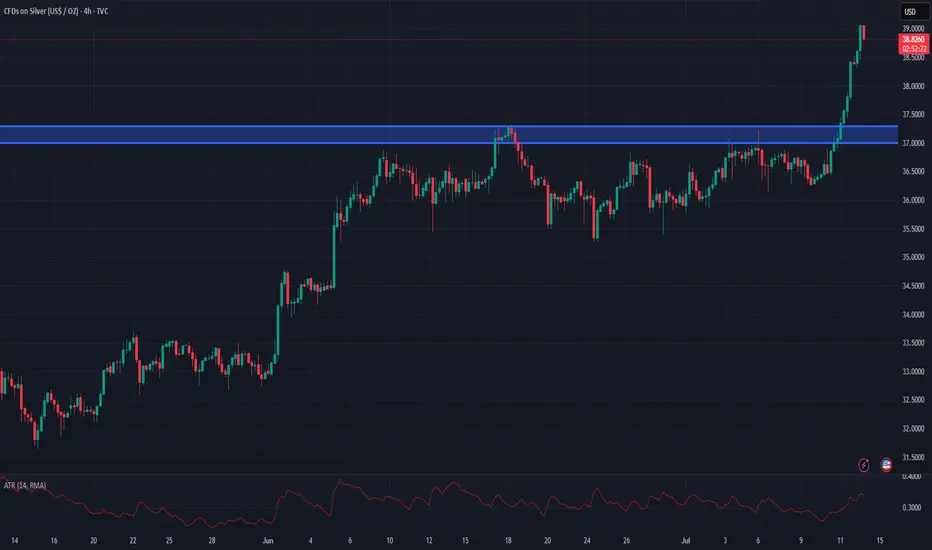
Silver breaks out to 14 year highsSilver has broken out again above the previous resistance zone at $37.00-$37.30 amid ongoing concerns surrounding tariffs
If we see corrective retests of this $37.00-$37.30 it can offer a good opportunity to get long and take advantage of Silvers bullish momentum.
Stops would need to be below $36.75 and targets can be set to around $40.00-$41.50
Gold Analysis – Multi-Timeframe OutlookOn the Monthly timeframe, we’ve now seen a clear triple wick rejection, signaling potential downside momentum. After multiple failed attempts to break above the $3,400 level, price action has begun to retrace.
Looking at the 1H timeframe, we’ve broken below the upward trendline, and price continues to push lower. This reinforces the bearish sentiment for now.
That said, if we see a break and close above $3,330, I’ll be watching for a potential retest of the previous trendline near the $3,364 level. Conversely, a break below $3,283 could open the door for further downside toward the $3,247 level.
Heading into Friday, with no significant USD news on the calendar, I’m expecting low volatility and potential sideways movement.
Trade Ideas:
• Sell zone: $3,325 – $3,330
• Buy zone: $3,308 – $3,313
As always, risk management is key — only risk 1–2% of your capital per trade.
Good luck and stay disciplined!

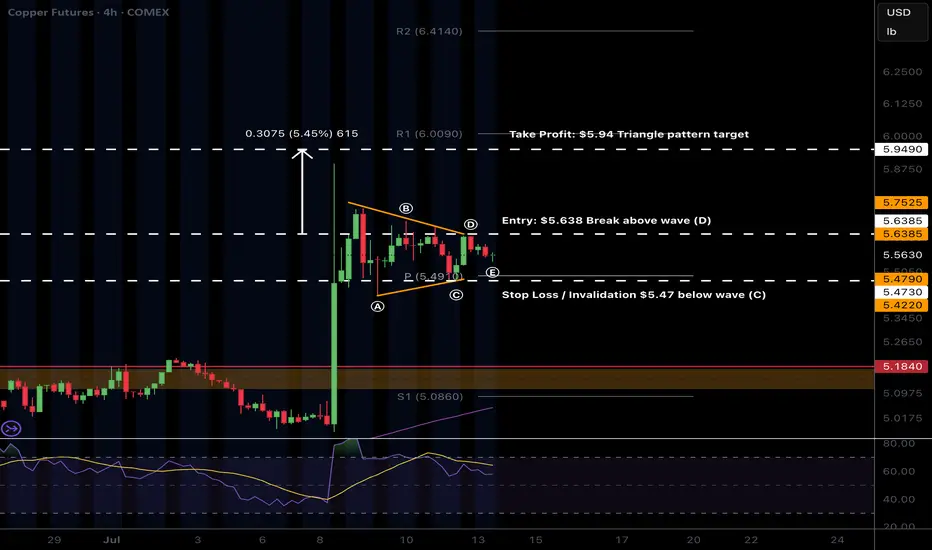
$COPPER triangle trade?CAPITALCOM:COPPER triangle has potentially printed and a triangle is an Elliot wave pattern that results in a terminal thrust up to complete a motif wave.
That would trap bulls as price terminates with a poke above the all time high keeping them believing they can capture the same gains already gone.
After the termination wave 2 often finds support at the triangle base.
Safe trading
Gold sell position Looking feom the current change of trend on the 4hrs timeframe
Gold might give some bullish move till we say another change in trend
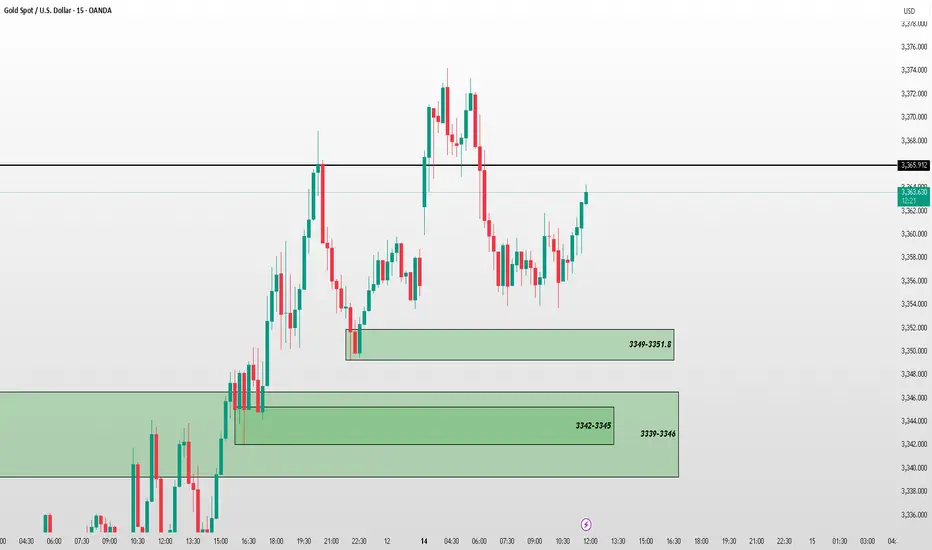
GOLD UPDATE – Demand Zone Bounce📊 GOLD UPDATE – Demand Zone Bounce
Price respected the 3349–3351.8 demand zone and is now climbing toward key resistance at 3366.912.
🟩 Demand Zone Held: 3349–3351.8
📈 Target: Resistance Level 3366.912
📉 Backup Demand: 3342–3345 & 3339–3346 (in case of pullback)
This reaction reinforces the importance of level precision and smart zone selection. Let's watch for confirmation near resistance.
Gold surged higher but encountered resistance and pulled back.Spot gold edged higher, with the highest level reaching $3,374.71 per ounce, the highest since June 23. Over the weekend, Trump announced that a 30% tariff would be imposed on goods imported from the European Union starting from August 1, which further intensified market concerns about international trade and provided upward momentum for gold prices.
Gold prices rose 1% last Friday, closing at $3,357.39 per ounce, as investors turned to safe-haven assets after U.S. President Trump announced a series of tariff measures. Analysts said that the uncertainty premium has returned to the market again.
U.S. President Trump threatened on Saturday (July 12) to impose a 30% tariff on goods imported from Mexico and the European Union starting from August 1. Prior to this, he had engaged in weeks of negotiations with these two largest U.S. trading partners but failed to reach a comprehensive trade agreement. The escalation of the trade war has angered U.S. allies and unsettled investors.
It is worth noting that U.S. President Trump plans to make a "major announcement" on the Russia issue on Monday, which also requires attention from investors.
you are currently struggling with losses,or are unsure which of the numerous trading strategies to follow,You have the option to join our VIP program. I will assist you and provide you with accurate trading signals, enabling you to navigate the financial markets with greater confidence and potentially achieve optimal trading results.
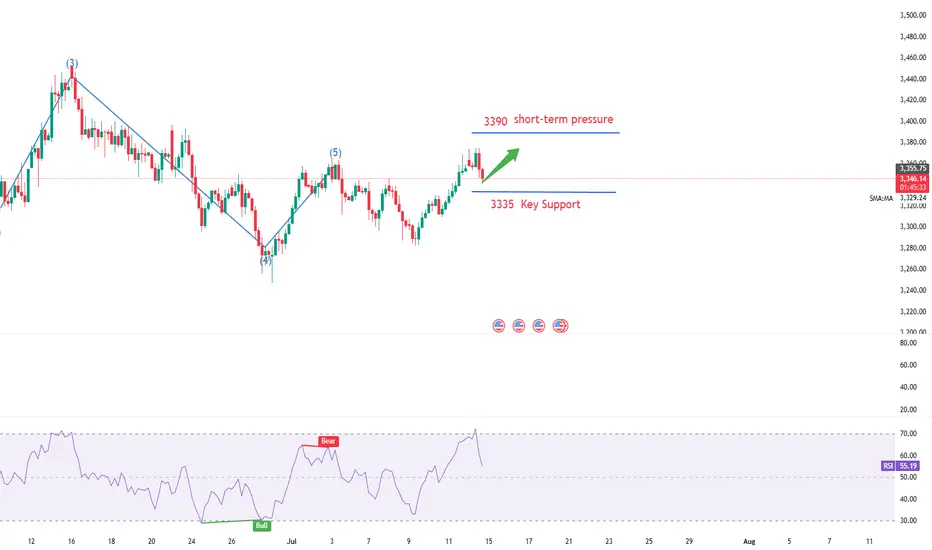
Gold H1 analysis According to my analyzer, gold is getting a great support from here which can take gold to the next target of 3392. If you are in the market based on my analysis, you can play.
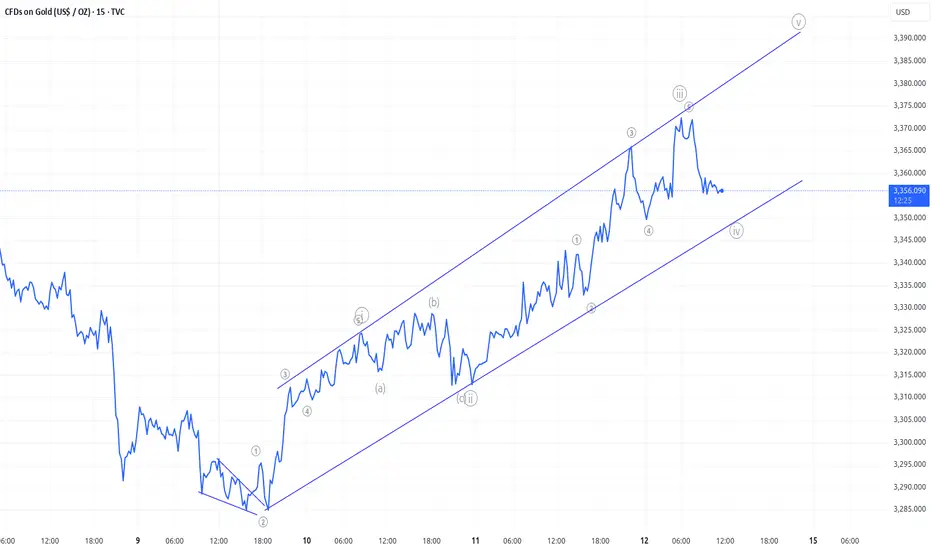
XAU SMCsmc daily bos buy , internal buy , bulish channel , another elliot move ?..what dow you think guys

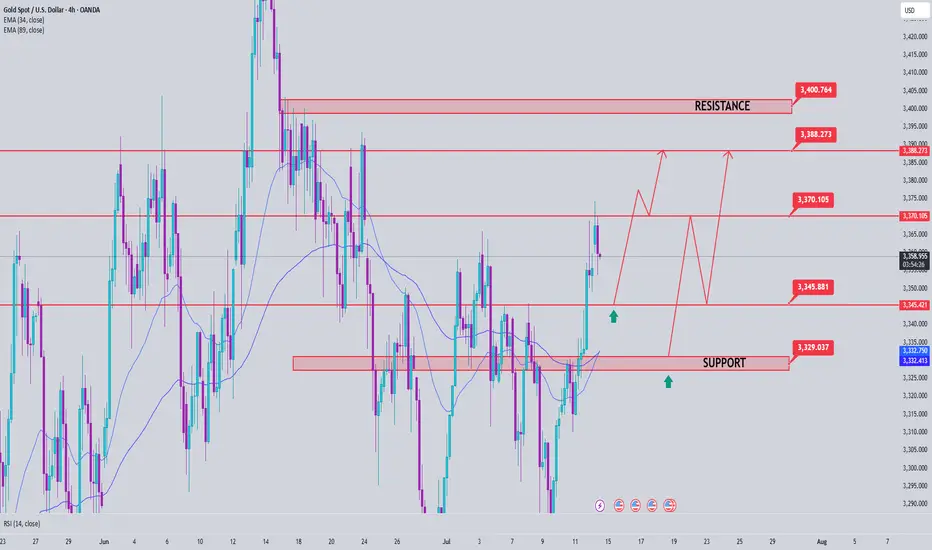
XAUUSD on retest (swing ready)Gold is currently holding Rangebound 3345-3375.Also market has potential of buying towards 3400 then Drop again.
What's possible scanarios we have?
▪️I'm looking for Buying at 3340-3345 support area ,if we found 3340-3345 as correction and H4-H1 remains above then keep buy set targets at 3365 then 3375.
Additional TIP:
Below 3330 I will Activate my resell and hold till 3315 then 3305.
All the entries should be taken if all the rules are applied
#XAUUSD

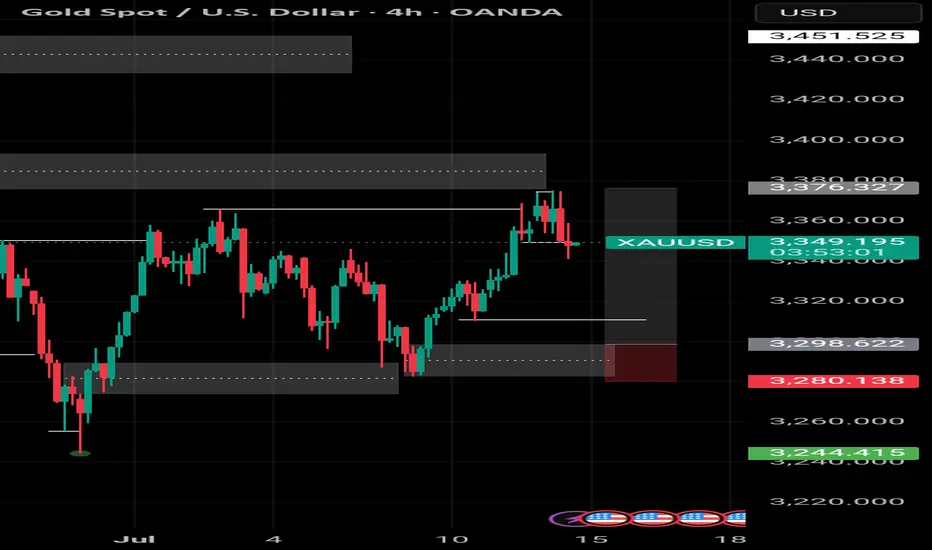
GOLD: Local Bearish Bias! Short!
My dear friends,
Today we will analyse GOLD together☺️
The price is near a wide key level
and the pair is approaching a significant decision level of 3,349.76 Therefore, a strong bearish reaction here could determine the next move down.We will watch for a confirmation candle, and then target the next key level of 3,341.88..Recommend Stop-loss is beyond the current level.
❤️Sending you lots of Love and Hugs❤️

Gold (XAU/USD) 4-hour chart4-hour chart of Gold (XAU/USD)** showing a key technical setup near the \$3,344 level. Price action is testing a significant **resistance zone** highlighted in grey, with two possible scenarios unfolding from this level.
**Chart Analysis Overview:**
* Gold has been in a **bullish short-term trend**, forming higher lows and pushing above the **EMA 7, 21, and 50**, all converging near the \$3,324–\$3,331 area (acting as dynamic support).
* Price is now approaching a **multi-tested resistance zone** near \$3,360–\$3,390, where it has previously faced selling pressure.
* Volume is rising, supporting the current bullish momentum.
**Scenario 1: Bullish Breakout (Green Path)**
**Conditions:**
* Price breaks and holds above the \$3,360–\$3,390 resistance zone.
* Continued bullish momentum supported by trade tensions, safe-haven demand, and Fed uncertainty.
**Target:**
* First target: \$3,400
* Extension: \$3,420–\$3,440 zone if momentum strengthens.
**Invalidation:**
* Failure to hold above \$3,360–\$3,390 range could limit upside potential.
**Scenario 2: Bearish Rejection (Red Path)**
**Conditions:**
* Price gets rejected from the resistance zone (\$3,360–\$3,390).
* Fails to establish support above the breakout level and drops back below \$3,330.
**Target:**
* Immediate support at \$3,310–\$3,290
* Deeper correction towards \$3,260–\$3,220 if bearish pressure increases.
**Confirmation:**
* Look for bearish candlestick patterns near resistance (e.g., shooting star, bearish engulfing).
* Drop below EMA cluster (\$3,324–\$3,331) to confirm weakness.
**Conclusion:**
Gold is at a decision point near major resistance. A breakout above \$3,390 could extend the bullish rally, while failure to break this level may invite sellers and trigger a correction. Watch price action around this resistance for confirmation of the next move.

XAU / USD 1 Hour ChartHello traders. Here is my Happy Monday scalp trade thoughts. Area of interest is marked. Let's see if we can catch a few pips if the times all align. Big G gets my thanks. Be well and trade the trend. I will post / update if I take a trade. It's only Monday so I am in no hurry to force or rush a trade. Thank so much.

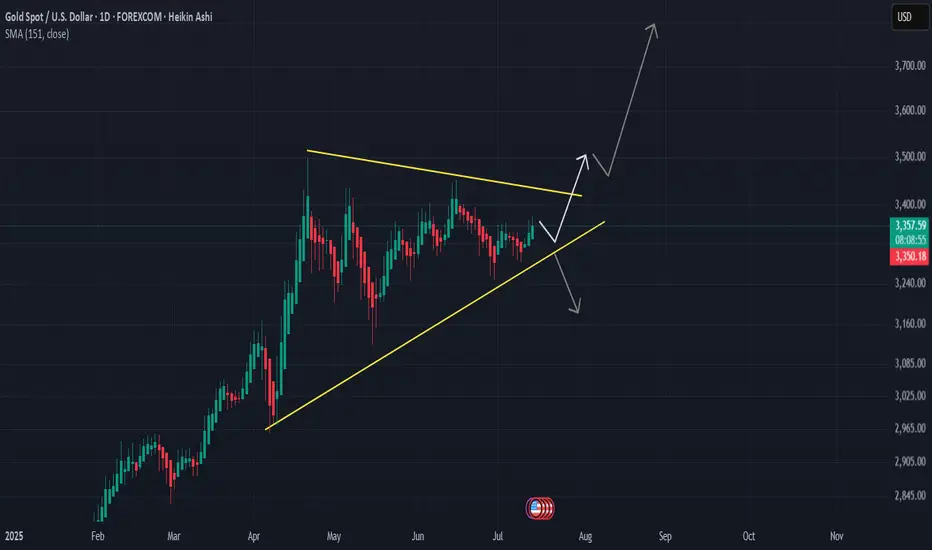
GOLD - 1H VIEWStill looking for a move lower in the coming weeks. There are 2 possible zones I would like to see Gold sell off from:
Zone 1: $3,356 - $3,340 (CMP)
Zone 2: $3,406 - $3,426
Being patient, with no current sells. This analysis is just my current theory. If $3,450 (Wave 2 high) is taken out, then we are heading towards $3,600+

Gold Price Analysis July 14Gold confirmed a break above the key 3330 level on Friday, opening a clear uptrend. The reaction at the 3368 GAP zone further strengthens the current bullish momentum. With the current market structure, the bias is leaning towards buying on corrections around support zones.
🔍 Technical levels to watch:
Support: 3345 – 3331 (potential buying zone)
Resistance: 3387 – 3400 (bullish target)
📌 Trading strategy:
BUY Trigger 1: Price tests and rejects the 3345 support zone
BUY Trigger 2: Buy around 3331 – strong support zone
🎯 Target: 3400
The current trend favors a buying strategy on reasonable price correction conditions. It is necessary to monitor price action around support zones to confirm effective entry points.
BUY MODE ACTIVATEDbuy gold when it retests 3351 midpoint of ob kindly trade asper ur money management


Beware of the market's trap of luring more investors, short 3335Regarding recent trading strategies, I believe you have also seen my trading win rate. I often inform the future trend of gold several hours or even days in advance, because my many years of trading experience have made me an excellent poisonous wolf in the trading market. Now I see a lot of bullish voices in the market, but my wolf’s sense of smell has discovered danger signals. In the short term, I think that without the influence of news, the market needs to digest the overbought momentum of the bulls. From the 4H chart, the middle track of the Bollinger Band is at 3332, which is very close to the strong support of 3330 given by us during the day. Therefore, I think that at least within 4 hours, gold will fall back to test the support below 3340-3330, or even 3320. Since most people want to follow the crowd, let them go. They will only fall into the trap set by the market. Let's prove with facts whether following the wolf pack will make you hungry or well fed.
OANDA:XAUUSD

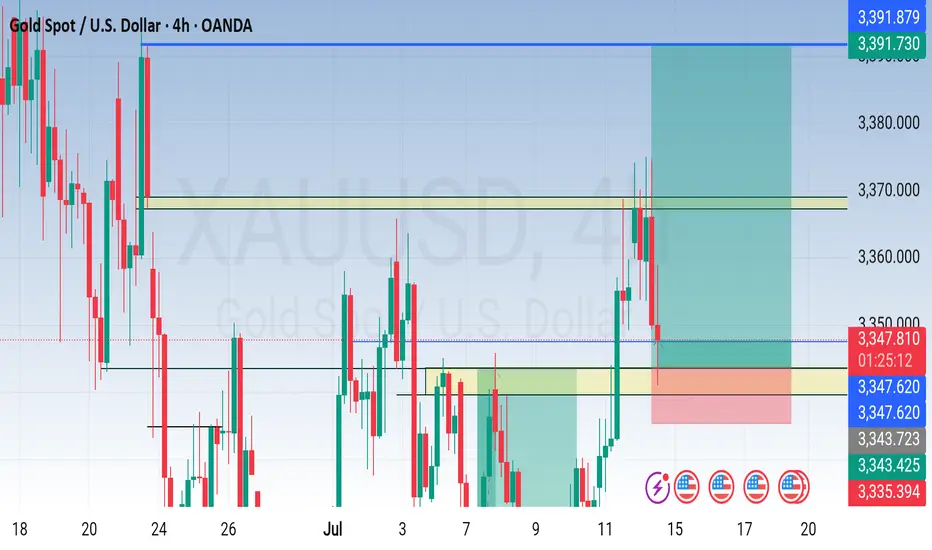
XAUUSD Long OpportunityXAUUSD is bullish per the 4 hour and 1 hour timeframe with continued bullish momentum coming out of the fundamentals around tariff uncertainty. There is clear bullish market structure.
XAUUSD is currently sitting on the pivot level of $3350 (Resistance turned support) after a retracement prior for the NY opening bell which gives rise for a long opportunity from this level towards the next Pivot point at $3391.
On the hour timeframe, price is trading above the 50 and 200 SMA and is currently sitting upon the 21 SMA which XAUUSD has used push point from in the past trending markets. RSI is currently sitting in a sweet spot region of the RSI between 45-55 indicating this is a valid retracement and price is looking to turn bullish again soon.
This provides 4 points of Bullish confluence within the momentum in favour of further bullish movements

XAUUSD - GOLD TO UP and never back down.never say never.
Due to the current and near-future military and political developments, gold will maintain its upward trend for a long time, and any short position will only be a temporary correction.
The impact of tariffs continues, shorting is expected to retrace📰 News information:
1. Focus on tomorrow's CPI data
2. Bowman's speech at the Federal Reserve
3. Tariff information outflows and countries' responses to tariff issues
📈 Technical Analysis:
During the weekend, the Trump administration's tariff information continued to come out, causing a large amount of funds to flow into the safe-haven market, triggering an escalation of market risk aversion. Although the collapse in the previous tariff remarks did hit the market's buying enthusiasm to a certain extent, the strong rise on Friday also stimulated the market's buying enthusiasm again. This, whether it is on the way down or on the way up, has attracted retail investors to a certain extent. As we judged on gold on Friday and the weekend, short-term bulls are undoubtedly strong. However, I think it is very dangerous to continue to chase long positions at high levels. Therefore, I tend to short-term and then consider continuing to chase long positions after the market retreats to the support level.
First of all, the CPI data will be released tomorrow. With inflation in the United States currently heating up, the Federal Reserve is undoubtedly resisting a rate cut in July. This has, to some extent, dampened the enthusiasm of bulls. Secondly, it is necessary to pay attention to the response of Europe and Japan to the tariff issue. Due to the timeliness, the current market expectations are undoubtedly limited.
In the short term, the RSI indicator is already seriously overbought. For today's operation arrangement, it is recommended to short at the rebound of 3365-3375. If the gold price continues to maintain a strong trend in the short term and breaks through this resistance area, it is time to stop loss. First of all, we should pay attention to whether 3355-3345 can be broken. Once it falls below the support of 3355-3345, we will need to see the 3330 line below, and it may even fall below 3300. Therefore, we also need to take precautions and follow up.
🎯 Trading Points:
SELL 3365-3375
TP 3355-3345
In addition to investment, life also includes poetry, distant places, and Allen. Facing the market is actually facing yourself, correcting your shortcomings, facing your mistakes, and exercising strict self-discipline. I share free trading strategies and analysis ideas every day for reference by brothers. I hope my analysis can help you.
FXOPEN:XAUUSD TVC:GOLD FX:XAUUSD FOREXCOM:XAUUSD PEPPERSTONE:XAUUSD OANDA:XAUUSD