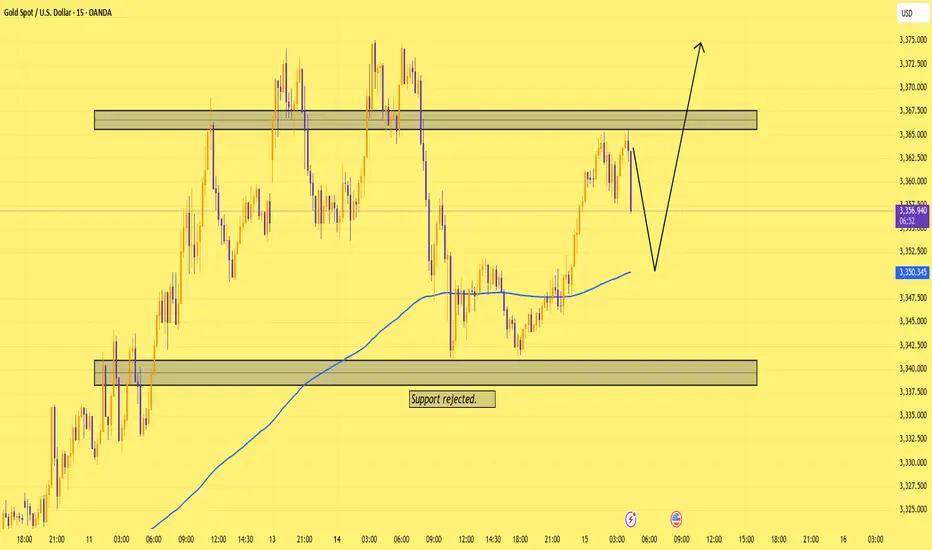
Gold At 3350? That’s Where I Make My MoveOur last trade on this pair was well played by the market.
Right now, the primary trend remains bullish.
We’re in a sequence of higher highs and higher lows.
But from current levels, the risk/reward ain’t it.
I’d rather wait for a dip—ideally around 3350, where we’ve got solid support.
No rush. The cleanest entries come to those who wait.
(Tomorrows news data could affect this trade)
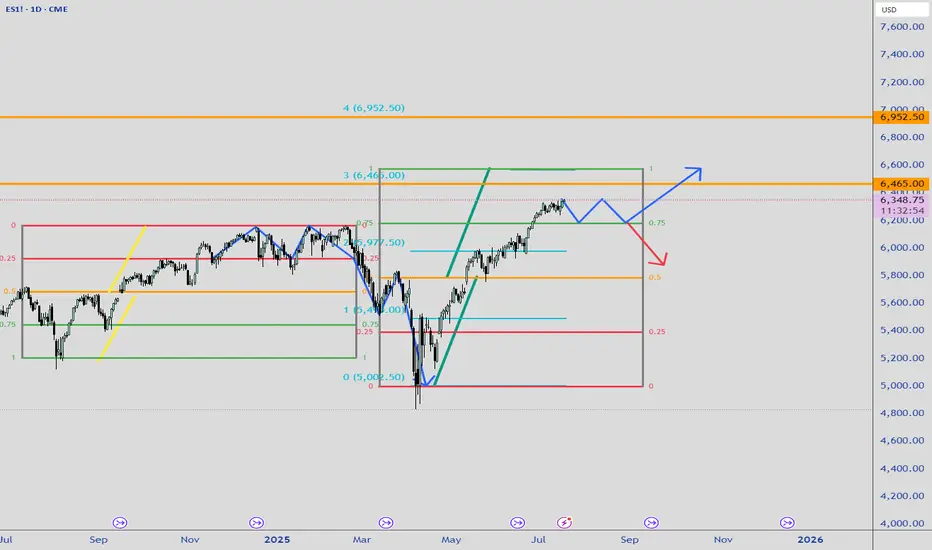
Futures market
Markets are on rise and wait for retestMarkets are on rise, and on daily time frame price is just rising high from 20 ema. Shows strong bullish momentum on rise.
As per order flow, we can see positive delta formation, on the zone 3350 levels.
Buy side is probably on cards.

Market Structure (Education) Using Market Structure & Optimal Trade Entry (OTE)
- The current M15 swing structure is bullish .
- A Market Structure Shift (CHoCH/MSS) from bullish to bearish signals a potential short-term reversal.
- After this shift, anticipate a pullback to the Optimal Trade Entry (OTE) zone , typically between the 0.62 and 0.79 Fibonacci retracement levels.
- Once price reaches the OTE zone , expect a reaction or pullback toward the previous swing high , aligning with bullish continuation.
---
🔍 Key Concepts Referenced
- CHoCH (Change of Character) : Indicates a shift in market sentiment or structure.
- BOS (Break of Structure) : Confirms directional bias.
- OTE Zone : A high-probability area for entries during retracements, often between 62%–79% Fibonacci levels.
- Swing High/Low : Reference points for market structure and potential targets.

ES! Daily LookWe are still in Mid-month of July and Markets is still strongly bullish. A retracement to previous pivots before completing the symmetry might be a high probability case here. Let see how it turn on in the next few days.
XAUUSD
XAUUSD Updated in 15M :
The gold signal is marked on the chart based on the latest price changes and the supply and demand in the market. These points include the entry point, stop loss, and take profit


Gold Spot / U.S. Dollar (XAU/USD) 4-Hour Chart - OANDA4-hour chart displays the price movement of Gold Spot (XAU) against the U.S. Dollar (USD) from late July to early August 2025. The current price is 3,390.266, with a recent decrease of 10.870 (-0.32%). Key levels include a sell price of 3,336.420 and a buy price of 3,337.020, with a resistance zone highlighted between 3,340.720 and 3,380.000, and a support zone around 3,314.186. The chart includes candlestick patterns and trading indicators.


XAUUSD GOLD – Entering a Power Phase Toward All-Time Highs
XAU/USD is showing a clear bullish continuation pattern after holding strong above the $2,360 support zone. With the DXY breaking down, real yields slipping, and central banks continuing record purchases, gold remains in a perfect storm setup for further upside.

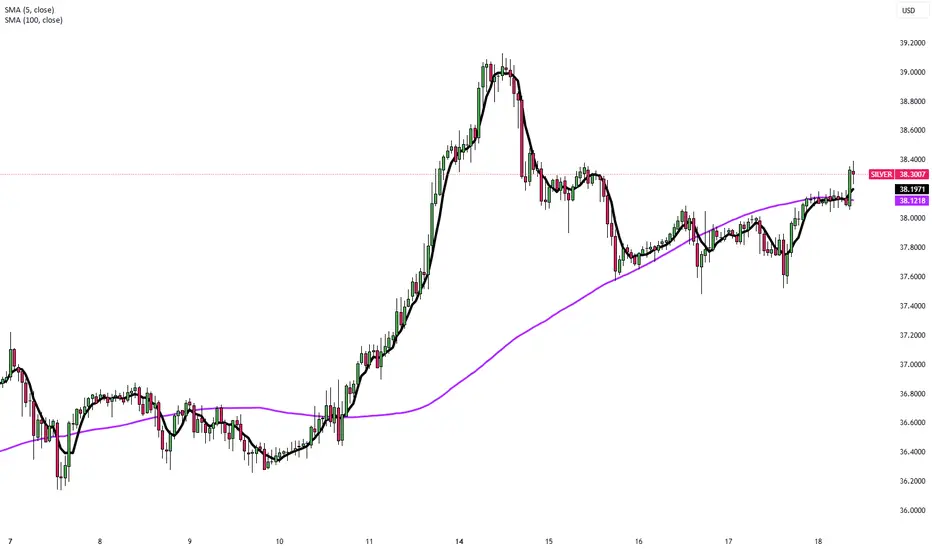
Silver Rebounds Toward $38 as Dollar EasesSilver rebounded toward $38 per ounce on Friday, recovering from a two-day decline as the U.S. dollar and Treasury yields eased. The move reflected shifting sentiment on Fed policy and trade conditions after earlier losses sparked by inflation data that reduced hopes for near-term rate cuts.
U.S. stock futures edged higher following record closes for the S&P 500 and Nasdaq, driven by strong retail sales, lower jobless claims, and optimism in AI-related tech stocks after Taiwan Semiconductor’s positive forecast. On monetary policy, Fed officials remain divided: Mary Daly expects two rate cuts this year, while Adriana Kugler urges caution due to tariff-driven inflation. President Trump reinforced trade tensions by sending letters to over 20 partners setting new tariffs between 20% and 40%.
In corporate updates, United Airlines expects stronger earnings in the second half of 2025, and Chevron signaled higher future cash flow as production in its top U.S. oil field nears a plateau.
Resistance is at 38.50, while support holds at 37.20.
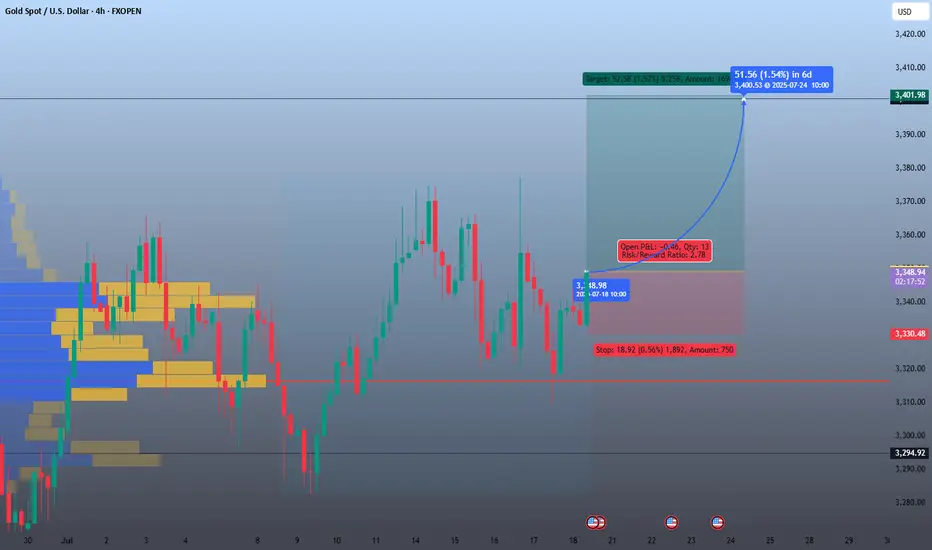
Buy Opportunity📊 Trade Overview:
Entry Price: 3,348.98
Stop Loss: 3,329.48 (-0.57%, -18.92 pts)
Take Profit Target: 3,400.63 (+1.54%, +51.65 pts)
Risk-to-Reward Ratio: 2.78
Volume Profile shows a strong support base at the entry zone
🟩 Bullish View Justification:
Support Zone: Price is rebounding from a high-volume node on the volume profile (yellow zone).
MACD Histogram: Green build-up = Bullish momentum increasing.
Candlestick Formation: Possibly forming higher lows (accumulation pattern).
Risk/Reward: High R:R ratio >2.5 suitable for swing setup.
XAUUSD
XAUUSD Updated in 15M :
The gold signal is marked on the chart based on the latest price changes and the supply and demand in the market. These points include the entry point, stop loss, and take profit

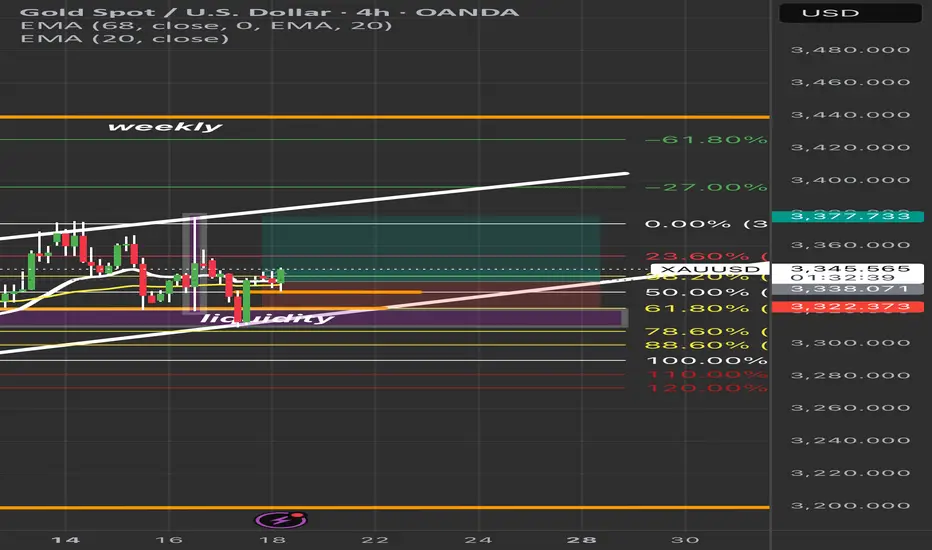
Bullish XAUUSD 4H Update
Price is holding above the key liquidity zone and bouncing near the 61.8% Fib retracement. Watching closely for a continuation toward 3,377 (0% Fib level) if structure holds. EMA alignment suggests potential short-term bullish momentum, but a break below 3,322 invalidates this bias.
📌 Key Levels:
• Entry Zone: 50%-61.8% Fib
• Target: 3,377
• Invalidation: 3,322
XAUUSD ANALYSIS – JULY 18XAUUSD ANALYSIS – JULY 18: STRATEGY BASED ON FIBONACCI, TRENDLINE & STRUCTURE
1. XAUUSD Technical Overview (4H Chart)
Gold (XAUUSD) is currently trading around 3,343 USD, showing signs of a slight rebound from key support. On the 4H timeframe, the price structure is forming higher lows, maintaining above a short-term rising trendline – a technically bullish signal.
2. Key Support & Resistance Zones
Immediate Supports:
3,338 USD: aligning with the 0.618 Fibonacci retracement – a zone tested multiple times.
3,333 – 3,335 USD: strong support, overlapping with EMA and rising trendline.
3,327 USD: previous swing low – last defense for the bullish structure.
Immediate Resistances:
3,345 – 3,346 USD: frequently rejected zone in recent sessions.
3,350 USD: psychological and technical resistance.
3,358 USD: recent swing high – breakout confirmation level.
3. Price Action & Fibonacci Confluence
Price is currently hovering between Fibo 0.5 (3,343 USD) and Fibo 0.618 (3,338 USD) – a potential bounce zone if bullish momentum holds.
The pullback from 3,358 to 3,286 has respected standard Fibonacci retracement levels, confirming technical price behavior.
4. Trendline Analysis
The ascending trendline from the 3,275 USD low remains intact, providing solid dynamic support.
If the price continues to bounce from this trendline, it may form a bullish continuation pattern (flag/pennant).
5. Suggested Trading Strategies
Long
Entry: 3,338 – 3,340 USD
SL: 3,327 USD
TP: 3,345 – 3,350 – 3,358 USD
Note: Buying the dip near Fib & trendline
Short
Entry: Below 3,327 USD (breakdown)
SL: Above 3,340 USD
TP: 3,310 – 3,298 USD
Notes: Only if price breaks trendline & support
6. Supporting Technical Indicators
EMA20/EMA50 show slight upward momentum – early bullish bias.
RSI (14) hovers near 50 – neutral zone, awaiting breakout confirmation.
Conclusion:
Gold is consolidating around a critical support zone. The short-term bias leans bullish if the 3,338 – 3,333 USD region holds and price breaks above 3,346 – 3,350 USD.
This is a key moment to position early using Fibonacci and trendline confluence.
👉 Follow for more strategies in upcoming sessions. Save this if you find it useful!
Do you have a different view? Share your thoughts in the comments below!

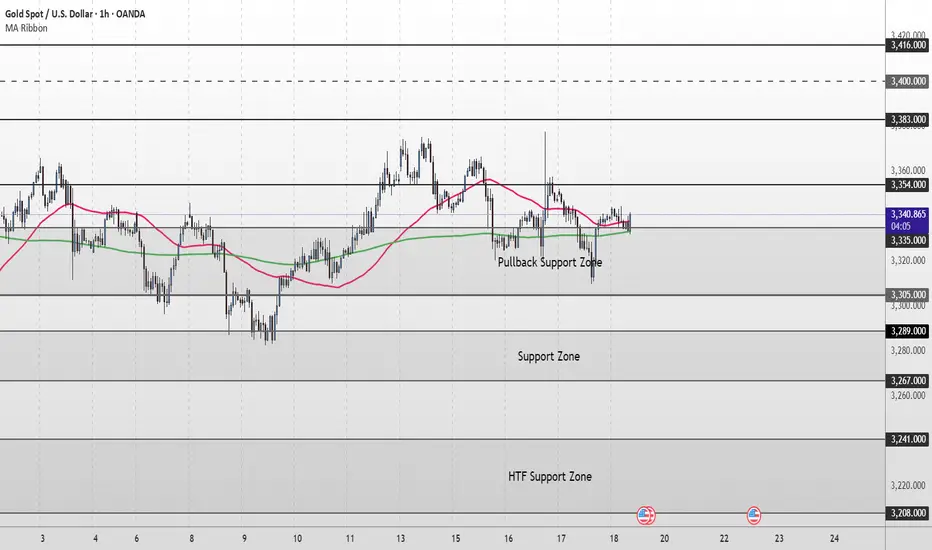
Gold Short Term Outlook Gold has held above the Pullback Support Zone (3,335–3,305) after yesterday’s volatility, with buyers stepping in to defend the zone.
Price is now trading around 3,338, caught between the 50MA and the 200MA.
Despite the recent dip, the structure remains supportive as long as price holds above 3,335.
A clean break and hold above 3,354 would confirm renewed bullish momentum, opening the path toward 3,383 and 3,400, with 3,416 as a higher‑timeframe target.
If price fails to clear 3,354 and turns lower again, watch for signs of exhaustion back into the Pullback Support Zone (3,335–3,305).
A decisive break below 3,305 would shift focus to the Support Zone (3,289–3,267), with further downside exposing the HTF Support Zone (3,241–3,208).
📌 Key Levels to Watch
Resistance:
‣ 3,354 ‣ 3,383 ‣ 3,400 ‣ 3,416
Support:
‣ 3,335 ‣ 3,305 ‣ 3,289 ‣ 3,267 ‣ 3,241
🔎Fundamental Focus
📌 4:00pm: UoM Sentiment & Inflation Expectations – can spark sharp USD/gold moves.
➡️ Expect volatility around releases.
Gold bullish bias (18th july 2025)Daily is reacting from a bullish BOS. 4H shows strong rejection from a 4H BOS — confirming a bullish bias. Currently expecting a 15M CHOCH in this area. However, if no CHOCH forms here, treat it as a retracement and watch for another 15M CHOCH lower — all the same scenarios and targets will still apply.
For BUYS (Scenario 1 – Impulse + Retest):
1️⃣ 15M makes a clean bullish move to 3345.747.
2️⃣ Price retests the broken level.
3️⃣ Form a 1/3M bullish CHOCH + BOS, then BUY toward 3360.072.
For BUYS (Scenario 2 – Structure Flip Entry):
1️⃣ 15M forms a bullish CHOCH + BOS (expected in the current zone).
2️⃣ Retest the BOS zone.
3️⃣ Enter on a 3/5M bullish engulfing or 1/3M confirmation CHOCH, then BUY toward 3360.072.
For SELLS (Scenario 3 – Bullish Failure & Reversal):
1️⃣ 15M forms a BOS, but is invalidated by a 15M momentum candle close below.
2️⃣ Price retests the broken BOS.
3️⃣ Use 2/3M bearish confirmation (CHOCH or BOS) to SELL toward 3313.808.
🔁 NOTE:
📌 A 15M CHOCH is expected in this zone. If it fails to form, it’s likely a retracement.
🔍 Watch for a new 15M CHOCH to form lower — all same entry principles and targets still apply.

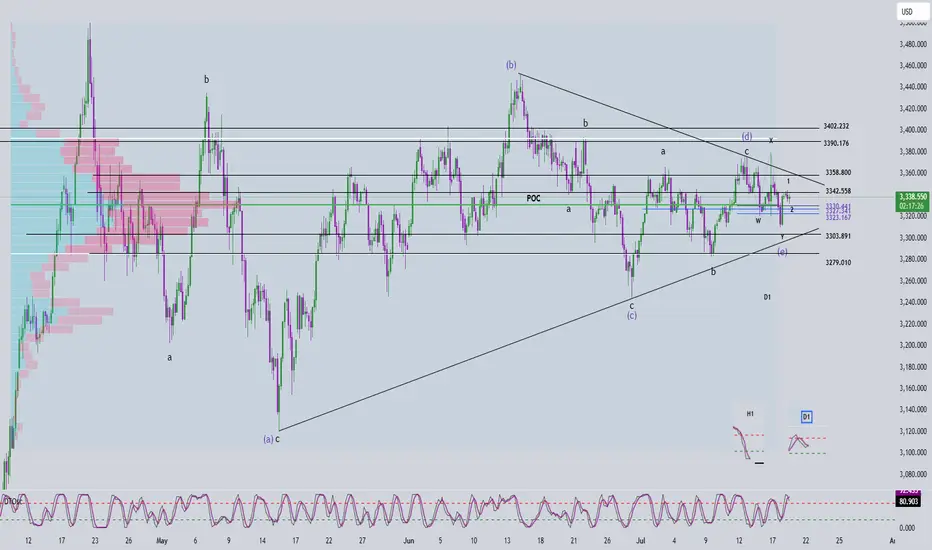
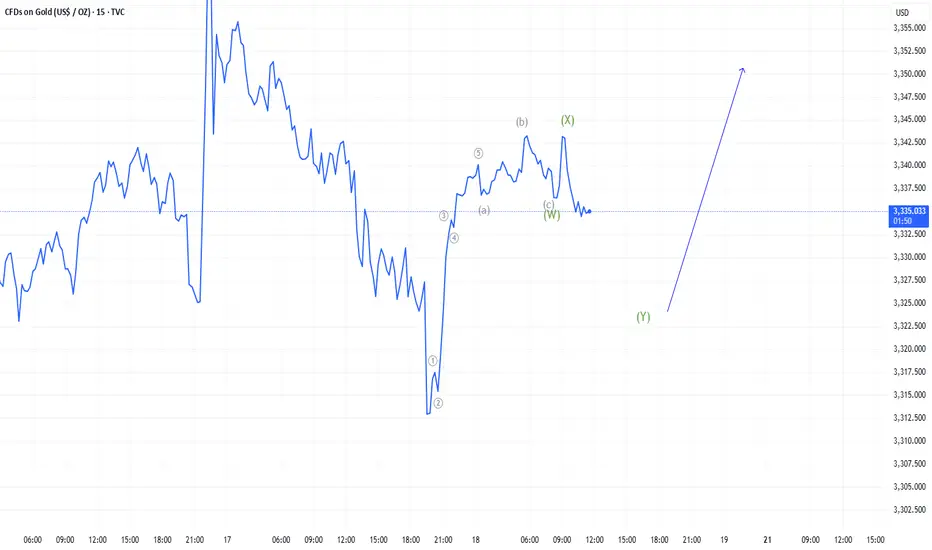
Elliott Wave Analysis – XAUUSD July 18, 2025📈 Elliott Wave Analysis – XAUUSD July 18, 2025
🔍 Momentum Analysis
D1 Timeframe: Momentum is showing signs of a bullish reversal. While we need to wait for today's D1 candle to close for confirmation, it's likely that yesterday’s upward move marks Wave 1, signaling the beginning of a new bullish trend.
H4 Timeframe: Momentum is preparing for a bearish reversal → suggesting a potential corrective pullback, likely forming Wave 2.
H1 Timeframe: Momentum is about to reverse upward → supporting the expectation of a short-term bullish move during the current session.
🌀 Elliott Wave Structure Update
On the H4 chart, the abcde triangle correction structure remains largely unchanged.
However, a strong H4 bullish candle appeared yesterday, indicating unusual market behavior that deserves attention.
There are two main scenarios:
- Wave 1 (black) has already completed, and the market is now entering Wave 2 correction.
- Alternatively, the current movement could be Wave 4 within Wave 1 (black).
🔎 Combining Momentum & Wave Structure
- With D1 momentum signaling a potential uptrend lasting the next 4–5 days, it suggests that Wave e (blue) may have completed.
- This opens the door for an impulsive 5-wave advance. Specifically:
+ If H1 continues its bullish reversal, the current move could be Wave 5 of Wave 1 (black), targeting the 3358 level.
+ Afterwards, a retracement toward the 3330–3323 zone would form Wave 2 (black).
+ Alternatively, price might drop directly to 3330–3323, implying Wave 1 has already finished and the current move is Wave 2.
🎯 => Both scenarios converge at the 3330–3323 price zone, making it a high-probability BUY ZONE.
🧭 Trade Plan
BUY ZONE: 3330 – 3327
Stop Loss: 3320
Take Profits:
TP1: 3342
TP2: 3358
TP3: 3402
📌 Note: Since this is a relatively wide entry zone, it's best to wait for price action confirmation at this level before entering.
BullsA new all time high 3500 is on the horizon. We have been on a trendline(1 Day) resistance region. A buy towards the target is the goal.
NB break below invalidates this analysis

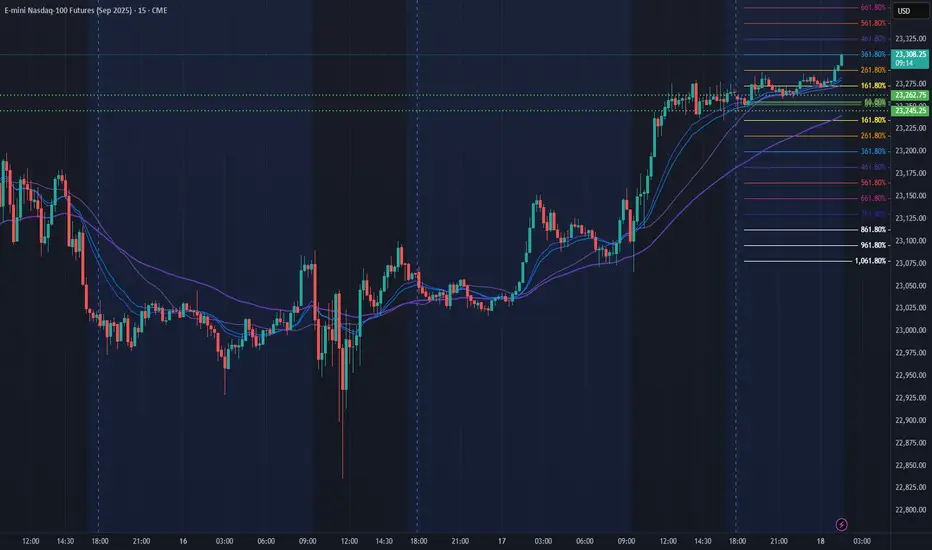
NQ Power Range Report with FIB Ext - 7/18/2025 SessionCME_MINI:NQU2025
- PR High: 23262.75
- PR Low: 23245.25
- NZ Spread: 39.0
No key scheduled economic events
Pushing ATH through overnight hours
Session Open Stats (As of 1:15 AM 7/18)
- Session Open ATR: 272.56
- Volume: 18K
- Open Int: 286K
- Trend Grade: Neutral
- From BA ATH: -0.0% (Rounded)
Key Levels (Rounded - Think of these as ranges)
- Long: 23811
- Mid: 22096
- Short: 20383
Keep in mind this is not speculation or a prediction. Only a report of the Power Range with Fib extensions for target hunting. Do your DD! You determine your risk tolerance. You are fully capable of making your own decisions.
BA: Back Adjusted
BuZ/BeZ: Bull Zone / Bear Zone
NZ: Neutral Zone
3Up-3Dn NQ Hits New High May PullbackLast night NQ trended up then sideways for the rest of the day. Markets wants to hit new high but may pullback a little bit before going higher. We are still in a Bull Market so small pullback is still healthy.

Gold (XAU/USD) Premium Technical Outlook - 18 July 2024As gold continues to trade near record highs, the market’s current price action around $3,336–3,340 demands a sharp, disciplined technical view. This premium analysis combines price action, Fibonacci techniques, institutional concepts (ICT and Smart Money Concepts), and advanced supply–demand dynamics to identify actionable trade opportunities.
We anchor on the 4-hour timeframe for directional bias and zoom into the 1-hour chart for precision intraday setups.
📊 4‑Hour Timeframe: Structure and Directional Bias
Gold remains in a clear bullish structure on the 4-hour chart, as evidenced by sustained higher highs and higher lows. The most recent bullish Break of Structure (BOS) occurred above the $3,320–3,325 level, confirming buyers’ control for now.
Currently, price hovers near equilibrium at the 61.8% Fibonacci retracement, testing prior resistance as potential support. This zone aligns with a small fair value gap (FVG), reinforcing it as an area of interest for smart money participants.
Key 4H Levels to Watch
Level Significance
$3,360–3,365 Major supply zone & bearish OB
$3,350–3,355 Minor resistance
$3,337–3,340 61.8% Fib / equilibrium
$3,330–3,333 BOS retest & key support
$3,300–3,310 Strong demand zone & bullish OB
$3,285–3,295 Secondary demand zone below BOS
The directional bias on 4H remains neutral-to-bullish, contingent on price holding above $3,300. A clean break and close above $3,360 could open a path to $3,400–3,420, while a sustained drop below $3,300 would mark a change of character (CHOCH) and shift bias to bearish.
🪙 Institutional Concepts in Play
Order Blocks (OB): Strong bullish OB sits at $3,300–3,310, while a bearish OB dominates at $3,355–3,365.
Fair Value Gaps (FVG): On the bullish side, $3,300–3,315 remains unfilled; on the bearish side, $3,330–3,345 caps rallies.
Liquidity Grabs: Dips toward $3,295–3,300 appear to sweep sell-side liquidity, while spikes above $3,360 tap into resting buy stops.
The area around $3,330 remains a key battleground where smart money likely accumulates positions before the next impulsive move.
⏳ 1‑Hour Timeframe: Intraday Trade Setups
On the 1-hour chart, the market is compressing between a bullish order block and bearish supply. Price action shows evidence of short-term liquidity sweeps and reactions to imbalances, offering two clear scenarios for intraday traders.
📈 Setup A – Bullish Zone Bounce
Entry: Buy limit at $3,332–3,333
Stop-loss: Below $3,328
Take-Profit 1: $3,345
Take-Profit 2: $3,355
Rationale: Confluence of 4H demand, Fib retracement, BOS retest, and 1H bullish order block.
📉 Setup B – Supply Rejection Short
Entry: Sell limit at $3,355–3,360
Stop-loss: Above $3,365
Take-Profit 1: $3,337
Take-Profit 2: $3,330
Rationale: Price into 4H bearish OB, aligning with supply and stop runs above recent highs.
🌟 The Golden Setup
Among these, the Bullish Zone Bounce at $3,332–3,333 stands out as the highest-probability trade. This level represents maximum confluence:
Retest of 4H BOS.
Bullish OB on 1H.
61.8% Fibonacci support.
Unmitigated fair value gap.
This setup offers a favorable risk–reward profile with clear invalidation and multiple upside targets.
🔎 Summary Table
Bias Key Support Zones Key Resistance Zones
Neutral-to-bullish $3,300–3,310, $3,330–3,333 $3,350–3,355, $3,360–3,365
Intraday Setups Entry Zone Stop-Loss Take-Profit Targets
Bullish Zone Bounce 🌟 $3,332–3,333 < $3,328 $3,345 / $3,355
Supply Rejection Short $3,355–3,360 > $3,365 $3,337 / $3,330
📣 Final Word
Gold maintains a structurally bullish outlook above $3,300, with strong institutional footprints evident in the $3,300–3,333 demand zones. Traders should remain vigilant around $3,360, where sell-side liquidity and supply are concentrated.
The Golden Setup — a bullish bounce from $3,332 — offers the best confluence and statistical edge intraday.

Gold Market Reacts to 3377 Mitigation — Eyes on 3388 Amid Job DaGold market mitigated the 3377 level, pushing price down to sweep imbalance at 3320’s. With the daily demand candle formation holding, a rejection here could ignite a push to take out full liquidity at 3388.
As we approach the unemployment claims release (forecast: 233k), market sentiment leans toward a hawkish gold reaction—should data indicate more jobs are needed, the bullish pressure on gold could intensify. follow for more insights, comment , and boost idea
