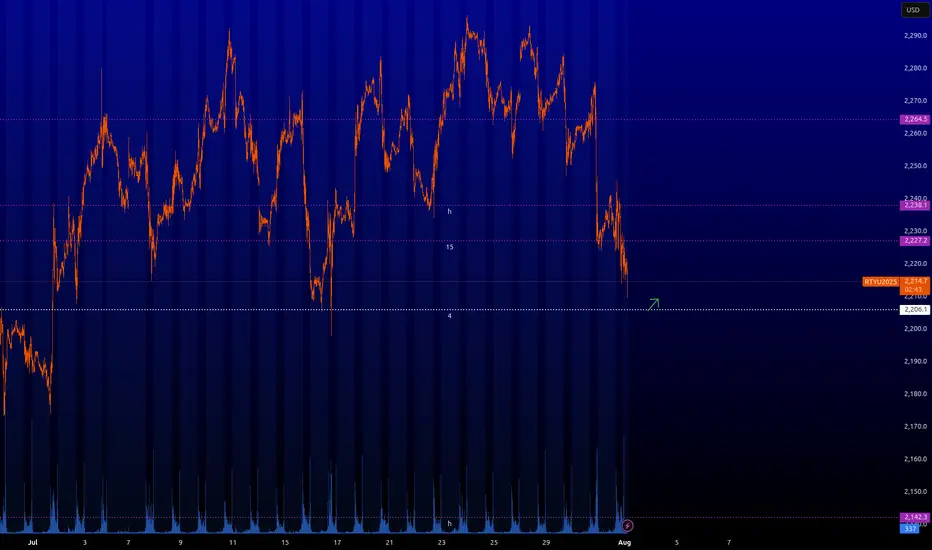
RTY : Key levelsHere are the key levels that the market will be interested in. From ~2.206 you can take scalping longs. Also interesting longing levels are forming now. I will let you know when they are formed and when they will be in play.
⚠️ VOLATILITY WARNING ⚠️
Trading around major news can be extremely unpredictable. Trade responsibly!
Futures market
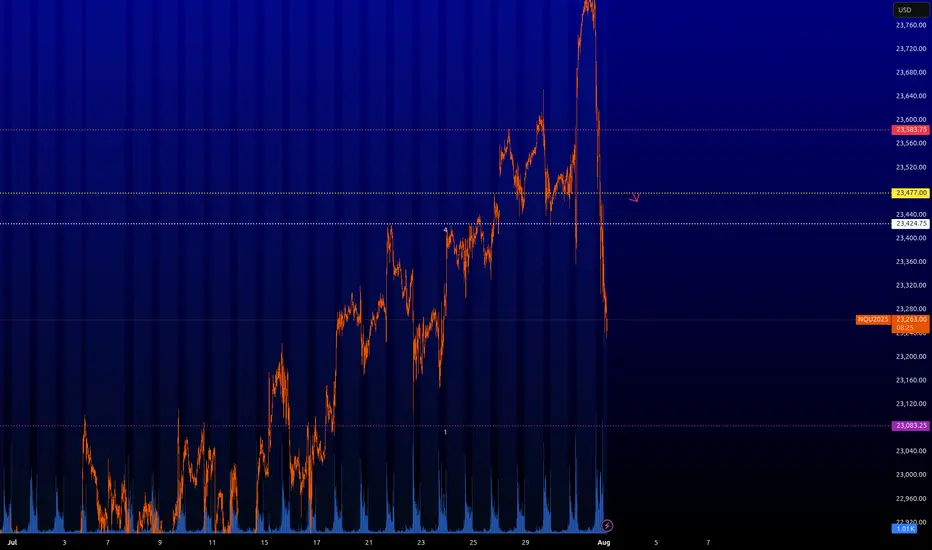
NQ : Key levelsHere are the key levels that the market will be interested in. From the yellow level ~23.477 you can already look for shorting trades. However, I would be careful with shorts on US indices. The other levels are still risky for limit order trading.
⚠️ VOLATILITY WARNING ⚠️
Trading around major news can be extremely unpredictable. Trade responsibly!
XAUUSD: Correction in Progress, Patience is Key for the Success GOLD (XAUUSD) -Monthly Analysis & Trading Plan (Aug 2025)
Title: XAUUSD: Correction in Progress, Patience is Key for the Next Move
**Chart:** XAUUSD Monthly (1M)
**Analysis Type:** ICT/SMC, Price Action, & Moving Average
Summary:
After a historic and powerful bull run that saw Gold (XAUUSD) breach all-time highs in the first half of 2025, the market has entered a significant corrective phase. The massive red candle in June signaled a strong reversal of momentum, and the current July candle confirms that sellers remain in control, albeit with less intensity. This is a critical juncture for long-term traders, and a strategic approach is required.
**Key Observations & Analysis:**
1. **Price Action & Market Structure:** The move from late 2024 through May 2025 was a textbook "impulsive leg." The sharp reversal in June 2025, with a powerful bearish candle, likely acted as a **liquidity grab** or a **high-volume distribution event**, trapping late buyers. The market is now in a clear **break in market structure (BOS)** to the downside on this long-term timeframe, suggesting the correction is not over.
2. **ICT/SMC Concepts:**
* **Imbalance/Fair Value Gap (FVG):** The rapid bullish move created significant imbalances on the monthly chart. Price often returns to fill these gaps. The current correction is likely heading to fill or test these inefficiencies.
* **Order Block (OB):** The massive bullish move in late 2024/early 2025 likely created a strong bullish order block. The current sell-off is heading toward this potential institutional demand zone.
* **Liquidity:** The lows from late 2024 and early 2025 will be key liquidity pools. Smart money will likely be targeting these areas for a potential reversal or accumulation.
3. **Moving Average Analysis (MMA):**
* The price is currently trading above both the purple and yellow moving averages, which are still pointing upward. This confirms the long-term trend remains bullish, and the current move is a correction within that trend.
* The **purple moving average** is a key support level to watch. A test of this level would be a high-probability event, and its reaction will be crucial for the next major move.
**Suggested Entry & Exit Levels:**
**1. Aggressive Entry (Short):**
* **Rationale:** The bearish momentum, though slowing, is still the dominant force. An aggressive trader could look for a continuation of the short-term bearish trend.
* **Entry:** A short entry could be considered on a pullback to the recent highs around **$3,400 - $3,500** if a strong bearish candlestick pattern forms on a lower timeframe (e.g., weekly or daily).
* **Stop Loss:** A tight stop-loss placed just above the recent high, for example, **$3,600**. This is a high-risk entry, so position sizing should be small.
* **Target:** The first major target would be the **moving average support level**, roughly in the **$3,000 - $3,100** zone. The ultimate target for a full correction would be the order block from late 2024, around **$2,800**.
**2. Conservative Entry (Long):**
* **Rationale:** The long-term trend is still bullish. The current move is a correction. The most prudent approach is to wait for a high-probability long entry at a key support level.
* **Entry:** Wait for price to reach the **purple moving average support zone (around $3,000 - $3,100)**. Look for a clear reversal signal on this level, such as a large bullish "pin bar" or "engulfing candle" on the monthly or weekly chart. This would be a high-probability demand zone for a reversal.
* **Stop Loss:** A stop-loss should be placed below this key support level, perhaps around **$2,850 - $2,900**, giving the trade room to breathe.
* **Target:** The first target for a new bullish leg would be the recent swing high around **$3,800**. The ultimate long-term target would be a new all-time high above **$4,000**.
Conclusion
The Gold market is in a crucial phase. The bullish party from earlier in 2025 is over for now, and a healthy correction is underway. **The most logical and safe approach is to wait for the market to complete its corrective move.** Do not attempt to catch a falling knife. Instead, be patient and wait for price to reach a key institutional demand zone (our moving average support or the late 2024 order block) and show a clear sign of reversal. This will present a high-probability, low-risk long entry for the next impulsive move up.
Disclaimer
This is not financial advice. Please perform your own due diligence and risk management. Trading involves a significant risk of loss.

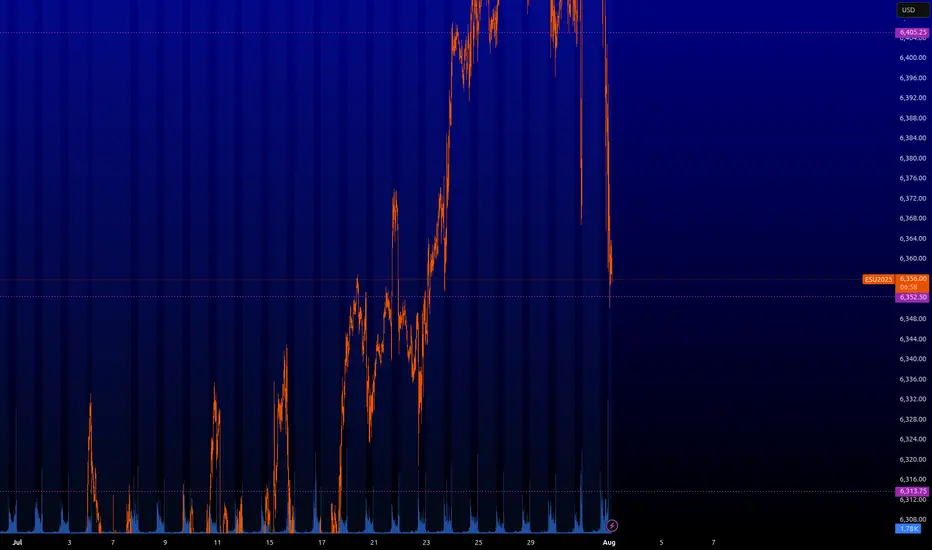
ES : Key levels⚠️ VOLATILITY WARNING ⚠️
Trading around major news can be extremely unpredictable. Trade responsibly!
Here are the key levels that the market will be interested in. So far, the green level of ~6.263 is likely to bounce, but it is old. I'd wait for something fresher.
From the minor timerframe, we can soon go long from ~6.352. If I'm at my computer and everything works out at this level as it should, I'll let you know.
XAU USD LONG RESULT Price broken down both of our supports Trendline and zones without filling any of the supply zones hitting our SL.
Better Improved Set-ups to come 💪
_THE_KLASSIC_TRADER_.


XAG USD LONG RESULT Silver price consolidated in the symmetrical triangle and on the major Support Trendline until it broke down and dumped hitting our sl.

XAUUSD
XAUUSD Updated in 5M :
The gold signal is marked on the chart based on the latest price changes and the supply and demand in the market. These points include the entry point, stop loss, and take profit

My first take on XAUUSDI see this last fall as a very clear sweep of liquidity (the recent lows. After that i see an impulsive push away from this zone giving me a change of character. Left behind is an FVG on hopurly chart that aligns within the kill zone on my Fibonacci tool. and that is where i would enter. I would expect price to mitigate this FVG. Another confluence is that we created many IFVG's on the way up showing balanced price action. Only one more confluence i would have liked is a HTF order block from the liquidity sweep but only have one on the 5 minute. i will monitor. First tp is that internal liquidity from the move, second tp is the external liquidity where we have had consolidation and a few failed attempts to break above this opening gap fvg. thanks for looking. any comments welcome,

The market is concernedThe structure of the S&P 500 daily chart implies a market that is concerned. Although many of the fundamentals released on Thursday were basically meeting market expectations, there is concern about the impact of the tariffs there is concern about geopolitical factors and there is concern about how the market will absorb Friday's economic numbers. Sellers are here but will they have a reason to follow through to the downside as we go into the weekend.

Silver short term potential correction within a bull marketSilver short term potential correction within a bull market. Either way...
Don't leverage. Buy ETF or physical, and hold.

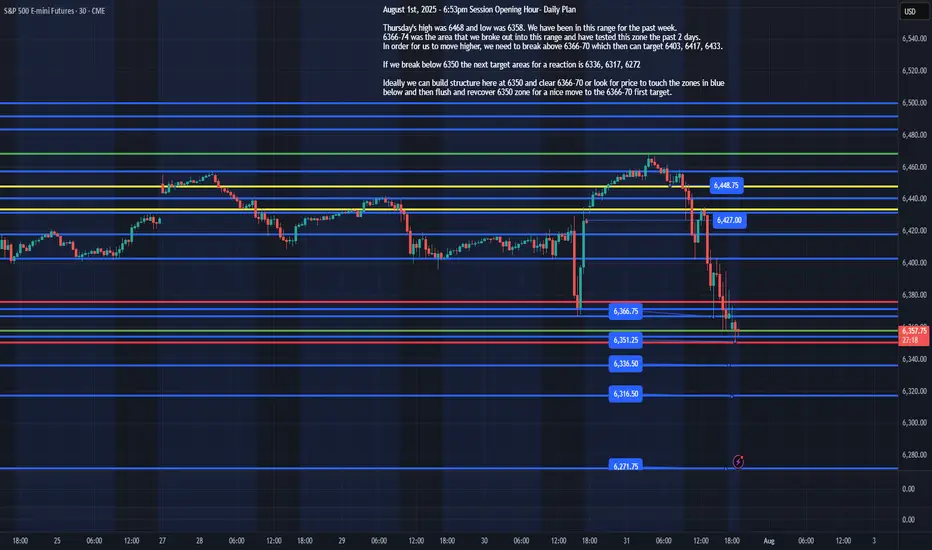
ES - August 1st, 2025 - Session Opening HourAugust 1st, 2025 - 6:53pm Session Opening Hour- Daily Plan
Thursday's high was 6468 and low was 6358. We have been in this range for the past week.
6366-74 was the area that we broke out into this range and have tested this zone the past 2 days.
In order for us to move higher, we need to break above 6366-70 which then can target 6403, 6417, 6433.
If we break below 6350 the next target areas for a reaction is 6336, 6317, 6272
Ideally, we can build structure here at 6350 and clear 6366-70 or look for price to touch the zones in blue below and then flush and recover 6350 zone for a nice move to the 6366-70 first target.
I will update the plan based on overnight price action by 8am EST, Friday August 1st, 2025
S&P 500 (ES1): Post FOMC, Buyers Pushing Back To The Highs!In this video, we will analyze the following FX market for July 31 - Aug 1st.
S&P 500 (ES1!)
In the Weekly Forecast for the S&P 500, we highlighted:
- price is bullish, and expected to go higher. It did move to ATH before pulling back.
- the sell side liquidity under the ascending lows would draw price.... which it did.
- the Area of Fair Value below the lows, with the Demand Zone as the potential level where a
a high probability long could setup.... which was spot on!
Did you benefit from the forecast? Let me hear from you if you did, in the comment section.
Enjoy!
May profits be upon you.
Leave any questions or comments in the comment section.
I appreciate any feedback from my viewers!
Like and/or subscribe if you want more accurate analysis.
Thank you so much!
Disclaimer:
I do not provide personal investment advice and I am not a qualified licensed investment advisor.
All information found here, including any ideas, opinions, views, predictions, forecasts, commentaries, suggestions, expressed or implied herein, are for informational, entertainment or educational purposes only and should not be construed as personal investment advice. While the information provided is believed to be accurate, it may include errors or inaccuracies.
I will not and cannot be held liable for any actions you take as a result of anything you read here.
Conduct your own due diligence, or consult a licensed financial advisor or broker before making any and all investment decisions. Any investments, trades, speculations, or decisions made on the basis of any information found on this channel, expressed or implied herein, are committed at your own risk, financial or otherwise.

XAUUSD
XAUUSD Updated in 5M :
The gold signal is marked on the chart based on the latest price changes and the supply and demand in the market. These points include the entry point, stop loss, and take profit

Close out the Week STRONGLooks like price has found its bottom and is ready to push from here. We are looking for a strong forceful break out from this zone so we can go for the higher levels. Everything looks right from here and value keeps shifting up. I know we should get a solid entry but waiting for it to line up with time.


RTY & YM DOWNMVP SYSTEM
MOMENTUM- The RSI broke below the uptrend line
VOLUME- large volume bearish candle
PRICE - multi top, rounded
ES & NQ also have bearish engulfing candles but the rsi has not broken the uptrend channel. When that occurs, all of the MVP rules will be met for a down position.
So people say not to play the vix but cmon it’s so low right now. If all of the indices break to the downside… a small lotto could be a worthwhile play.

**07/31/25 Trade Journal, and ES_F Stock Market analysis **
EOD accountability report: +
Sleep: 5.5 hours
Overall health: Good
** VX Algo System Signals from (9:30am to 2pm) **
— 9:00 AM Market Structure flipped bullish on VX Algo X3
— 9:30 AM VXAlgo ES X7 Sell signal
— 9:32 AM Bullish market structure got cancelled
— 11:40 AM VXAlgo NQ X1 Buy Signal
— 12:40 PM VXAlgo NQ X1 Sell Signal
— 1:00 PM Market Structure flipped bullish on VX Algo X3!
— 1:22 PM if we lose 6415 and stayy under it . Bullish Market structure is cancelled.
— 1:55 PM VXAlgo NQ X1 Buy Signal
What’s are some news or takeaway from today? and What major news or event impacted the market today?
Today marked the 4th day of the structure signals being iffy as they try to tip the volumes bullish just to cancel it right afterwards.
I was starting to get a bit tilted today as I had a bunch of orders at area that didn't get filled and eventually just gave up trying to have a green day and walked away.
looking at some of the other charts, i also we are getting a doji on the longer time frames and it is starting to look like bear's wet dream.
However, Mag 7 stock earnings were really great, the only downside was rate cut isn't happening.
News
*U.S. STOCKS END LOWER, VIX JUMPS AS S&P 500, NASDAQ RETREAT FROM RECORDS DESPITE MONSTER META AND MICROSOFT EARNINGS
What are the critical support levels to watch?
--> Above 6415= Bullish, Under 6403= Bearish

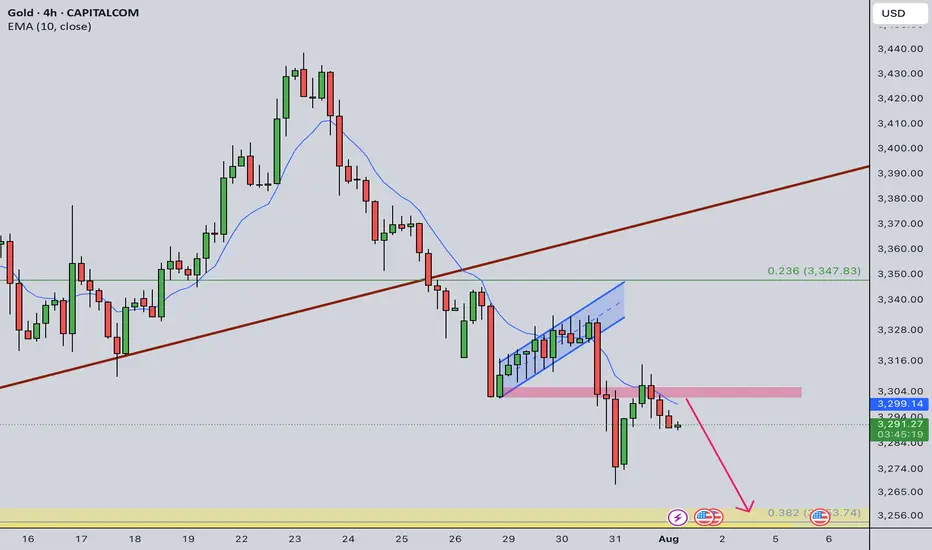
Gold Intraday Trading Plan 8/1/2025Although yesterday's retracement is a bit too deep, I am still bearish in gold in medium term as long as 3333 resistance is not broken. Therefore, I will still look for selling opportunities today.
Currently daily is in green bar while smaller timeframe shows bearish signs. If there is a double top formed near 3300, I will sell toward my weekly target at 3255.
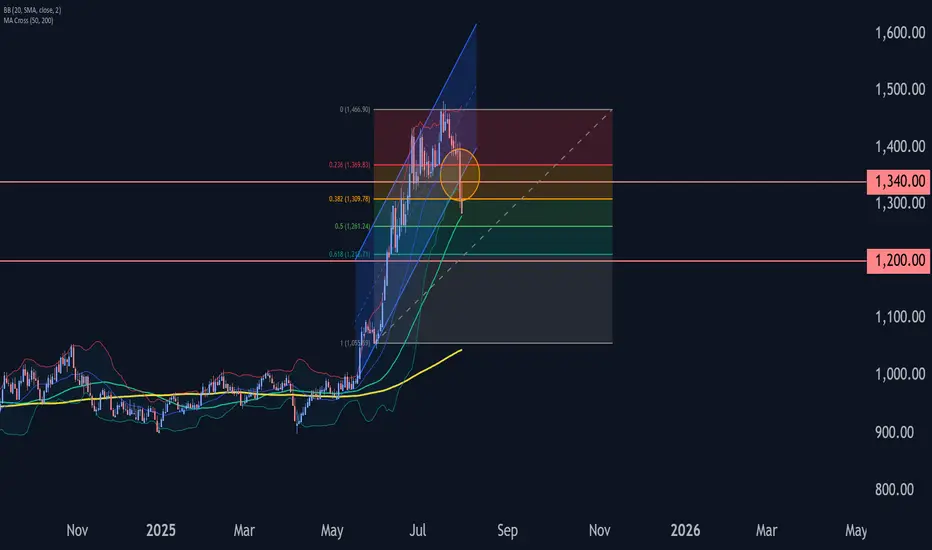
Platinum Wave Analysis – 31 July 2025- Platinum broke support zone
- Likely to fall to support level 1200.00
Platinum recently broke the support zone located between the key support level 1340.00 (low of the previous minor correction iv) and the support trendline of the daily up channel from May.
The breakout of this support zone accelerated the c-wave of the active ABC correction 4.
Given the bearish sentiment across the precious metals markets, Platinum can be expected to fall to the next support level 1200.00 (target for the completion of the active wave c).
Natural Gas Bullish Reversal...Are the Lows in?U.S. natural gas inventories increased by 48 billion cubic feet last week to 3,123 Bcf, increasing the surplus over the five-year average.
Consensus / forecast was 37Billion Cubic feet.
Despite a much higher build than expected Nat gas saw positive price action.
This appears to simply be a dead cat bounce before we go lower.
A death cross on the daily chart has occurred. This signal often results in a small bounce before going lower.

