**07/31/25 Trade Journal, and ES_F Stock Market analysis **
EOD accountability report: +
Sleep: 5.5 hours
Overall health: Good
** VX Algo System Signals from (9:30am to 2pm) **
— 9:00 AM Market Structure flipped bullish on VX Algo X3
— 9:30 AM VXAlgo ES X7 Sell signal
— 9:32 AM Bullish market structure got cancelled
— 11:40 AM VXAlgo NQ X1 Buy Signal
— 12:40 PM VXAlgo NQ X1 Sell Signal
— 1:00 PM Market Structure flipped bullish on VX Algo X3!
— 1:22 PM if we lose 6415 and stayy under it . Bullish Market structure is cancelled.
— 1:55 PM VXAlgo NQ X1 Buy Signal
What’s are some news or takeaway from today? and What major news or event impacted the market today?
Today marked the 4th day of the structure signals being iffy as they try to tip the volumes bullish just to cancel it right afterwards.
I was starting to get a bit tilted today as I had a bunch of orders at area that didn't get filled and eventually just gave up trying to have a green day and walked away.
looking at some of the other charts, i also we are getting a doji on the longer time frames and it is starting to look like bear's wet dream.
However, Mag 7 stock earnings were really great, the only downside was rate cut isn't happening.
News
*U.S. STOCKS END LOWER, VIX JUMPS AS S&P 500, NASDAQ RETREAT FROM RECORDS DESPITE MONSTER META AND MICROSOFT EARNINGS
What are the critical support levels to watch?
--> Above 6415= Bullish, Under 6403= Bearish
Futures market

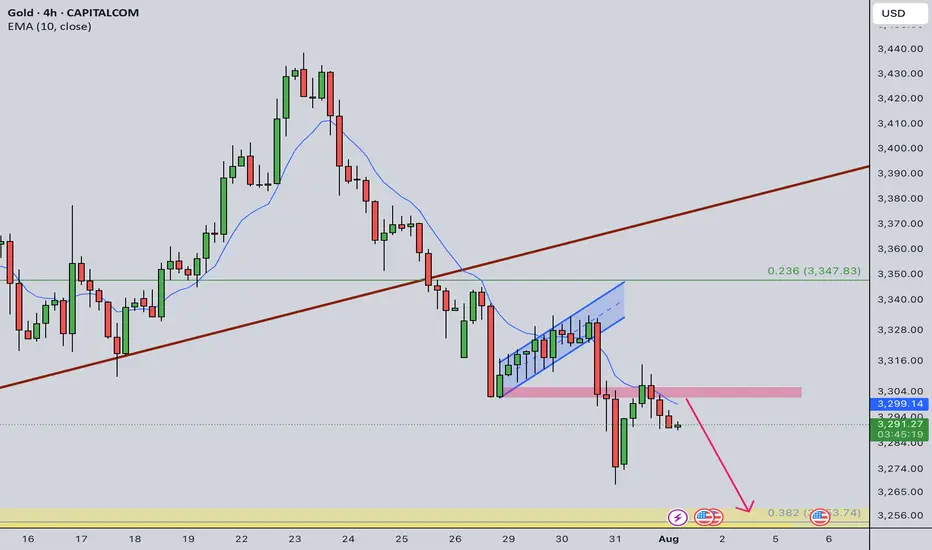
Gold Intraday Trading Plan 8/1/2025Although yesterday's retracement is a bit too deep, I am still bearish in gold in medium term as long as 3333 resistance is not broken. Therefore, I will still look for selling opportunities today.
Currently daily is in green bar while smaller timeframe shows bearish signs. If there is a double top formed near 3300, I will sell toward my weekly target at 3255.
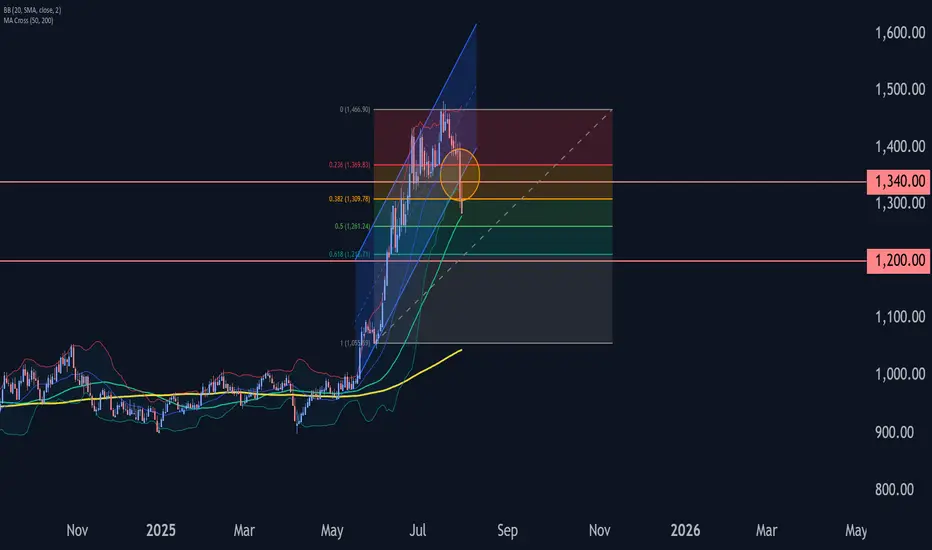
Platinum Wave Analysis – 31 July 2025- Platinum broke support zone
- Likely to fall to support level 1200.00
Platinum recently broke the support zone located between the key support level 1340.00 (low of the previous minor correction iv) and the support trendline of the daily up channel from May.
The breakout of this support zone accelerated the c-wave of the active ABC correction 4.
Given the bearish sentiment across the precious metals markets, Platinum can be expected to fall to the next support level 1200.00 (target for the completion of the active wave c).
Natural Gas Bullish Reversal...Are the Lows in?U.S. natural gas inventories increased by 48 billion cubic feet last week to 3,123 Bcf, increasing the surplus over the five-year average.
Consensus / forecast was 37Billion Cubic feet.
Despite a much higher build than expected Nat gas saw positive price action.
This appears to simply be a dead cat bounce before we go lower.
A death cross on the daily chart has occurred. This signal often results in a small bounce before going lower.


Market Expectations for Gold (XAU/USD)Gold is currently in a very critical zone, and in my view, it has room to rise toward the 3339–3345 level.
Once that zone is touched, I expect another drop to follow.

GOLD BUYGold maintains its daily gains around $3,300
After retreating markedly on Wednesday, Gold rebounds moderately and remains positive at about $3,300 per troy ounce on Thursday. The precious metal’s rebound comes in response to the daily retracement in US yields across the curve and the so far irresolute price action in the Greenback
The US Federal Reserve kept its benchmark interest rate unchanged for the fifth consecutive meeting, in a range of 4.25% to 4.5%, despite intense pressure from US President Donald Trump and his allies to lower borrowing costs. The decision, however, met opposition from Fed Governors Michelle Bowman and Christopher Waller. This was the first time since 1993 that two governors had dissented on a rate decision.
In the accompanying monetary policy statement, the committee had a more optimistic view and noted that the economy continued to expand at a solid pace. Adding to this, Fed Chair Jerome Powell said during the post-meeting press conference that the central bank had made no decisions about whether to cut rates in September. This comes on top of the upbeat US macro data, and lifted the US Dollar to a two-month high.
Automatic Data Processing reported that private payrolls in the US rose by 104,000 jobs in July, following a revised 23,000 fall recorded in the previous month. Adding to this, the Advance US Gross Domestic Product (GDP) report published by the US Commerce Department showed that the economy expanded at a 3.0% annualized pace during the second quarter after contracting by 0.5% in the previous quarter
SUPPORT 3,346
SUPPORT 3,328
SUPPORT 3,309
RESISTANCE 3,283
RESISTANCE 3,273

NQ GC ES, Daily Orderflow and Weekly OutlookCME_MINI:NQ1! COMEX:GC1! CME_MINI:ES1!
Time for the final AMDX

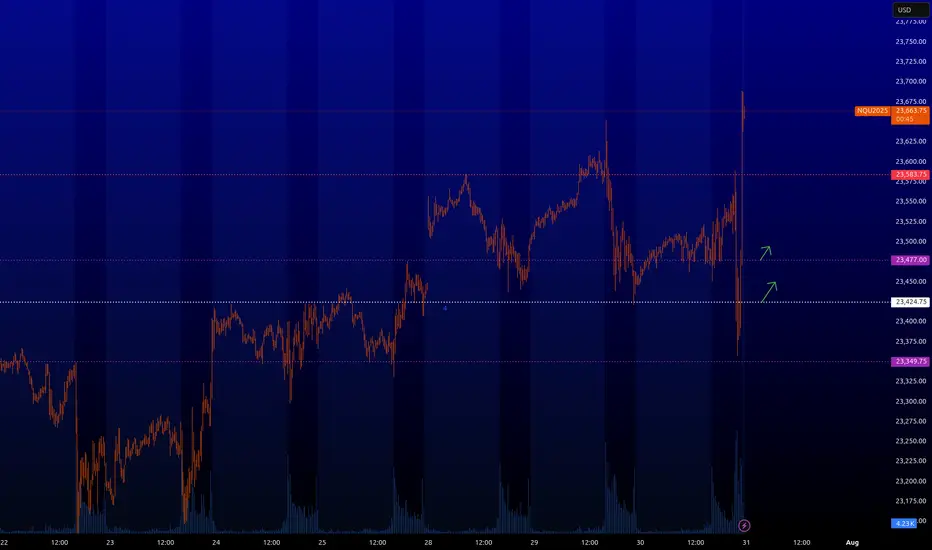
NQ : Buy levelsAll right, the stops are off like I said in my prev NQ post.
Turns out there was an important FOMC news that I didn't notice. I don't usually trade on the news.
Now the levels where the green arrows are from are back in play. You can pips, you can scalp, you can look for longer trades from them. I usually scalp them.
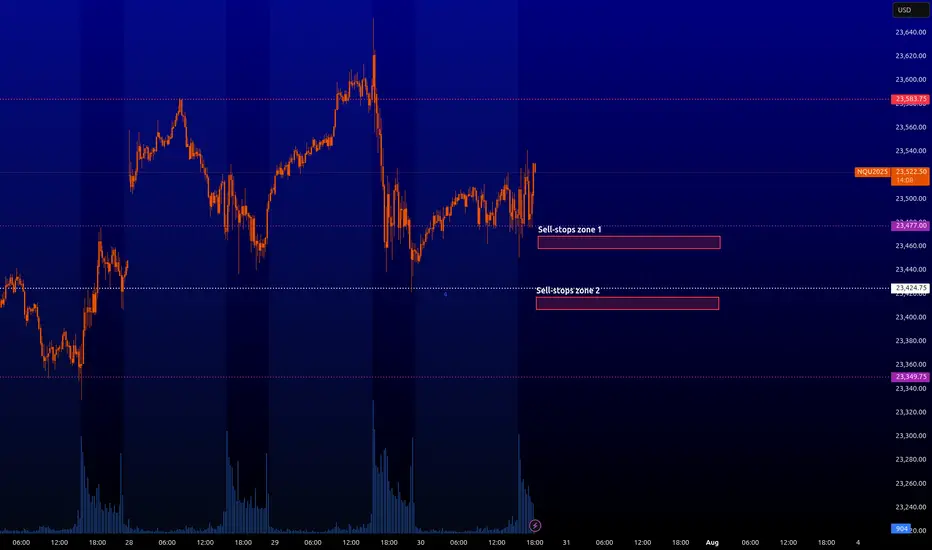
NQ : enormous amount of sell-stopsI have highlighted two zones where a lot of sell-stop orders are currently concentrated. Those who trade robots with fast buybacks, you can put your algorithms there. When entering these zones there will be a quick dropdown of the price if it comes to these zones in liquid time (American session).
Those who do not have robots, I will inform you when it will be possible to get some profit from these zones with limit trades.
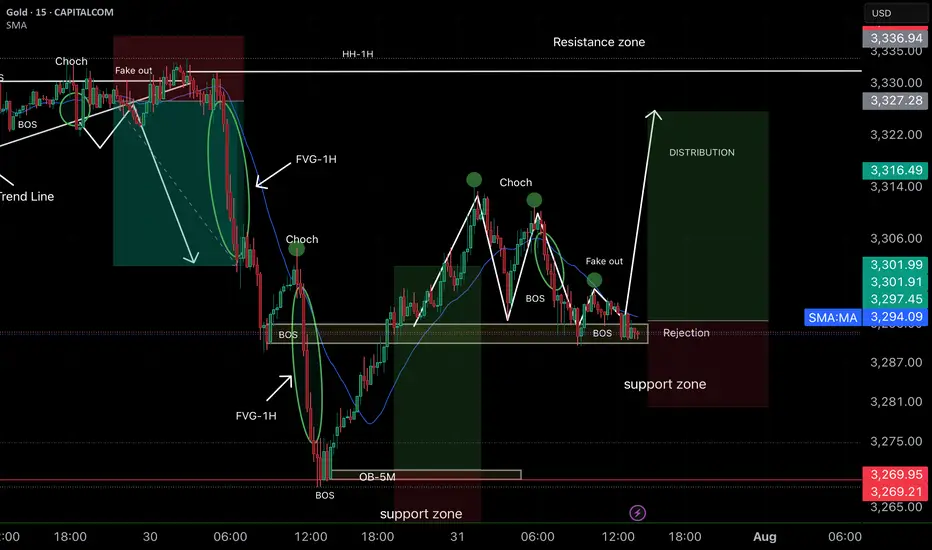
Smart Money Concepts (SMC) ✅ Analysis strengths:
• Correct identification of BOS (Break of Structure) and CHoCH, which indicate a change in direction.
• The support zone is marked and respected with rejection, reinforcing the probability of a rebound.
• The projection toward the distribution zone and HH of 1H is consistent, as there are inefficiencies (FVG) pending mitigation.
• The previous fake out clears liquidity and creates room for strong bullish momentum.
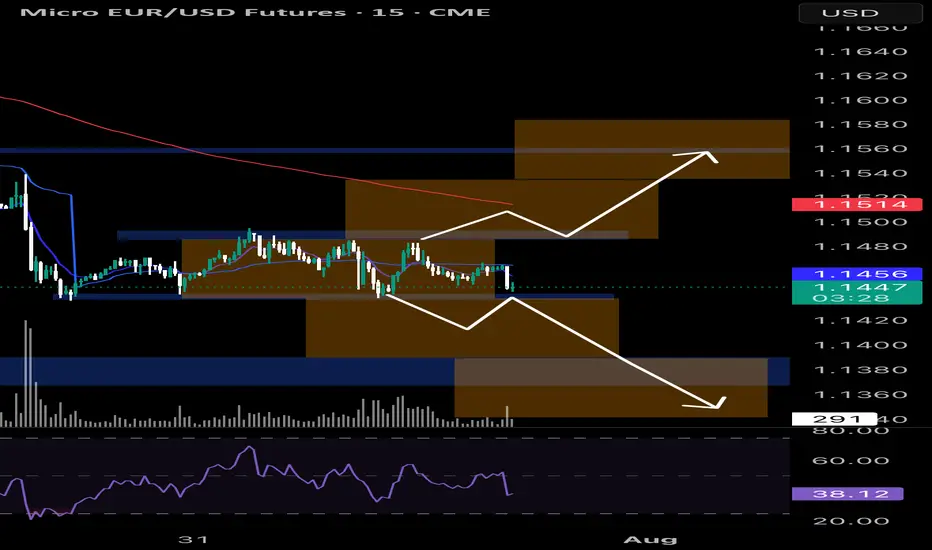
EUR/USD Futures – Key Decision ZonePrice is consolidating between 1.1430 and 1.1485, forming a range near previous value areas.
A breakout is likely imminent. Watching for:
📈 Bullish scenario: Break and retest of 1.1490 → targeting 1.1570 supply zone.
📉 Bearish scenario: Sweep of 1.1430 lows with strong volume → targeting 1.1370 demand.
Volume is decreasing, RSI under 40, and we’re sitting at the mid of a low-volume node → stay patient and reactive, not predictive

Gold Next Move (Read description). Hello, Traders.
As you saw we have achieved our target at last ideas.
This week gold is running in down trend, today it has touched the price 3268 and then gold pumped.
As you see guys, gold has breakout the last support area and its support became resistance.
Gold has changed the character according to H1 and there is break of structure (BOS).
The trend is bearish, so gold needs to fall, it can fall till 3351.
Comment positive feedbacks, Thanks.

GOLD SHORT10 year bullrun is followed by a shorter term bearmarket. Gold is starting to lose its strength, which is a clear sign of weakness and the beginning of a bearish reversal.

Xausd techinical analysis.Xausd techinical analysis.next move posibale at h1 time frame not finchinal advice.

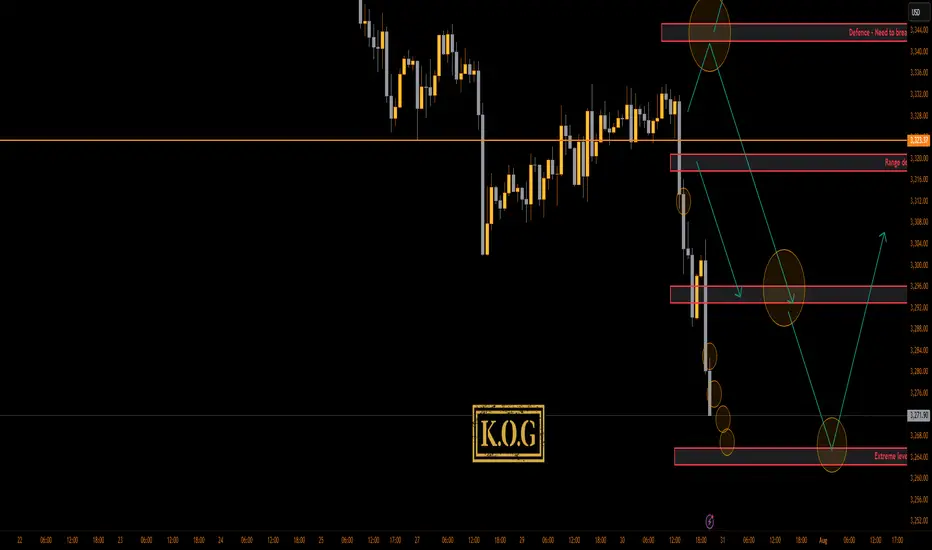
THE KOG REPORT - UpdateEnd of FOMC Update:
Thank you.
RED BOX TARGETS:
Break above 3335 for 3338, 3340, 3345, 3347 and 3357 in extension of the move
Break below 3320 for 3310✅, 3306✅, 3302✅, 3297✅ and 3393✅ in extension of the move
Please do support us by hitting the like button, leaving a comment, and giving us a follow. We’ve been doing this for a long time now providing traders with in-depth free analysis on Gold, so your likes and comments are very much appreciated.
As always, trade safe.
KOG
Journey of silver buy at support sell at resistance There is Up trending channel, follow the channel and make money since silver is long term bullish atleast.
Not mentioning the levels do the math follow the channel and find the support

Retail Used Indicators. You Used Structure. You Got Paid.MES printed a textbook quant setup today, delivering a high-confidence breakdown that played out almost mechanically. Price action first broke down from a well-respected rising trend channel, then pulled back into the 50% Fibonacci retracement zone at 6,426.75, drawn from the recent swing high at 6,457.50 to the low at 6,395.75.
The retracement also aligned with a heavy volume node, which acted as a clear supply zone. What followed was a rounded retest structure that resembled a teacup formation not as a bullish setup, but rather as a liquidity bait, luring in breakout buyers before delivering a clean rejection from the equilibrium zone.
This type of structure a trend line break + fib pullback + rounded retest + expansion move is one of Staakd’s high-probability short patterns, historically completing the measured move back to 0% (6,395.75) over 70% of the time. That target has now been hit, and with price currently consolidating below the broken structure and inside a low-volume area, we could now see a secondary move toward 6,375 if 6,395 fails to hold. If instead we see a relief bounce, the optimal re-entry zone sits between 6,410 and 6,420, just beneath the broken fib and previous channel floor.
This is one of those trades where structure, volume, and historical probability all lined up. The teacup retest served its purpose: trap liquidity, reject from the midpoint, and release pressure into the lower range. Unless MES reclaims 6,430, the bias remains firmly bearish.
These setups tend to show up 9–14 times per year on MES alone, especially during high-volume NY sessions or post-news volatility. What you’re looking for is a strong, clean trending structure that finally breaks then watch for a pullback to the 50–61.8% retracement zone, ideally aligning with a volume node or prior support. Often, this retest forms a rounded “teacup” shape a trap zone that attracts late buyers just before the breakdown. Once that zone rejects with momentum, price tends to expand cleanly toward the 0% fib level, or even extend further.
Track this pattern. Log it. It’s one of the most repeatable, mechanical moves we see in futures and when it shows up, it usually pays.
My recommendation is simple: ditch the clutter. Most retail traders are buried under recycled YouTube strategies, lagging indicators, and overcomplicated systems. The truth? Price structure, volume, and basic fib geometry are more than enough to build consistent trades. Go back to basics. Read the chart, not the noise. You'll be surprised how quickly your trading improves when you stop outsourcing your bias to indicators and start trusting clean, mechanical setups like this.

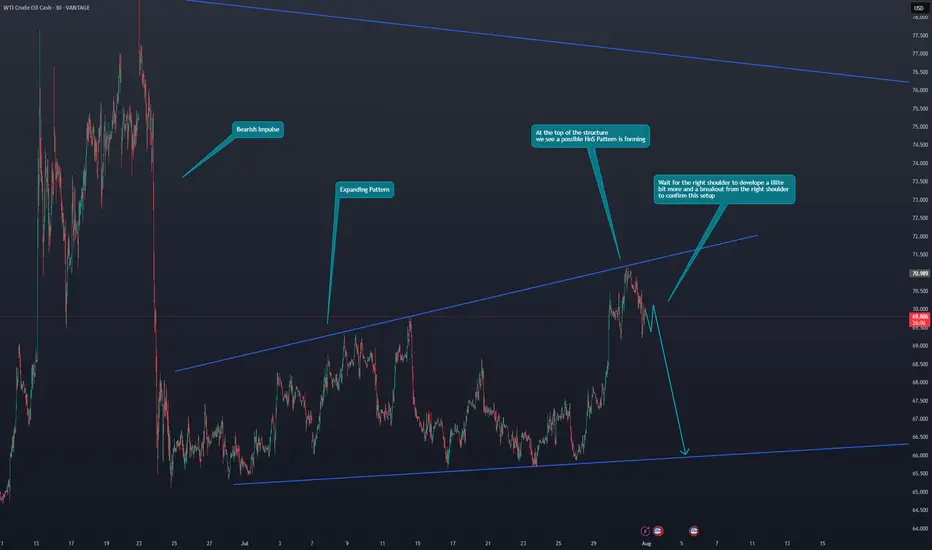
US OIL Potential ShortHi Traders.
Wait for the right shoulder to develope a lillte
bit more and a breakout from the right shoulder
to confirm this setup
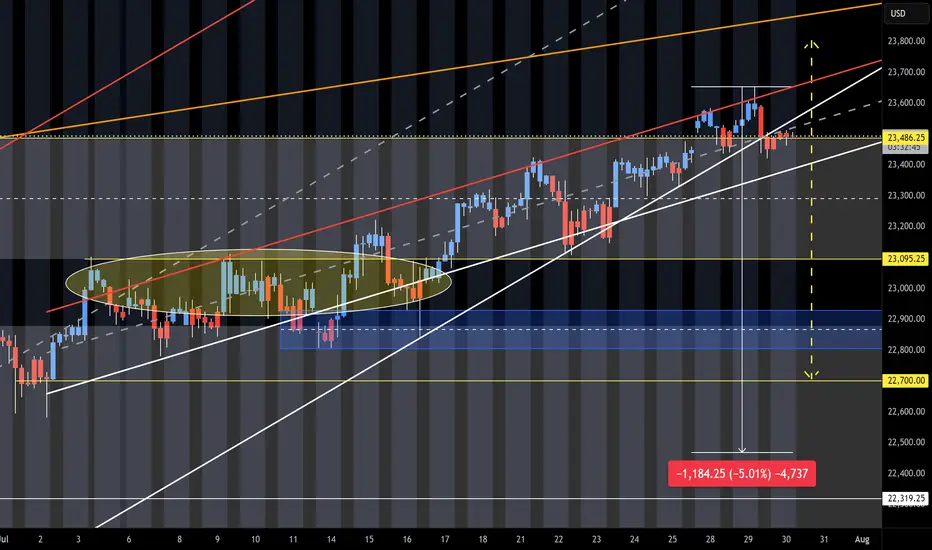
NQ Short (07-30-25)NAZ is at upper target and Turn Zone from May 12th post. Failure here should see a 5% drop test. The idea is that buyers will need some sellers in order to get higher. The sellers will help to test the level strength. Month end into a Friday-Monday Long play and a break in this long standing pattern may create the opposite. Current danger zone is the 23,486 KL. Look Long above and short below. Scalping Shorts should turn to holding shorts and scalping Longs. Expect timely Tweets and same old Tricks near or under the DZ. O/N is still The BOSS until both the O/N and Reg Session sell (on same day).
Gold’s Compression Coil Looks Ready to DetonateMGC continues to reject the 50% Fibonacci retracement level from the $3,386.5 swing high, currently trading at $3,347.3. Price has now spent multiple candles trapped under this level, unable to reclaim $3,355, with clear upper wicks and no bullish follow-through.
This is classic midday NY session compression, often setting up a late-day directional move. All signs currently point to continuation lower toward $3,306.2, completing a textbook measured move.
Staakd Probability Model
Based on historical setups where MGC pulls back to 50% and stalls mid-NY:
Scenario Probability
- Continuation down to $3,306.2 68% High-probability path if $3,347 breaks
- Sweep to $3,355–$3,360 before drop. 26%. Possible liquidity grab
- Break and hold above $3,360 6% Invalidation of the short idea
Key Levels
Level
- 100% Fib High $3,386.5 - Swing high
- Supply Zone $3,347–$3,355 - Rejection area + equilibrium zone
- Current Price $3,347.3 - Compression below fib midpoint
- Target Zone $3,306.2 - Measured move / demand structure
- Invalidation $3,360.0+ - Break above this invalidates the short
Trade Idea (Pending Trigger)
- Bias: Bearish
- Entry Zone: $3,345–$3,350
- Target: $3,306.2
- Invalidation: Above $3,360
- Reward-to-Risk: 2.2R–2.5R depending on entry execution
This is shaping into a high-probability continuation setup. NY session has done the heavy lifting: a weak bounce, heavy rejections, and no reclaim of structure. Unless we see a sudden reclaim of $3,355 or a spike in late NY volume, this looks ready to break and expand lower. Keep it simple. Trust the structure. Let price walk itself to the target.
