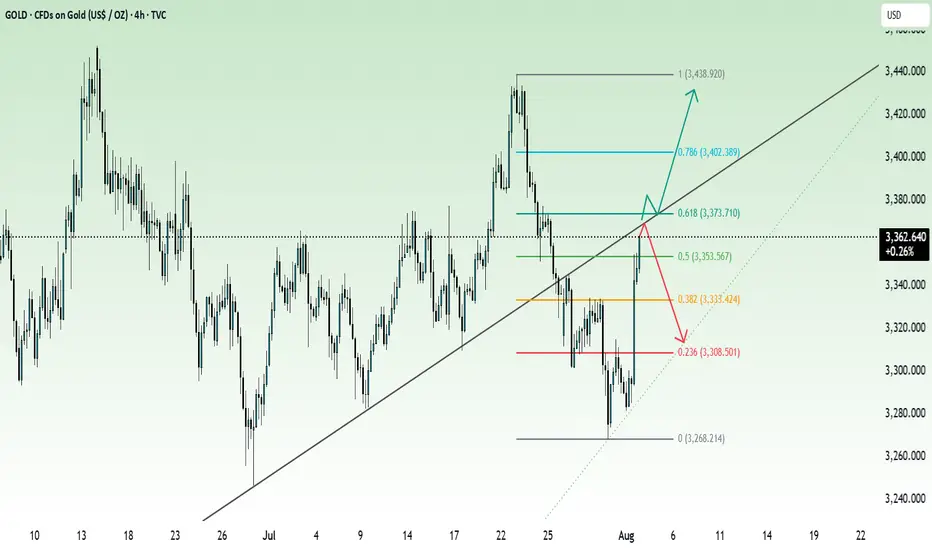
XAUUSD 4H AnalysisXauusd breaks the downward trendline and changes its direction toward important resistence levels 3369-3374. This zone is very important based on ichimoku, so we expect good reaction. after the reaction, the chart will be updated.
important support level is 3317.
Futures market

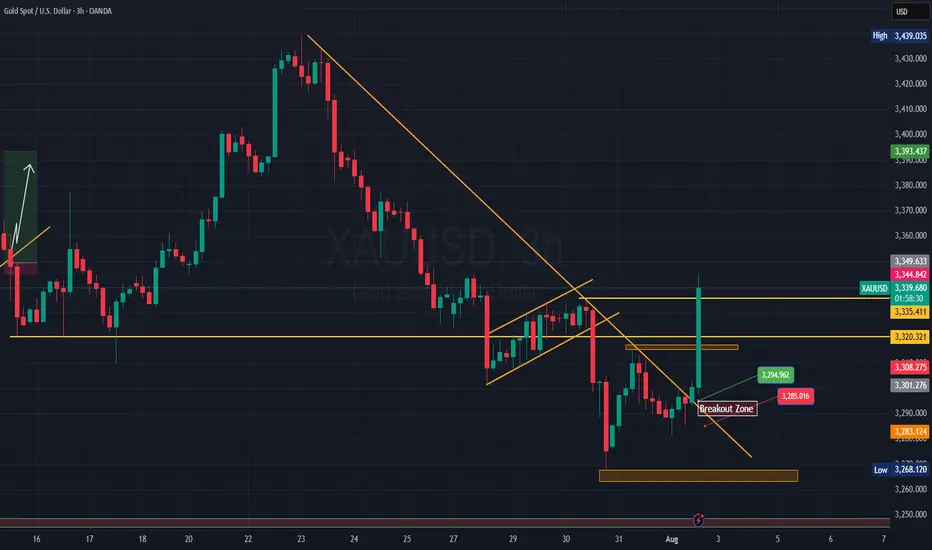
GOLD (XAUUSD): Move Up Ahead?!
Friday's fundamentals made Gold very bullish during the New York session.
The price formed a high momentum bullish candle on a daily,
breaking a minor daily resistance area.
It gives us a confirmed Change of Character CHoCH and indicates
a highly probable bullish continuation next week.
I think that the price will reach 3400 level.
❤️Please, support my work with like, thank you!❤️
I am part of Trade Nation's Influencer program and receive a monthly fee for using their TradingView charts in my analysis.

GOLD 1H: Fibo speaks louder than words - $3365 in focusGold is testing the upper zone near $3362–3365, which is just above the 0.5 Fibonacci level ($3353) from the previous impulse. The price has already bounced from the top of the channel, indicating potential exhaustion of the current upward move.
Technicals:
- MA50 and MA200 are below the price — bullish trend intact
- RSI is cooling down from overbought territory
- Fibo 0.5 ($3353) was breached, but no clear confirmation yet
- Channel resistance remains unbroken
Plan:
- If price rejects $3365, targets are $3340 and $3314
- If price holds above $3365, next move could be toward $3377+
- EMA structure supports further upside, but caution is needed at this zone
Gold isn’t shouting - it’s whispering key levels. Listen closely.

Gold is about to experience a correction!Gold after breaking the support, now again reached the support level which will be its resistance now, will it break it or get rejected form here. Enter the long only on breakout and retest till then its bearish trend.
Gold can reach resistance area and then continue to fallHello traders, I want share with you my opinion about Gold. Over an extended period, the price action of Gold has been contained within a large descending triangle, a pattern characterized by a series of lower highs testing a descending resistance line and a relatively flat support base. The major seller zone around the 3415 resistance level has consistently capped upward rebounds, establishing a clear downward pressure on the asset. The most critical recent development has been a decisive breakdown, where the price broke below a key ascending trend line and, more importantly, below the horizontal support at 3310. This structural break has shifted the immediate market dynamics, turning the former support area of 3310 - 3320 into a new ceiling of resistance. The primary working hypothesis is a short scenario based on the principle of a breakdown and retest. It is anticipated that the price will attempt a corrective rally back towards this new resistance area around 3310. A failure to reclaim this level, confirmed by a strong rejection, would validate the breakdown and signal the continuation of the larger downward trend. Therefore, the tp for this next bearish leg is logically placed at the 3240 level. This target represents a significant area of potential support and a measured objective following the resolution of the recent consolidation. Please share this idea with your friends and click Boost 🚀
Disclaimer: As part of ThinkMarkets’ Influencer Program, I am sponsored to share and publish their charts in my analysis.

10 POWERFUL INVESTING & TRADING QUOTES OF ALL TIME
Here are powerful quotes of professional traders, investors and experts in financial markets.
Let their words inspire you and help you in your trading journey.
"To succeed in the market, you must learn to think like everyone else and do the opposite." - Sir John Templeton 📈💭💡
"The four most dangerous words in investing are: 'This time it's different.'" - Sir John Templeton ⏳📉🛑
"The more you learn, the more you earn." - Warren Buffett 📚💰📈
"The key to trading success is emotional discipline. If intelligence were the key, there would be a lot more people making money." - Victor Sperandeo. 💪💰🚫🧠
"Investing is not about making predictions, it's about having a plan and sticking to it." - Tony Robbins 📊🔄📌
"The best time to buy a stock is when the blood is running in the streets." - Baron Rothschild 💀🔪💰
"The best investment you can make is in yourself." - Warren Buffett 💼💡💰
"The stock market is not a casino; it's a crooked casino." - Charlie Munger 🎰🎲🏛️
"Losses are part of the game. You can't win every trade." - Martin Schwartz. 📉😔💔
"The fundamental law of investing is the uncertainty of the future." - Peter Bernstein. ⚖️❓🔮
The More I trade, the more I realize how precise and meaningful are these phrases. Take them seriously, and they will help you achieve the financial success.
❤️Please, support my work with like, thank you!❤️
I am part of Trade Nation's Influencer program and receive a monthly fee for using their TradingView charts in my analysis.
Big money coming? Here, NFP data XAUUSD Technical Analysis PredDXY forecast today
XAU USD forecast today
EURUSD forecast today
NFP Data Forecast: Xauusd buys SELV sales for mass profit! Your latest gold trade guide confidently during the production of this most important wages is not related to the farm. In this video you will receive technical analysis from XaUUSD experts and proven adjustments for XaUUSD sales. It breaks down how you interpret forecasts for NFP data, how it affects gold prices, and where the best opportunities are. Whether you're a day trader or swing, this video gives you real information to plan your trade and plan your risk management as an expert. Don't miss this opportunity to turn your data into profits ahead of the market. Now look, trade more intelligently and go ahead with the crowd!
#NFPDATAFORECAST
#xauusd
#GoldTrading
#technicalalyasis
#forexsignals
#GoldPrice
#daytrading
#swingtrading
Continued recovery, positive after NFP news✍️ NOVA hello everyone, Let's comment on gold price next week from 08/04/2025 - 08/8/2025
⭐️GOLDEN INFORMATION:
Gold prices surged over 1.5% on Friday, climbing toward $3,350, as a weaker-than-expected U.S. Nonfarm Payrolls (NFP) report signaled a faster-than-anticipated slowdown in the labor market. Heightened geopolitical tensions between the U.S. and Russia further boosted safe-haven demand for the precious metal.
Following the disappointing July jobs data, markets began pricing in a potential interest rate cut by the Federal Reserve. While the Unemployment Rate held relatively steady, signs of labor market softness supported recent comments from Fed officials Michelle Bowman and Christopher Waller, who advocated for a 25-basis-point rate cut at the July 29–30 meeting.
Additional data added to the cautious sentiment: the ISM’s July report confirmed that U.S. manufacturing activity remains in contraction territory, while consumer confidence took a hit, according to the University of Michigan’s latest survey.
⭐️Personal comments NOVA:
Gold prices continue to be positively affected after last week's NFP news, market expectations of an early rate cut are rising
🔥 Technically:
Based on the resistance and support areas of the gold price according to the H4 frame, NOVA identifies the important key areas as follows:
Resistance: $3384, $3434
Support: $3331, $3307, $3268
🔥 NOTE:
Note: Nova wishes traders to manage their capital well
- take the number of lots that match your capital
- Takeprofit equal to 4-6% of capital account
- Stoplose equal to 2-3% of capital account
- The winner is the one who sticks with the market the longest

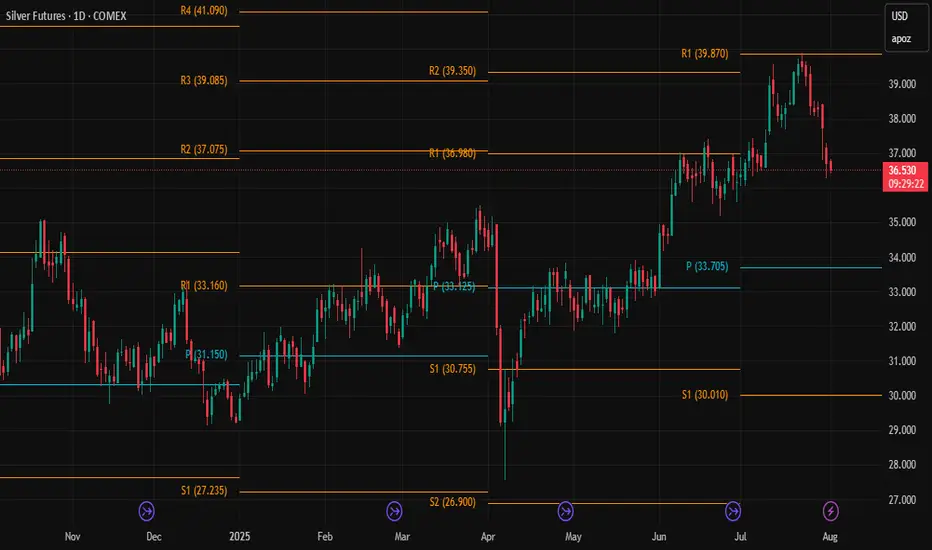
It would be nice to see Silver drop towards the Pivot for a buy.There is no prediction, just looking at the pivots. It would be nice to see silver drop down under 35.00 into the quarterly pivot point to add to positions.
Gold 30Min Engaged ( Buy & Sell Reversal Entry Detected )Time Frame: 30-Minute Warfare
Entry Protocol: Only after volume-verified breakout
🩸Bearish Reversal - 3304
🩸Bullish Reversal - 3275
➗ Hanzo Protocol: Volume-Tiered Entry Authority
➕ Zone Activated: Dynamic market pressure detected.
The level isn’t just price — it’s a memory of where they moved size.
Volume is rising beneath the surface — not noise, but preparation.
🔥 Tactical Note:
We wait for the energy signature — when volume betrays intention.
The trap gets set. The weak follow. We execute.
XAUUSD
XAUUSD Updated in H1 :
The gold signal is marked on the chart based on the latest price changes and the supply and demand in the market. These points include the entry point, stop loss, and take profit

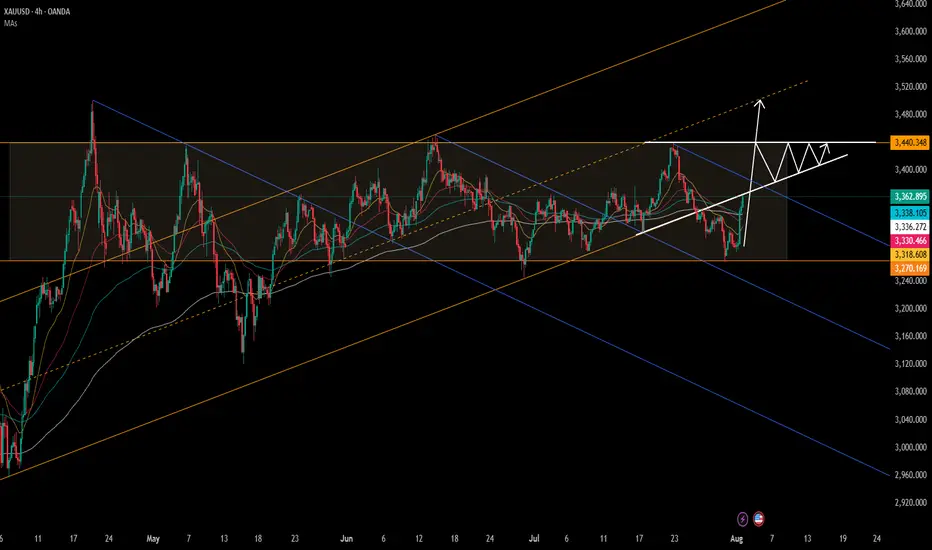
Go long on gold at low prices, targeting above 3400.Go long on gold at low prices, targeting above 3400.
Gold 4-Hour Chart:
As shown in the chart, from a macroeconomic perspective, despite the rise in gold prices, it remains trapped within a trend channel.
Currently, gold prices are under pressure in the 3370-3380 range.
On Friday, driven by risk aversion, gold prices briefly rose to $3363. With the Federal Reserve resuming its rate hikes over the weekend, expectations for a September rate hike have risen to 80%.
The most robust strategy for gold prices next week: enter long at low prices and manage your position accordingly.
Going long at current prices is not recommended. Instead, watch for potential declines due to profit-taking after the price dips.
Upward resistance lies near 3370 and 3380, where previous reversals occurred.
Every waterfall pattern offers a buying opportunity on the decline.
Although gold is currently strong, if we are bullish, we should not chase the gains. Simply wait patiently for prices to fall back to lower levels before going long.
Short-term intraday trend
Upside focus: Resistance at 3372-3385
Downside focus: Support at 3345-3340 and 3315-3320.
Gold Strategy:
1: Buy on the first dip into the 3338-3343 range, with a small stop-loss and a target price of 3370-3380.
2: Go long at low prices and control position size. This is definitely the most stable trading strategy. Patiently maintain a swing strategy. Target 3400+.
3: Continue to monitor resistance near 3440 next week. As shown in the chart, a converging triangle pattern may form.
Gold The Week Ahead Key Support and Resistance Levels
Resistance Level 1: 3386
Resistance Level 2: 3410
Resistance Level 3: 3438
Support Level 1: 3315
Support Level 2: 3295
Support Level 3: 3268
This communication is for informational purposes only and should not be viewed as any form of recommendation as to a particular course of action or as investment advice. It is not intended as an offer or solicitation for the purchase or sale of any financial instrument or as an official confirmation of any transaction. Opinions, estimates and assumptions expressed herein are made as of the date of this communication and are subject to change without notice. This communication has been prepared based upon information, including market prices, data and other information, believed to be reliable; however, Trade Nation does not warrant its completeness or accuracy. All market prices and market data contained in or attached to this communication are indicative and subject to change without notice.

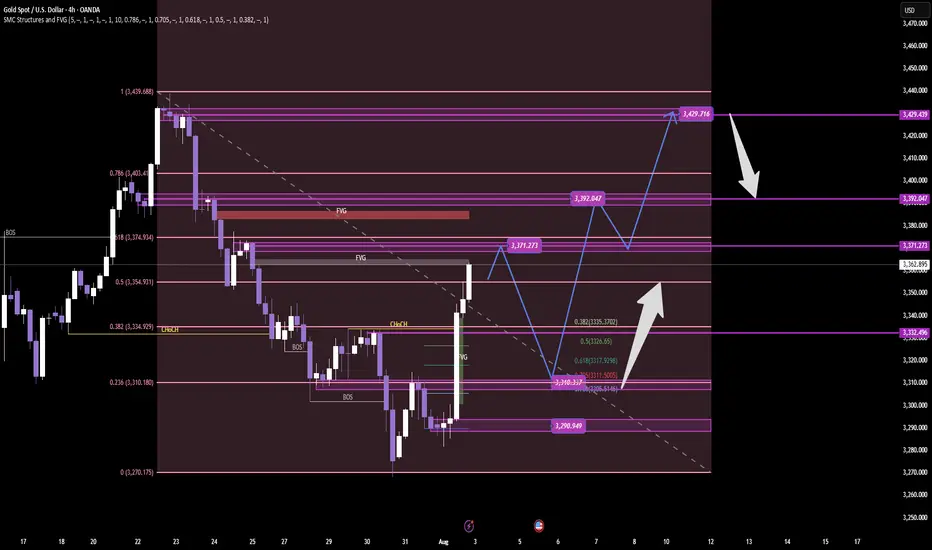
GOLD – SMC ProTrading Breakdown Plan Next WEEK GOLD – SMC ProTrading Breakdown | Clinton Scalper | 4H Timeframe
XAUUSD is currently displaying clear institutional order flow behavior after a deep liquidity sweep at the end of July. Here’s a full breakdown using advanced SMC (Smart Money Concepts) methodology:
🔍 1. Liquidity Sweep at the Low
Price maintained a series of lower highs and bearish structure until it executed a classic liquidity grab between 3,270 – 3,290. This is a textbook move by Smart Money: sweep retail stop orders before initiating a reversal.
This zone aligned with:
✅ Untapped Fair Value Gap (FVG)
✅ Reversal Order Block (OB)
✅ Fibo 0.236 of the mid-term bullish leg
After the sweep, the market printed a micro CHoCH, indicating early signs of smart money accumulation.
🧠 2. CHoCH → BOS → Reaccumulation Structure
CHoCH (Change of Character) marks the first break in the bearish microstructure – suggesting a possible shift.
Then, price delivered a BOS (Break of Structure) around the 3,334 zone, confirming bullish intent.
Buy-side is now:
Positioned from a deep discount zone
Mitigating key inefficiencies
Targeting higher liquidity zones above current price
Price is currently reacting to a previous supply OB around 3,362.
📐 3. Institutional Order Flow & Target Zones
Now that price is in a key reaction zone, we prepare for two high-probability scenarios:
🅰️ Continuation Scenario (Reaccumulation)
A retracement to the 3,317–3,311 zone (Fibo 0.5–0.618) could offer a premium re-entry
This area is stacked with:
FVG
Order Block
Equal lows liquidity
🔼 From there, potential targets include:
🎯 TP1: 3,371 – previous imbalance zone
🎯 TP2: 3,392 – minor liquidity cluster
🎯 TP3: 3,429 – premium OB and high-liquidity zone
🅱️ Distribution Scenario (Bearish Rejection)
If price fails to hold bullish structure and forms a bearish CHoCH around 3,392–3,429
This would signal a distribution zone, and potential reversal back toward 3,290 support
🔂 4. Smart Money Flow Logic
“Smart Money doesn’t follow price. They lead price to liquidity.”
This chart reflects the complete Sweep → CHoCH → BOS → Mitigation → Expansion sequence. A classic SMC Pro model where:
Liquidity is engineered and swept
Structure is shifted
Price returns to mitigate institutional entries
Price expands into external liquidity
📌 Clinton Scalper Outlook:
We don’t chase reversals – we track the footprints of capital. The real edge is understanding where smart money is positioned, and aligning with their narrative.
🔔 Stay tuned for continued updates using this precise and probability-driven Pro SMC framework.
XAUUSD - Daily | More Consolidation??Gold is back in the upper range of this consolidation zone. You can see the high of the range is 3430, and the low is 3240 roughly.
Bulls:
Gold is pulling back into an Inverted FVG. If the price is bullish, then we should clear the gap with ease. Gold has just eliminated 4 days' worth of choppy bearish price action. Look for gold to give clear signs to enter a buy.
**A new daily candle should appear, creating a new FVG showing buyers are winning
Bears:
So with that said... If Gold fails to remain bullish after Friday's (Aug 1st) 700-pip jump, then the iFVG may have the price react bearishly. Watch for gold to give a clear sign of rejection before entering a sell
**Price may drop to cover Friday's gap. Doesn't mean it's bearish

Crude OilOil will go down to %50 by EOY 2026 unless it breaks the upper bound of the downsloping parallel.

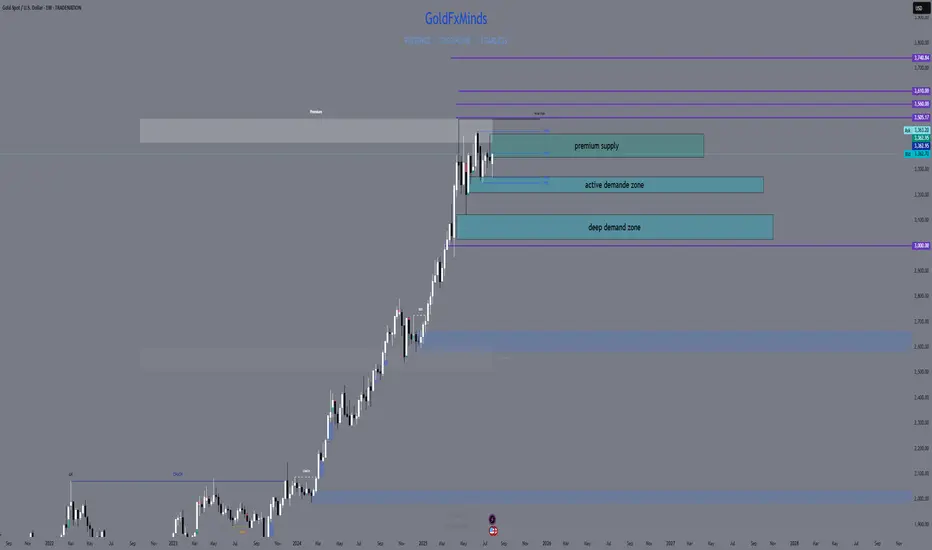
XAUUSD Weekly Outlook – August 4–8, 2025
The question isn’t whether gold is strong. The question is — will price expand, or rebalance?
🔸 Macro Overview
Gold begins the week consolidating just below its final HTF supply zone (3439), while USD weakens amid mixed macro data and growing speculation of future rate cuts. Markets await fresh catalysts, and gold’s recent impulsive rally is now facing the big test: break the wick, or pull back?
🔸 Weekly Structure & Bias
Element Observation
🔹 Trend Bullish continuation — clean structure
🔹 Last BOS March 2025 — impulsive, with imbalance below
🔹 Price Action Top wick rejection forming near 3439
🔹 Bias Still bullish, but entering exhaustion zone
🔹 RSI Above 70 — overheated
🔹 EMAs EMA5 > EMA21 > EMA50 > EMA100 — perfect trend
🔸 Key Weekly Levels (Zones + Confluences)
Zone Type Price Range Confluences
🔴 Supply 3350 – 3439 HTF wick supply + FVG + RSI 70+ + liquidity trap
🔵 Demand 3270 – 3215 Weekly OB + FVG + EMA21 support
🔵 Demand 3120 – 3070 Old BOS + deep FVG + psychological level
🟢 Support 3000 zone EMA50 + historical consolidation
🔸 Fibonacci Extensions (Above 3439)
Extension Level Price Target Confluences
1.0 (Swing Full) 3439 Supply wick high
1.272 3505 Next psychological milestone
1.414 3560 Mid-extension + liquidity
1.618 3610 Golden expansion target
2.0 3740 Full trend extension (max)
🔺 These levels serve as potential breakout targets ONLY if we get a confirmed weekly close above 3439 with clean BOS on LTF.
🔸 Weekly Scenarios
🟢 Scenario 1 – Break and Expand
If gold breaks 3439:
Expect clean continuation to 3505 → 3560 → 3610
Best entries come from new OBs on H4/D1 around 3350–3370
Follow momentum — but don’t chase without retrace confirmation
🔻 Scenario 2 – Rejection + Retracement
If price holds below:
Pullback toward 3270 – 3215 expected
EMA21 acts as dynamic support
If selloff gains strength, next demand = 3120 – 3070
🎯 This zone aligns with macro OB + re-entry for long-term bulls.
🔸 Conclusion & Gameplan
Gold is pressing against its final weekly ceiling.
Structure remains bullish, but every sniper knows — at the edge of premium, timing is everything.
✅ Above 3439 → expansion opens to 3505 → 3560 → 3610
🟦 Below 3439 → retracement into 3270 → 3215 → 3070
The best setups will be born from confirmation, not prediction. Let the market decide.
—
What would you do if 3439 rejects hard this week?
Comment your plan, tag your sniper level, and let’s stay ahead together 💬
—
With clarity, confidence, and perfect timing,
GoldFxMinds 💙
Disclosure: Analysis based on Trade Nation (TradingView) chart feed.
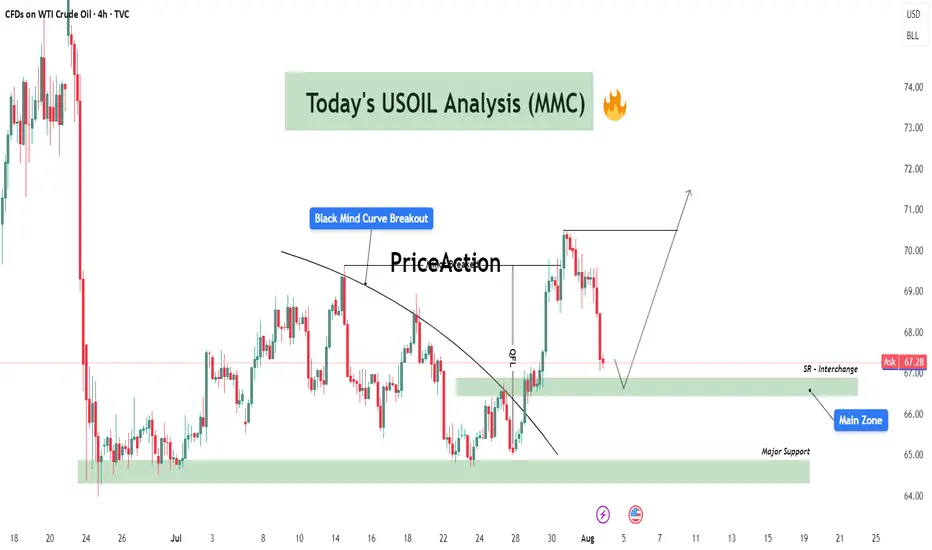
USOIL Technical Analysis – Black Mind Curve Breakout & Reversal🔍 Overall Market Context:
The current USOIL structure is a great example of market shift from compression to expansion, characterized by a breakout of the Black Mind Curve followed by a measured impulse move. This chart is not just reacting technically, but it reflects how institutional smart money manipulates curves, breaks minor structures, and then retests zones to refill orders before continuing directionally.
Let’s break the market psychology and price action phase by phase:
🔄 Phase 1: Black Mind Curve Breakout ✅
The Black Mind Curve represents long-standing supply pressure that had been capping price.
Its breakout marks a shift in market intention, often signaling the end of a distribution phase and beginning of a possible accumulation or re-accumulation.
Price broke above this curve cleanly with strong bullish candles, which also broke minor structure levels, confirming short-term bullish sentiment.
The breakout was also backed by momentum and volume as the market pushed 130+ pips upward—an aggressive impulse that trapped late sellers below.
📉 Phase 2: Retracement to Interchange Zones
Now, we’re in the retracement phase, where price is pulling back toward:
🔹 SR Interchange Zone ($66.80 - $67.30)
This zone was previous resistance, now flipping to support.
In MMC terms, this area is expected to serve as a refill zone where smart money will look to accumulate again after the breakout.
We are watching for confirmation candles or MMC-style reversal patterns here (e.g., inside bar breakouts, demand imbalances).
🔹 Main Zone ($65.80 - $66.50)
If the first zone fails, this is the next key demand base.
It holds historical value from previous accumulation phases (see July 10–25) and aligns with the origin of the last impulse.
Expect a sharper wick or deeper liquidity grab if price moves into this area.
📉 Phase 3: Final Defensive Zone – Major Support ($63.70 - $65.20)
This zone marks the last line of bullish defense.
A move here would mean the bullish structure is being reevaluated or absorbed by sellers.
However, if price hits this level, it could also attract significant institutional demand, setting up for a more powerful long-term leg up.
Reactions here are typically large and volatile, with a risk of fakeouts and fast reversals.
📈 Possible Scenarios (MMC Based Forecasting):
✅ Scenario 1 – Bullish Continuation (Primary Path)
Price finds support inside SR Interchange Zone.
Forms a base (MMC reversal structure) and pushes back to recent highs near $71.
Breakout above $71 opens room for next supply zones between $72.50 - $74.00.
⚠️ Scenario 2 – Deeper Liquidity Grab
Price breaks below SR Interchange and tests Main Zone for a deeper accumulation.
A wick or shakeout may happen before bullish continuation.
This trap zone could give the best R:R entry.
❌ Scenario 3 – Breakdown to Major Support
If both zones fail and bearish pressure sustains, price may revisit Major Support.
That would reset the bullish structure and require fresh MMC assessment.
🧠 MMC Logic at Work:
The curve break symbolizes the shift from supply dominance to a possible demand-led phase.
Minor structure breaks add fuel to trend shift and indicate participation from larger players.
Retracements are not weaknesses—they are refills for those who missed the move.
Smart money uses these zones and flips (SR interchanges) to hide in plain sight.
🎯 Key Takeaway for Traders:
This is a textbook MMC setup that combines:
Curve Breakout + Impulse
Zone Retest + Interchange Logic
Liquidity Engineering before Continuation
Traders should remain patient and observe reactions at each zone. Don’t chase—wait for the market to reveal its hand via MMC entry signals (break-of-structure, bullish engulfings, imbalance fills, etc.)
Analysis of gold market operation strategies and ideas next week
Gold rallied unilaterally on Friday following positive non-farm payroll data, reaching a new high for the week. This week's candlestick formed a hammer pattern, suggesting further upside potential next week. Bulls continued their push late Friday, closing at 3363. Next week, we will continue to monitor short-term resistance around 3370-3375. We will continue to buy on pullbacks. If your current trading is not satisfactory, I hope I can help you avoid investment setbacks. Welcome to discuss your options!
Based on a 4-hour analysis, short-term resistance will be seen around 3370-3375 next week, with a key resistance around 3395-3400. We will continue to buy on pullbacks. In the intermediate range, we recommend maintaining a cautious wait-and-see approach. I will provide detailed trading strategies during the trading session, so please stay tuned.
Gold Trading Strategy:
Go long on gold pullbacks to 3330-335, with a stop-loss at 3318 and a target at 3370-3375. Hold on if it breaks above this level.

XAUUSD Live Trade Last Night (Killed it with 11,641 USD Profits)I managed to ride the momentum last night on XAUUSD and made over 11,641 usd profit on a live trading account. Gold usually create a range. It will create a top and a bottom then it will spend most of its time inside that range. That is pretty much how XAUUSD moves. If you can identify the top and the bottom then you can short it from the top and do a long trade on the bottom. The price will just travel from bottom to top and top to bottom. You can scalp your way to profits on this move if you can time it properly. Once in a while, a break from the top or the bottom happens. This is where you switch from trading the range to trading breakouts.

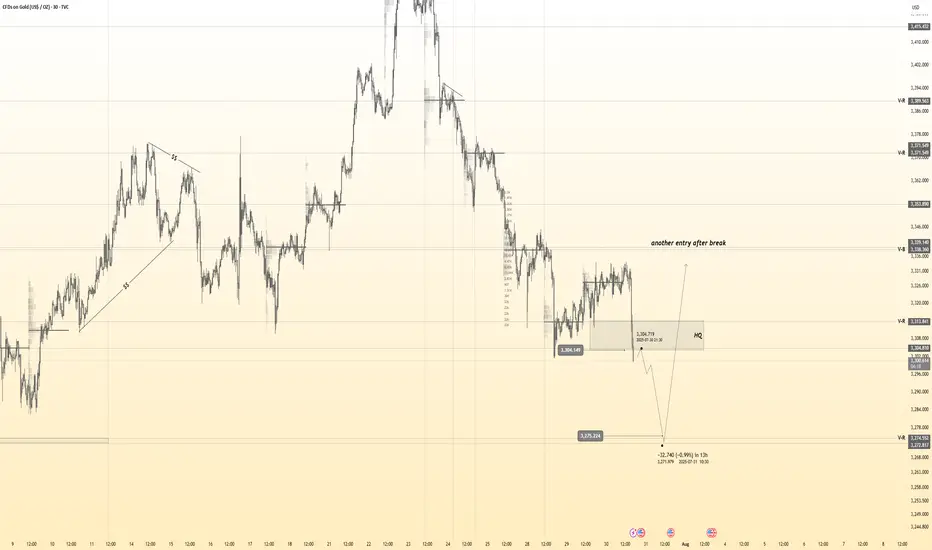
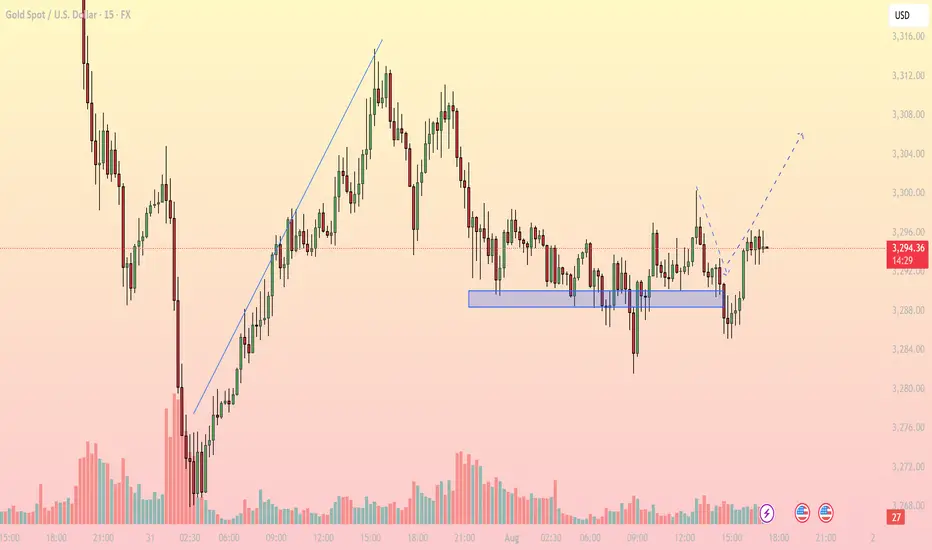
Bullish Rejection from Support, Upside in FocusMarket Overview: On the M15 timeframe, XAUUSD shows signs of a short-term bullish reversal after a prolonged sideways range around the key support zone of 3,286 – 3,289 USD. Price faked out below this support but quickly recovered, forming a V-shape reversal, suggesting strong buying interest has returned.
Key Levels to Watch:
Support Zones:
- 3,286 – 3,289: Strong intraday support, tested multiple times with sharp rejections
- 3,274: Next significant support if the above zone fails
Resistance Zones:
- 3,300 – 3,304: First resistance target aligned with the recent high
- 3,308 – 3,312: Higher resistance area where supply may emerge
Technical Indicators:
EMA: Price has reclaimed the short-term EMAs, indicating bullish momentum on lower timeframes
RSI: Rising above 50 but not yet overbought – there’s room for further upside
Volume: Increasing volume during the bounce confirms buying strength
Trading Strategy:
- Bullish Scenario (Preferred): Entry Zone: Watch for pullback toward 3,290 – 3,292
Stop Loss: Below 3,285
Take Profit 1: 3,300
Take Profit 2: 3,304
Extended Target: 3,308 – 3,312 (if bullish momentum continues beyond breakout zone)
- Bearish Scenario (Alternate): Only valid if price breaks and closes strongly below 3,286
Short Target: 3,274 – 3,270
Note: Counter-trend strategy – higher risk, requires strong confirmation
Conclusion: Gold is showing a bullish price structure on the 15-minute chart. As long as price holds above the 3,286 – 3,289 support zone, the path of least resistance appears to be upward, with 3,300 and 3,304 as the next logical targets. Monitor price action closely during the U.S. session for a potential long setup.
- Follow for more real-time gold trading strategies and save this idea if you find it helpful!
GOLD ROUTE MAP UPDATEHey Everyone,
What a PIPTASTIC finish to the week! 🚀. We tracked the move down with precision durung the week and then rode the momentum right back up.
Yesterday, we confirmed the swing range activation and bounce, and that bullish follow through carried beautifully into today, completing our Bullish Target at 3348. Just perfect execution all around.
BULLISH TARGET
3348 - DONE
BEARISH TARGETS
3328 - DONE
EMA5 CROSS AND LOCK BELOW 3328 WILL OPEN THE FOLLOWING BEARISH TARGET
3305 - DONE
EMA5 CROSS AND LOCK BELOW 3305 WILL OPEN THE SWING RANGE
3289 - DONE
3267 - DONE
We will now come back Sunday with a full multi timeframe analysis to prepare for next week’s setups, including updated views on the higher timeframes, EMA alignments, and structure expectations going forward.
Thanks again for all your likes, comments, and follows.
Wishing you all a fantastic weekend!!
Mr Gold
GoldViewFX

XAGUSD--SHORT--02-08.25--looking at multime-frame (M,W), short term great short opportunity
--entry around 37.52854 and 37.32500, TP is 35.267
