LNG and Weather Factors: We Expect Moderate Storage IncreaseThe natural gas market enters Week 31 with a sense of equilibrium, as prices hold steady and storage levels continue to climb. The expiration of Contract Q aligned with the 15-year median, while Contract U trades near the median, and 2025 fall contracts remain within the interquartile range, slightly above median levels. However, Winter 2026-27 contracts persist above the upper quartile, hinting at lingering supply and weather concerns. A projected 39 BCF storage increase for Week 30 (July 21-27) keeps inventories above the five-year median, supported by robust injection rates. Yet, a sharp rise in the supply-demand differential, driven by increased power generation and industrial consumption, signals evolving market dynamics as LNG exports dip. Weather stabilization and regional trends further shape this outlook, which we explore in detail below.
Current prices compared to price dispersion 10 days before expiration by month since 2010
The expiration of contract Q was in line with the median for the last 15 years. Contract U is trading close to the median. The prices of subsequent contracts have not changed significantly. The 2025 fall contracts are trading slightly above the median values on the expiration date, while remaining within the interquartile range. The 2026 and 2027 winter contracts continue to be above the upper quartile.
Forward curve compared to 2020-2024
(Lower graph on the right)
Despite the fact that prices for 2025 contracts with delivery in three years have approached the levels of similar contracts for 2023 and 2024, there remains a pronounced skew in the forward curve in segments with the nearest (1–2 years) and most distant (5–6 years) deliveries.
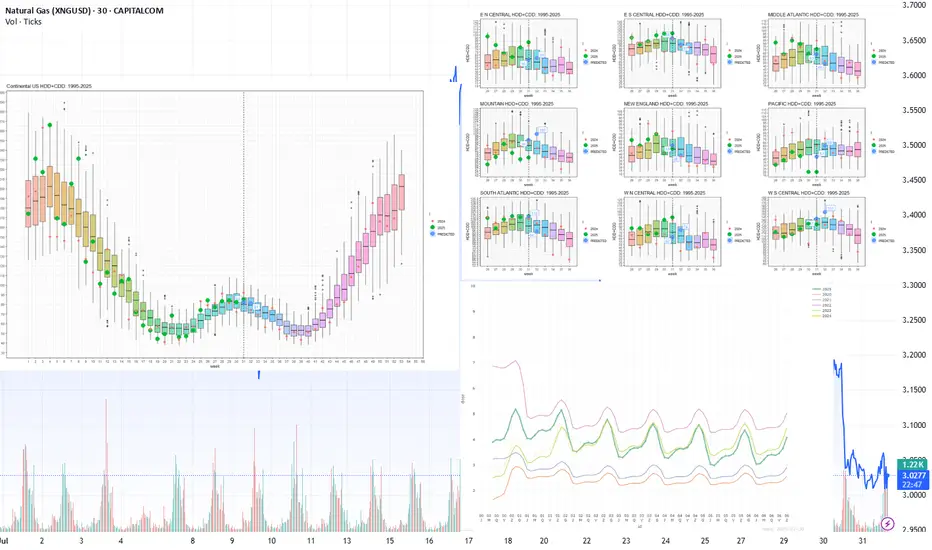
Current stocks and forecast for next week compared to 2019-2024
For week 30 (July 21-27), we expect an increase in storage of 39 BCF. The fill rate remains firmly above the median for the previous five years. Injection rates are maintaining positive momentum. If the current supply and demand conditions remain unchanged, peak levels similar to those seen in 2024 are possible. Weather and seasonal phenomena in the second half of summer and early fall remain a limiting factor.
Weekly HDD+CDD total based on current NOAA data and forecast for the next two weeks compared to 1994-2024
In the current week 31, despite expectations of HDD+CDD growth, the weather stabilized and reached the 30-year median. The following week (32) is forecast to be at the median level. The seasonal peak in weather has practically passed, and a decrease in HDD+CDD values is expected going forward.
(The graph on the left)
Explanation of the graph: the candles represent quantiles for 30 years from 1994 to 2024. Red dots represent 2024, green dots represent 2025, and blue dots represent the 2025 forecast.
Weekly HDD+CDD total based on current NOAA data and forecast for the next two weeks compared to 1994-2024 by region
(The graph at top right)
Looking at the regional breakdown, we can see moderate HDD+CDD levels in weeks 31-32 in virtually all regions except WS CENTRAL and MOUNTAIN.
Weekly total supply/demand difference compared to 2014-2024
In the current 31st week, the difference between supply and demand rose sharply above the median. With a slight decline in LNG exports, consumption for power generation and industrial production rose sharply.
Futures market
GOLD: Strong Bullish Sentiment! Long!
My dear friends,
Today we will analyse GOLD together☺️
The recent price action suggests a shift in mid-term momentum. A break above the current local range around 3,296.556 will confirm the new direction upwards with the target being the next key level of 3,310.375 and a reconvened placement of a stop-loss beyond the range.
❤️Sending you lots of Love and Hugs❤️

XAUUSD
XAUUSD Updated in 15M :
The gold signal is marked on the chart based on the latest price changes and the supply and demand in the market. These points include the entry point, stop loss, and take profit.

XAUUSD-4HXAU/USD – 4H Technical Analysis
Gold (XAU/USD) is currently testing the upper boundary of a descending channel on the 4-hour chart. The overall trend remains bearish, and this resistance zone may act as a potential reversal point.
If price fails to break above the channel resistance, a downward move toward the lower boundary is likely.
🔹 Trend: Bearish
🔹 Entry Zone: Near channel resistance
🎯 Target: 3250
🛑 Stop-Loss: 3221
Traders should watch closely for bearish price action signals at the top of the channel. A confirmed rejection could offer a shorting opportunity.

Gold Struggles at Resistance – Indicates Lower Lows AheadGold has been in a clear downtrend after facing a strong rejection around the 3,438 level (main resistance zone). Price is currently moving within a descending channel, confirming the formation of lower highs and lower lows – a classic bearish market structure.
Currently, Gold is trading near 3,306, facing resistance at 3,339 (marked as a possible lower high). If price fails to break above this level and sustain, there is a strong probability of continuation towards 3,249 and even 3,216.
Key Technical Highlights
- Immediate Resistance: 3,339 – 3,353
- Support Levels: 3,301 (short-term), 3,249, and 3,216
A rejection near 3,339 can lead to another leg down targeting 3,249 and 3,216. However, a strong breakout above 3,339–3,353 could temporarily shift momentum towards 3,394.
Note
Please risk management in trading is a Key so use your money accordingly. If you like the idea then please like and boost. Thank you and Good Luck!

Repeated pattern?We have to wait and see whether gold is going to repeat the same pattern or if this time it manages to rise from that level.

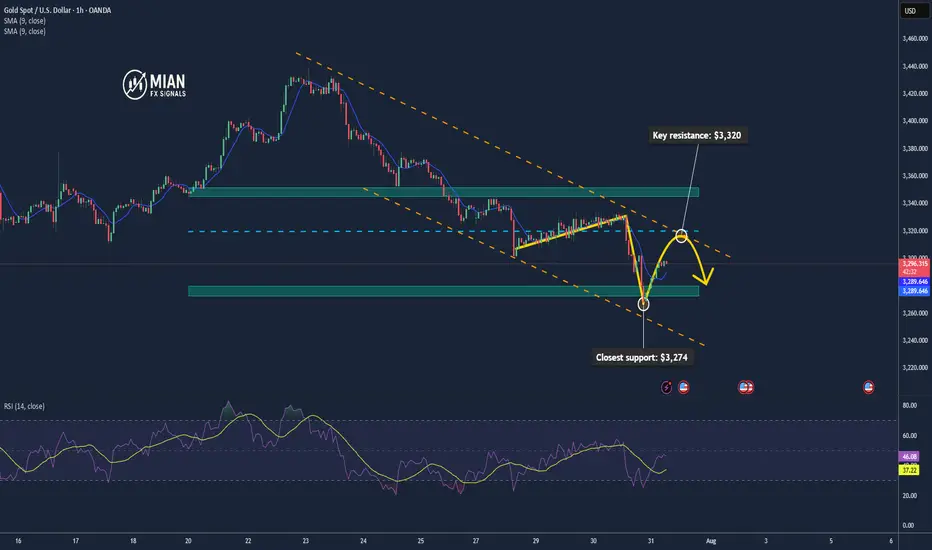
Gold May Rise Technically after Testing the $3,300 Zone📊 Market Overview:
Spot gold is trading around $3,295–$3,301/oz, influenced by slightly lower U.S. Treasury yields and a softer dollar tone. Analyst consensus from Reuters projects gold likely to stay above $3,220/oz through 2025 and possibly hit $3,400 in 2026 amid continued safe-haven demand
📉 Technical Analysis:
• Key resistance: $3,320 / $3,345
• Closest support: $3,274 – $3,280
• EMA09: Price is currently below the 9 period EMA on H1, indicating a short-term bearish bias.
• Candlestick / volume / momentum: There was a minor bounce from the support zone around $3,274, but volume remains low. RSI isn't oversold, suggesting room for technical pullback.
📌 Outlook:
Gold may experience a technical rebound if it holds above $3,280. A breakout above $3,320 would likely require clear catalyst—such as weak U.S. data or a dovish Fed tone.
💡 Suggested Trading Strategy:
SELL XAU/USD: $3,320 – $3,323
🎯 TP: 40/80/200 pips
❌ SL: $3,326
BUY XAU/USD: $3,279 – $3,282
🎯 TP: 40/80/200 pips
❌ SL: $3376
Gold Market Eyes Daily Demand Zones at 3270–3315Gold market aligns with daily candle formation, seeking to mitigate substantial demand zones between 3270 and 3315. This area may provide the necessary liquidity for a potential bullish reaction, pending confirmation. follow for more insights , comment and boost idea

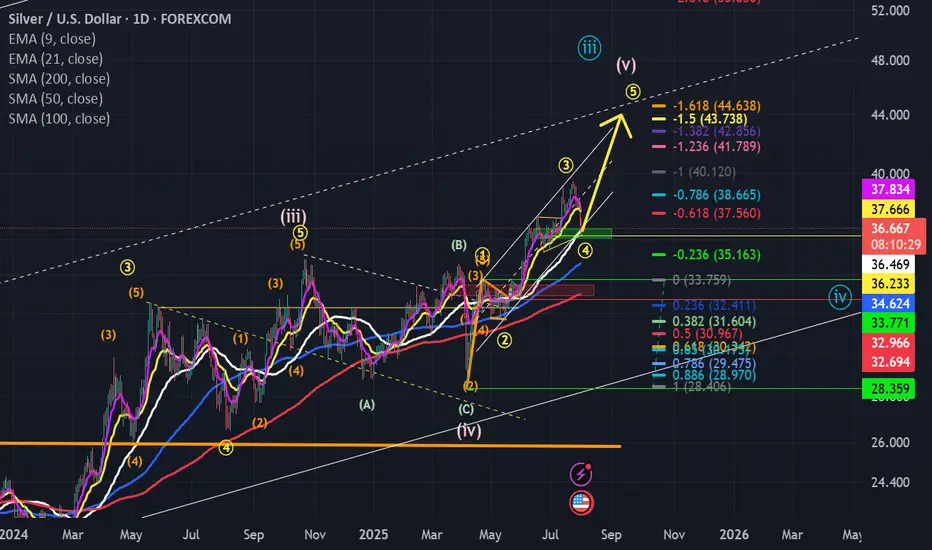
BUY AFTER THE PULLBACK Analyzing the daily time frame of silver, we can see that silver is in a bullish uptrend.
The price of silver is respecting a rising trend line which is acting as support in the past, only for some few times in the past did it exhibit a fake breakout which is indicated with an arrow.
I see the price of silver from its current price actions selling to our required point of interest and looking for buy liquidity to buy at our confluence which is both previous resistance which was broken to the upside which I indicated with a blue rectangle and a rising trend line.
Please look for buys at the previous broken resistance which is indicated with a blue rectangle in confluence with a rising trendline.
.............,...........................................
Please kindly share your thoughts on silver

GOLD BEARISHHello,
I hope you are well.
I have an excellent opportunity for you on gold.
I see a 90% chance that gold will start to fall, so get your strategies and money management ready!
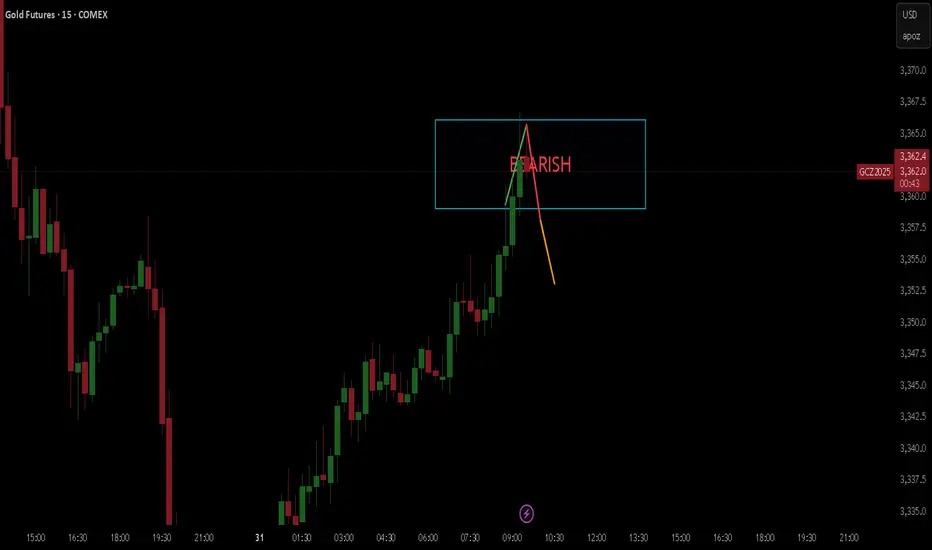
Gold Sell Setup - M15PEPPERSTONE:XAUUSD
Timeframe: m15
Risk Level: Medium
🔹 Setup:
Price is testing the upper boundary of the descending channel.
📈 Entry:
Current price zone: 3302.5
🎯 Targets (TP):
TP1: 3393
TP2: 3283
TP4: 3264
TP6: 3244
⛔ Stop Loss (SL):
3312.2
#XAUUSD #GOLD #SELL #Signal #MJTrading
Psychology Always Matters:

Gold bottomed out and rebounded, and gold is still rising!The latest news indicates that Trump has announced a 50% tariff on Brazilian products and a 25% tariff on Indian products, and has firmly stated that the tariffs will take effect on August 1st, with no further grace period. These positive factors will also support a rebound in gold.
As for tomorrow's big non-farm payrolls, considering that both the previous two times were negative and contrary to the ADP, it is very likely to be bullish for gold, which may help boost a steady rebound in gold, so there is no need to worry if you are stuck with gold.
Nothing rises forever, and nothing falls forever. Last week, the market rose in the first half, then fell in the second half. With the first half of this week's decline, the daily chart has already fallen to near the 100-day moving average. Be wary of a rebound in the second half. Gold is bearish today, but don't chase shorts. Focus on the 3300 resistance level. If it breaks above and stabilizes, expect a continued rebound to 3330-3345!
A real-time strategy is like a beacon guiding your investment journey. The market will never disappoint those who persevere and explore wisely. FX:XAUUSD VELOCITY:GOLD FXOPEN:XAUUSD ACTIVTRADES:GOLD PYTH:XAUUSD
Gold fluctuates. Is the decline halted?Information Summary:
Despite diminished market expectations for a September US rate cut, gold rebounded from a one-month low hit the previous session on Thursday, boosting its safe-haven appeal as newly announced US tariffs sparked new trade uncertainty.
So far, gold has risen 1.15%, hovering around $3,310, a gain of nearly $40 today. On Wednesday, gold prices hit their lowest point since June 30th: $3,267.79.
Market Analysis:
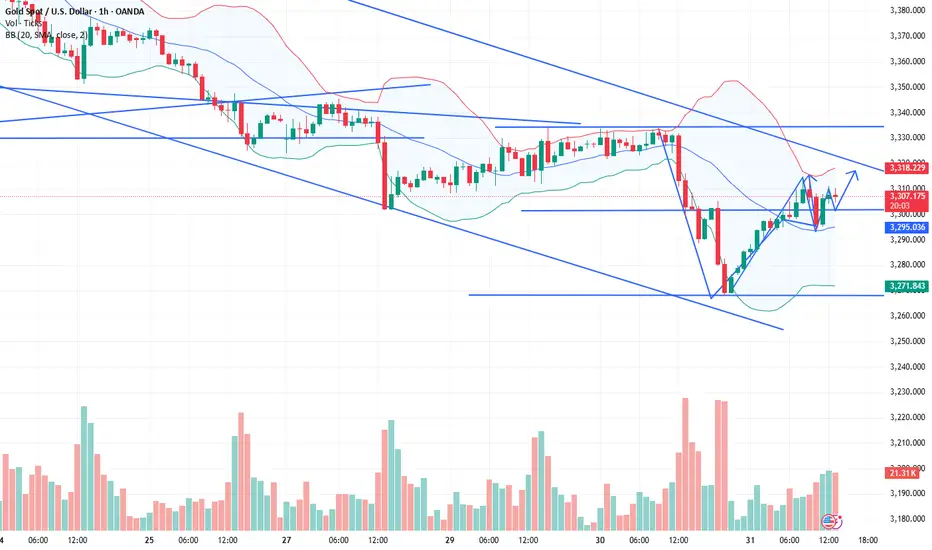
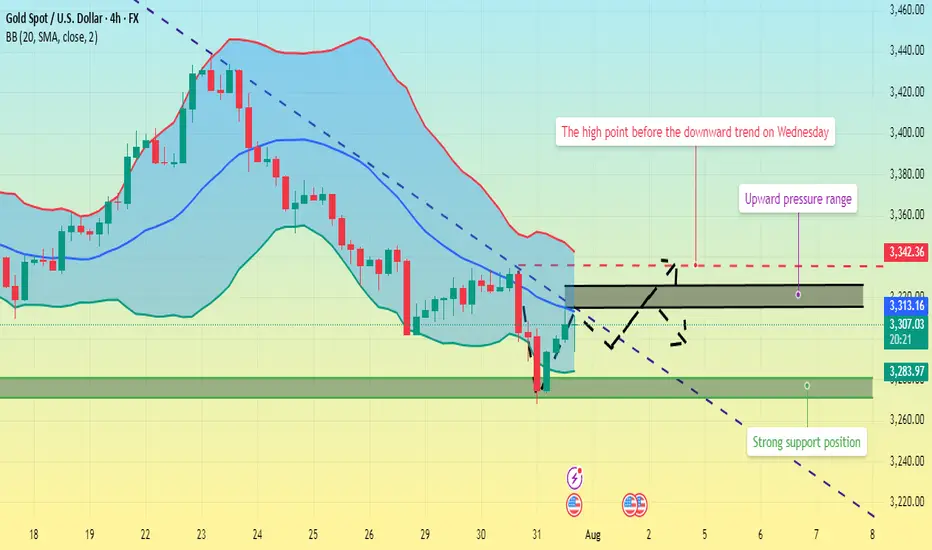
On the 4-hour chart, prices remain below the middle Bollinger Band, with a descending trendline defining the current bearish momentum. Prices rebounded after hitting this month's low on Wednesday. In the short term, watch for price rejection signals near the trendline. Upward pressure currently lies between $3,315 and $3,325, while support lies between $3,280 and $3,270.
Currently, prices are fluctuating upward. Quaid believes the bullish trend may continue. If the current resistance level is broken, it could reach the 3335 high before Wednesday's decline.
Trading strategy:
Go long near 3300, stop loss at 3290, profit range 3320-3330.
Full review of my NY basket and trading ideas for todayFull analysis and trading ideas for todays NY session for DXY, Silver, Gold, WTI, NAS, S&P, DJ30

GOLD Buyers In Panic! SELL!
My dear friends,
Please, find my technical outlook for GOLD below:
The instrument tests an important psychological level 3309.2
Technical Indicators: Supper Trend gives a precise Bearish signal, while Pivot Point HL predicts price changes and potential reversals in the market.
Target - 3296.9
Recommended Stop Loss - 3316.4
About Used Indicators:
Super-trend indicator is more useful in trending markets where there are clear uptrends and downtrends in price.
Disclosure: I am part of Trade Nation's Influencer program and receive a monthly fee for using their TradingView charts in my analysis.
———————————
WISH YOU ALL LUCK

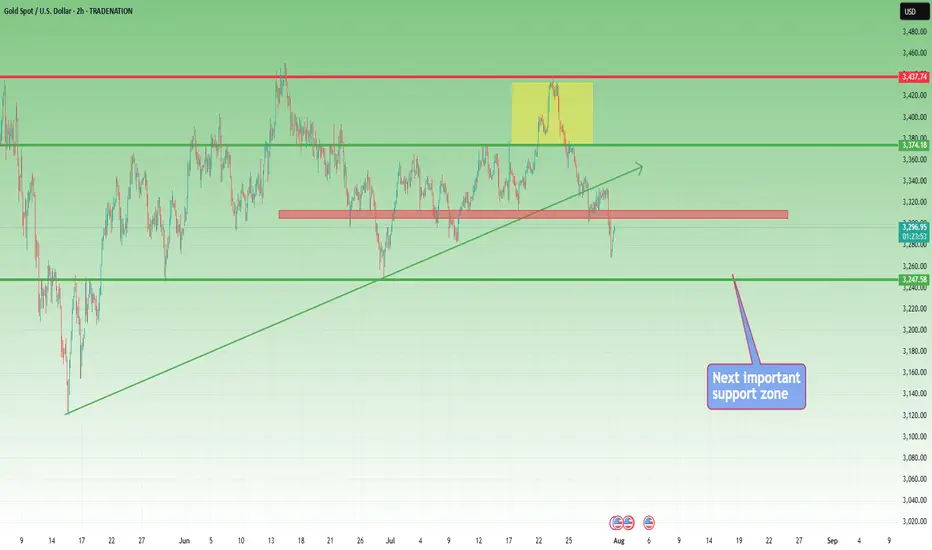
Gold's final battle at the end of the weekGold's final battle at the end of the week: Bulls face a do-or-die battle, awaiting the verdict of the non-farm payroll report!
Key Points:
Gold prices fell for three consecutive days this week, plummeting from a high of 3438 to 3268, a $170 drop that demonstrates the ferocity of the bears. While the trend reversed at the 3430 level, the sell-off below 3350 was more severe than expected—the market once again proves that premature bottom-fishing in the face of a trend is a dangerous gamble. Gold prices are currently approaching the lower Bollinger Band, a crucial level. Two key trading days, Thursday and Friday, will determine the trajectory for August. If bulls capitalize on the non-farm payroll report to stage a comeback, the trend will remain unchanged; if the 3250 level is breached, a deeper correction could be triggered.
Technical Tipping Points for Bulls and Bears:
Daily Bollinger Band Narrowing: The 3268 low coincides with support at the lower Bollinger Band. If the market closes positive today and stabilizes, the Bollinger Bands will maintain their narrowing pattern, and the rebound momentum will target the 3300-3330 resistance zone. Conversely, if a large bearish candlestick breaks through, the Bollinger Bands will open downwards, and bears may decline to the 3250-3150 abyss.
H4 chart: A glimmer of hope: After Wednesday's 3268 low, the market quickly rebounded to 3290. The H4 market has clearly signaled a stop in the decline, and the corrective rebound may continue in the Asian and European sessions. However, caution is advised—the US market is the real battlefield! The past three trading days have seen a "bull slaughter" in the US market. If tonight's data supports a reversal and a firming of 3330, a bull market in August is expected; otherwise, a continued decline could put 3250 at risk.
Trading Strategy and Emotional Management:
For traders: Hold overnight long positions at 3275. If the market dips back towards 3275 during the Asian and European sessions, add to your long positions with a small position (strictly set a stop-loss at 3265). Reduce your position in batches, targeting 3300-3330.
Key Reminder: Do not blindly short at the current price! The daily bullish trend remains intact. The market is like a compressed spring after the $170 plunge. Any positive data (such as a surge in unemployment benefits or a surprise non-farm payroll report) could trigger a retaliatory rebound.
Psychological Defense: Traders must face up to this week's mistakes—premature bottom-fishing at 3350 led to passive behavior. However, the market never sympathizes with tears. Staying calm is even more crucial at this moment: A move above 3250 is not considered a bearish trend, and a move below 3330 is not considered a bullish trend. Let the data determine everything.
Tonight's Market Prediction:
Optimistic Scenario: Weak unemployment data → US market breaks through 3300 → Pre-non-farm payrolls bulls warm up to 3330 → Weekly long lower shadow lays the foundation for an August counterattack.
Pessimistic Scenario: Negative data crashes the market → 3275 falls → Panic selling tests 3250 → Foreshadows a deep correction in August.
Personal Attitude:
Despite significant short-term weakness, the foundation of gold's annual bull market remains intact (geopolitical risks + stagflation expectations). The current decline is more of a technical correction than a trend reversal. The 3268 area offers medium- to long-term investment value. However, trading is not about faith. If 3250 is confirmed to have fallen by Friday's close, decisive stop-loss orders should be taken to avoid the attack. A true hunter must have both the courage to pick the bottom and the courage to admit mistakes.

buy copper! buy copper!Trump discounted coppers value over 20% due to 50% tariffs as we know usually is temporary and a negotiating tactic. also copper needed a clear market correction after this years impulse in price. heres the last chance

Gold is faking a bullish trapWe are gonna go down to the 3294 level before we see a bounce up. The 3294 level is gonna show up as a strong support to push trough the 3345 area.

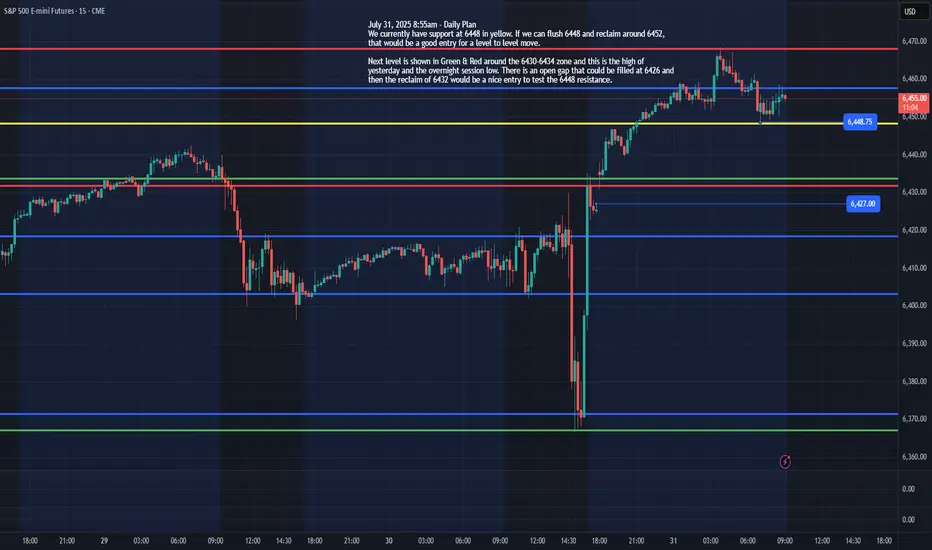
ES - July 31st Daily PlanJuly 31, 2025 8:55am - Daily Plan
We currently have support at 6448 in yellow. If we can flush 6448 and reclaim around 6452, that would be a good entry for a level-to-level move and target 6460, 6468.
Next level is shown in Green & Red around the 6430-6434 zone, and this is the high of yesterday and the overnight session low. There is an open gap that could be filled at 6426 and then the reclaim of 6432 would be a nice entry to test the 6448 resistance, could then continue to move higher to 6460, 6468+.
Those are the areas I will be looking to grab some points today!
XAUUSD Update – Down Continuation to 3250?1. What Happened Yesterday
After an anemic correction that formed a bearish flag, Gold finally broke below 3300 and even dipped under the 3280 support zone — which was my primary downside target. While the move during the day didn’t have enough momentum to reach my second sell limit, I was already in a low-volume short position, so I didn’t miss the move entirely.
2. The Key Question
Has the drop ended, or are we looking at further downside?
3. Why I Expect More Downside
• The overall structure remains bearish.
• The newly formed resistance (previous support) is now the new sell zone.
• If the price drops towards 3280 again, continuation to 3250 becomes very probable.
4. Trading Plan
Selling rallies remains the preferred strategy, especially on spikes into resistance. As long as the price stays below 3335-3340 zone, the bearish outlook remains intact.
5. Conclusion
Sell the rallies. The technical picture still favors downside continuation — no need to overcomplicate it. 🚀
Disclosure: I am part of TradeNation's Influencer program and receive a monthly fee for using their TradingView charts in my analyses and educational articles.
GoldGold Giving pulllback and then again go sell this time target is 3247..if this level breaks and any close below h4 it will further downside

Not time to dismount yet!!!Dont get shaken off the horse...yet. There is more to come imo...this is to shake the weak hands...