XAUUSD bullish reversal from a demand zoneThe setup also aligns with a liquidity sweep below previous lows, which could trigger a reversal. Price is now breaking minor resistance levels, creating early confirmation for bullish momentum.
Futures market

XNGUSD CONTINUES ITS DOWNWARD TREND. FOR HOW LONG?XNGUSD CONTINUES ITS DOWNWARD TREND. FOR HOW LONG?
Recent bearish impulse started at the beginning of this week may come to an end soon. Yesterday the U.S. Natural Gas Storage report came out. Numbers appeared to be lower than expected and lower than previous. (23b vs 28b vs 46b). This is bullish signal for the market participants. Minutes after the report came out, market reacted bullish, however, soon price went sideways.
Right now gas prices continue to decline. Still, the opportunity for short-sellers here is quite limited. Not so far below there is a level of 3.0000, form where I expect the price to rebound, supposedly to a 3.3000.
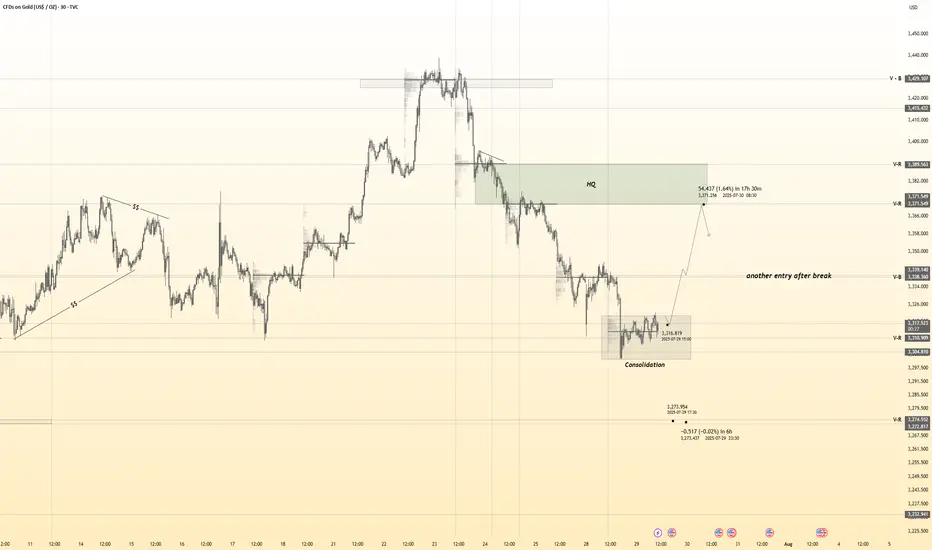
GOLD (XAUUSD) Short IdeaGold is in consolidation right now. Possible break below and fall until 3285.
Good Luck!

Gold 30Min Engaged ( Bullish Reversal Entry Detected )Time Frame: 30-Minute Warfare
Entry Protocol: Only after volume-verified breakout
🩸Bullish Reversal - 3318
➗ Hanzo Protocol: Volume-Tiered Entry Authority
➕ Zone Activated: Dynamic market pressure detected.
The level isn’t just price — it’s a memory of where they moved size.
Volume is rising beneath the surface — not noise, but preparation.
🔥 Tactical Note:
We wait for the energy signature — when volume betrays intention.
The trap gets set. The weak follow. We execute.
Crude Oil’s $70 Surge Still Faces 3-Year Channel ResistanceAlthough news points to a crude oil price surge, technical analysis indicates price cap risks remain within the borders of a 3-year descending channel.
Should a clear hold emerge above the $70 barrier, the bullish rebound in price action from the $64.40 zone, in line with the weekly RSI’s rebound off the neutral 50 zone, may extend toward the channel’s upper boundary at $72.40, $74.40, and $77 in more extreme scenarios.
A confirmed hold above the $77–78 zone may shift the primary trend away from bearish dominance and pave the way for longer-term bullish forecasts.
On the downside, if a price drop results in a clean break below the $64 barrier, downside risks may extend toward the mid-zone of the long-standing channel, with potential support levels at $63.20, $61.80, and $59.70, respectively.
Written by Razan Hilal, CMT

XAUUSD H2 | Downside Target 3270Gold (XAUUSD) recently rejected from a key resistance zone around 3300, showing strong bearish momentum on the 2H timeframe.
💡 Setup Idea:
• Price broke support → Retest as new resistance ✅
• Clean imbalance left behind → Fills expected 📉
• Target: 3270 zone (300 pips move) 🎯
• Risk-Reward potential is solid for intraday/swing entries.
Trade Plan:
If price holds below 3300, we expect continuation toward the 3270 zone. This area also aligns with previous structure and liquidity grab.
🕐 Timeframe: 2H
📌 Resistance: 3300
🎯 Target: 3270
📍 RR: 1:2+
#XAUUSD #GoldSetup #PriceAction #SmartMoney #FXTrading #TradingView #ForYou

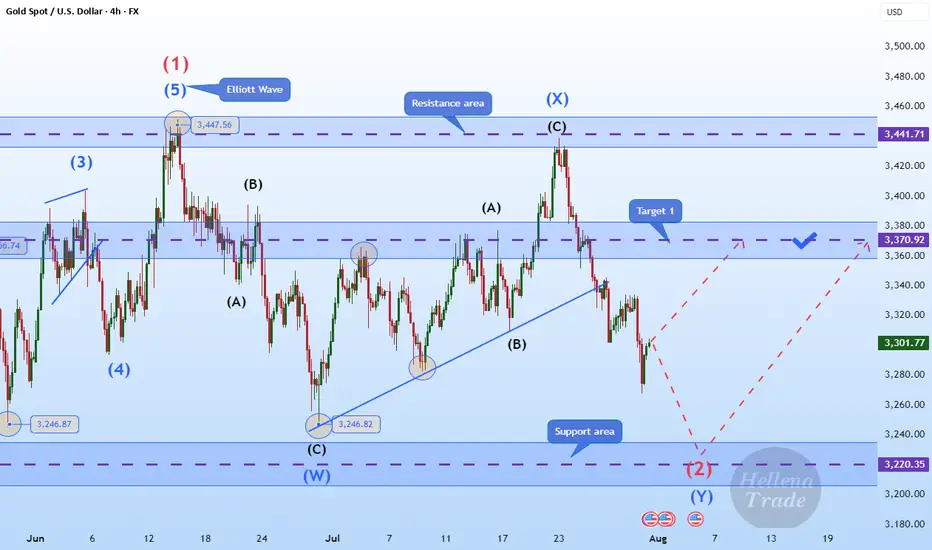
Hellena | GOLD (4H): LONG to area of 3370 (Wave 2).Colleagues, gold is once again disrupting our plans, and I have to revise the wave marking. It's not easy, but the most important thing is to keep doing it.
Now I'm back to the previous marking — the price is in wave “2” correction.
To complete this wave, the price needs to overcome the level of wave “W” of the middle order 3246.82. Then the correction will be completed and wave “3” will begin an upward movement.
I see the minimum target in the area of the 3370 level.
Manage your capital correctly and competently! Only enter trades based on reliable patterns!
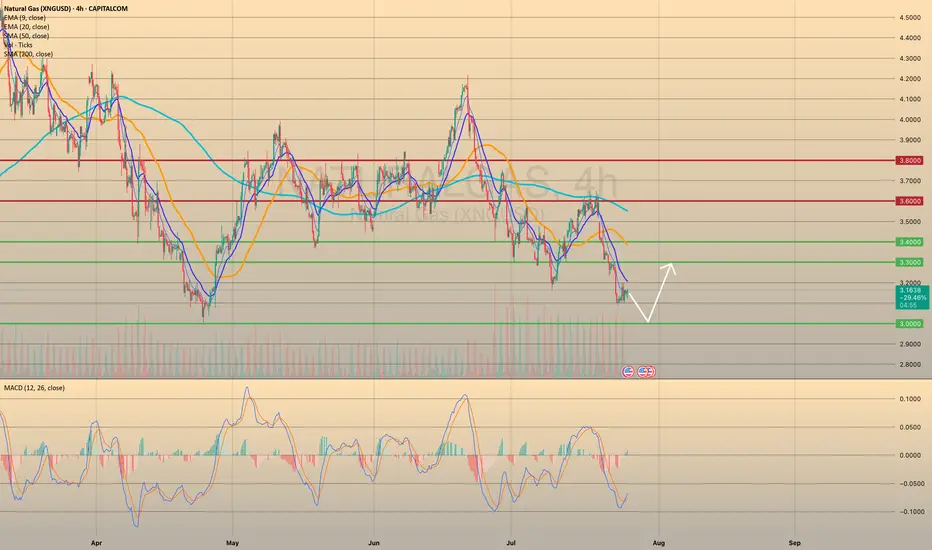
NATURAL GAS REACHED THE KEY SUPPORT LEVEL. WHERE TO GO NEXT?NATURAL GAS REACHED THE KEY SUPPORT LEVEL. WHERE TO GO NEXT?
XNGUSD has come to a crucial support level of 3.0000. Although the sentiment here stays as quite bearish (seasonally, August is not the perfect month for natgas buyers), we expect the price to rebound from the level of 3.0000 towards 3.3000 first. Afterwards, the continuation of bearish trend is expected with final target of 2.6000 before cold season beginning.

SILVER SENDS CLEAR BEARISH SIGNALS|SHORT
SILVER SIGNAL
Trade Direction: short
Entry Level: 3,820.7
Target Level: 3,794.3
Stop Loss: 3,837.9
RISK PROFILE
Risk level: medium
Suggested risk: 1%
Timeframe: 1h
Disclosure: I am part of Trade Nation's Influencer program and receive a monthly fee for using their TradingView charts in my analysis.
✅LIKE AND COMMENT MY IDEAS✅

Summary of Today's Trading StrategyPrimary Bias: "Clearly Bearish" (Influenced by last night's Fed news).
Primary Plan: "Sell" on Rally (Sell the Rally)
Concept: Following the strong bearish trend, wait for the price to make a small upward correction to find a favorable entry point for a Short position.
Entry Points:
Entry Point 1 (Fib 0.618 M15 / Minor Resistance): Approximately 3,305 - 3,310 USD.
Condition: Wait for a clear bearish reversal candlestick signal.
Entry Point 2 (Strong Resistance): Approximately 3,325 - 3,330 USD (the previous support that was just broken).
Condition: If the price bounces up to this level and shows a reversal signal, it will be a much more advantageous point for a Short entry.
Take Profit (TP):
TP1 (Recent Low): Approximately 3,280 - 3,290 USD (the "Area of Interest" zone in H4).
TP2: If this zone is broken, there is a chance to move down to 3,260 - 3,270 USD.
Stop Loss (SL):
Above the Short entry point or above the next resistance level by approximately 5-10 USD.
Secondary Plan: "Sell" on Breakdown Continuation
Concept: If the price doesn't bounce to a resistance level and instead continues to break below the previous low.
Entry Points:
Break below approximately 3,280 - 3,290 USD (the recent low / H4 support).
Take Profit (TP):
TP1: Approximately 3,260 USD.
TP2: Approximately 3,250 USD.
Stop Loss (SL):
Above the low that was just broken by a small margin.
Additional Cautions:
Low Volume in the Morning: The market may not move severely until the London Session (in the afternoon).
Avoid Counter-Trend Long Positions: Opening a Long position is very high-risk because the main trend is clearly and strongly bearish.
Risk Management: Determine an appropriate lot size and always set a Stop Loss (SL) for every order.
Good luck with your trading today! 📈📉

GOLD Breakdown Setup | Clean Sell Targets Ahead!XAU/USD (Gold) Analysis – 2H Timeframe
After a clear rejection from higher levels, Gold has pulled back to retest the broken support zone around 3340–3350, which now acts as a resistance.
If the price sustains below this zone, we can expect a smooth move down toward clean liquidity areas below.
This is a textbook bearish continuation setup. 💥
🔻 Trade Idea – Short Setup:
• Sell Below: 3,340
• Target 1: 3,300
• Target 2: 3,280
• Stop Loss: 3,355 (above resistance zone)
🧠 Confluences:
• Bearish market structure
• Support zone retest
• Trend continuation
• High-impact USD news ahead (watch for volatility)
📅 Key Dates: July 30 – Aug 1
⚡ NY session could trigger the move!


Gold Market Update: Major Support at and Supply atGold is recovering after a strong drop from the previous range high. Price is approaching a 4H Order Block near the 3300–3310 zone, which may act as a supply area. A minor liquidity zone has just been tapped, suggesting a potential short-term rejection.
The major support lies at 3269, which sparked the recent bullish move. If price rejects from the OB zone, a pullback toward this support is likely. However, a clean break and hold above the OB may signal further upside.
📌 Key Levels:
Supply Zone: 3300–3310
Support: 3269
🧠 Wait for clear confirmation before executing trades.

Will Upcoming Data Determine the Next Gold's Direction?Macro approach:
- Gold retreated this week, reversing early gains to trade near four-week lows amid renewed US dollar strength and caution ahead of the Fed's policy decision.
- The retreat was mainly pressured by stronger-than-expected US economic data and a tentative revival in risk appetite, offsetting pockets of safe-haven demand.
- Key drivers included robust US GDP growth for 2Q, a bounce in consumer confidence, and the Fed's steady rates with a more hawkish tone, suggesting cuts may be further out.
- Meanwhile, recent US-EU and US-China trade deals eased some global uncertainty, damping gold's appeal as a hedge.
- Market participants also eyed the labor market's continued cooling, but resilient consumer spending further buoyed the dollar.
- Gold may remain volatile, with potential upside if upcoming US PCE inflation and NFP reports disappoint expectations. Any escalation in trade tensions or signals of Fed policy easing could renew support for gold prices.
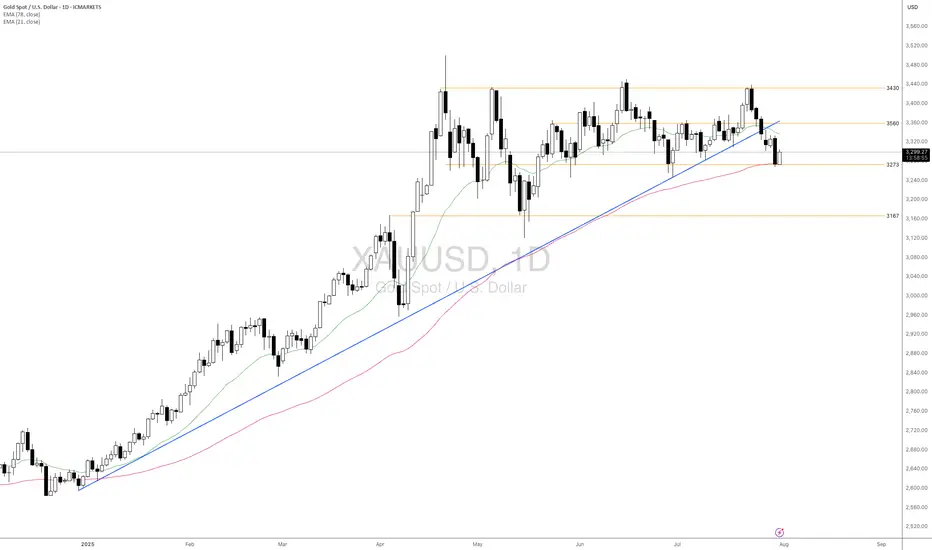
Technical approach:
- XAUUSD fluctuated within the range of 3285-3560, which is below the broken ascending trendline. The price between the two EMAs awaits an apparent breakout to determine the next trend.
- If XAUUSD breaks below the support at 3273, confluence with EMA78, the price may plunge to retest the following support at 3167.
- On the contrary, remaining above the support at 3273 may lead XAUUSD to retest the resistance at around 3560.
Analysis by: Dat Tong, Senior Financial Markets Strategist at Exness

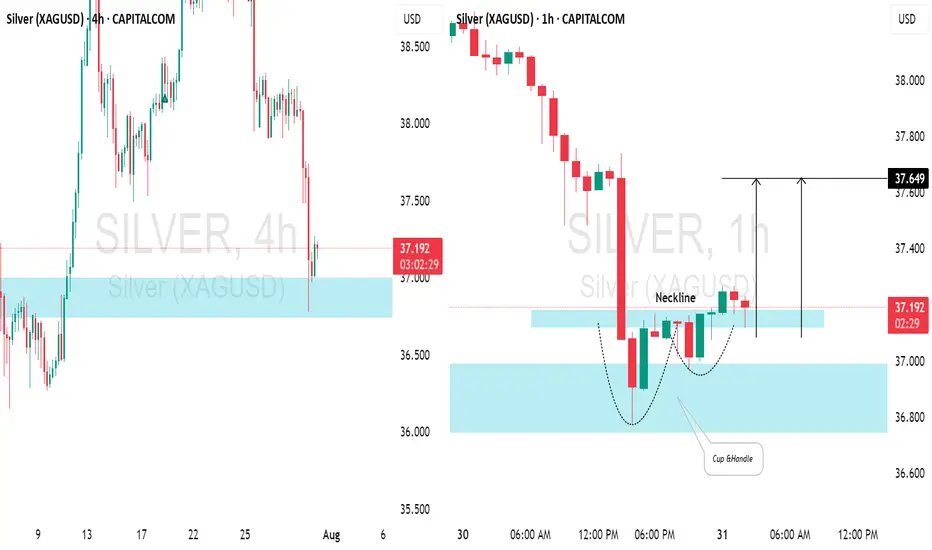
SILVER (XAGUSD): Time for Pullback📈SILVER appears to be oversold following yesterday's decline.
After testing a significant daily / intraday support level, there's a noticeable bullish reversal.
The price formed a cup & handle pattern on the hourly chart and has broken above its neckline. We can expect a pullback to at least 37.64.
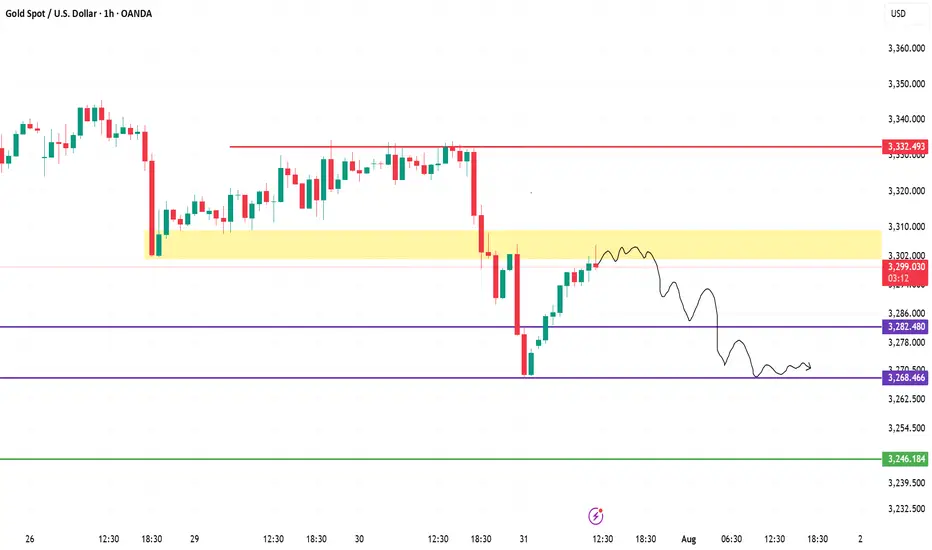
XAUUSD (Gold) Analysis – 1H Chart | July 31, 20251. Fakeout & Rejection from Supply
Price faced sharp rejection near the 3,332 resistance. The strong red candle indicates aggressive selling and liquidity grab.
2. Retest of Broken Demand Zone
Gold is now retesting the **3,298–3,305** yellow zone, which previously acted as demand but may now flip to resistance (supply).
3. Bearish Market Structure
The price formed a **lower high and lower low** pattern — a clear sign of downtrend resumption. Current bounce looks corrective.
4. Projection: Potential Drop Ahead
As per the drawn path, if price fails to reclaim above 3,305, a likely drop toward 3,282, then 3,268 is expected.
5. Key Levels to Watch
Resistance: 3,305 → 3,332
Support: 3,282 → 3,268 → 3,246
Bearish bias remains valid below 3,305.
Trump Tightens the Grip, the IBEX Holds FirmWill the IBEX 35 End July at New Highs? Futures Point Up Despite Tariff Threat
By Ion Jauregui – Analyst at ActivTrades
The IBEX 35 could end July near record highs following a strong opening across European markets. At 08:10 CET, futures on the Spanish benchmark were up 0.54% to 14,445 points, showing more strength than their peers: Euro Stoxx 50 futures rose 0.22%, the German DAX 0.28%, and the UK FTSE 100 0.07%.
This upward momentum comes despite a growing international risk: U.S. President Donald Trump has announced a 15% tariff on all imports from Europe, including industrial, agricultural, pharmaceutical, and luxury goods. Fortunately, Europe has chosen not to escalate the conflict by imposing additional tariffs beyond those already in place. A tit-for-tat scenario could have pushed European inflation higher — something the ECB governance is keen to avoid.
Potential Impact on the IBEX 35
The tariff decision introduces uncertainty for key sectors within the IBEX 35, especially those with strong international exposure such as Inditex, Grifols, IAG, Acerinox, and Gestamp, which could face margin pressure and weaker exports. In the short term, the outcome will depend on the European Commission’s response, which is already considering coordinated countermeasures.
Still, investors appeared optimistic in early trading, focusing on a solid round of earnings from Spanish companies. Meliá, Viscofan, PharmaMar, Sanjosé, and Inmobiliaria del Sur posted strong first-half results, lending support to the index. On the downside, BBVA reported a 2% drop in quarterly net profit, and the Bank of Spain has reduced its systemic buffer requirement for the bank.
Technical Analysis
The IBEX 35 is trading near its key resistance level at 14,500 points. A monthly close above that level would confirm a breakout from annual highs, potentially opening the path to 14,800 points. However, the tariff threat could bring short-term volatility.
Since late May, the index has been moving within a price consolidation range, but in the past two sessions it has shown signs of a bullish breakout above the previous high at 14,358 points. The Point of Control (POC) currently lies at 14,000 points, providing immediate support. Momentum indicators and moving average crossovers suggest the current push is backed by the 50-period moving average and an ongoing price expansion.
• Supports: POC at 14,000; key support at 13,599 (consolidation zone)
• Resistances: At current highs
• MACD and RSI: Indicate a growing overbought trend and increasing bullish volume
Despite Trump Tariff Storm
Despite the new tariff front opened by Donald Trump, the IBEX 35 displays a resilience worth noting. Backed by solid corporate earnings and favorable technicals, bulls remain at the helm — for now. The risk of a full-scale trade war still looms, but Europe’s decision not to retaliate has eased inflation concerns.
And like that brave brigantine that sailed stormy seas, the IBEX remains steady and defiant, unshaken by winds or tempest. “Asia to one side, Europe to the other...” Today, the Spanish index sails toward new highs, hoping to close July with all sails unfurled.
*******************************************************************************************
The information provided does not constitute investment research. The material has not been prepared in accordance with the legal requirements designed to promote the independence of investment research and such should be considered a marketing communication.
All information has been prepared by ActivTrades ("AT"). The information does not contain a record of AT's prices, or an offer of or solicitation for a transaction in any financial instrument. No representation or warranty is given as to the accuracy or completeness of this information.
Any material provided does not have regard to the specific investment objective and financial situation of any person who may receive it. Past performance and forecasting are not a synonym of a reliable indicator of future performance. AT provides an execution-only service. Consequently, any person acting on the information provided does so at their own risk. Political risk is unpredictable. Central bank actions can vary. Platform tools do not guarantee success.

Silver on the path of growth and developmentAs I mentioned in the previous article, silver is moving towards the desired target, which is around $40 per ounce of silver. As you can see, this three-month chart and the uptrend drawn and reproduced shows the desired price target near the top of the channel.
If there is a change and an update is needed, I will definitely check and publish it again.
Good luck.
MJ .REZAEI

Gold is Falling Sharply – Will It Keep Falling?Hello dear traders, what’s your view on XAUUSD?
Yesterday, XAUUSD continued its strong downtrend and is now trading around 3,296 USD.
The recent drop in gold is largely due to the strengthening U.S. dollar, following the Federal Reserve’s decision to hold interest rates steady as expected — despite sharp criticism from President Donald Trump.
Technically speaking, after breaking below the rising trendline, gold failed to retest successfully and plunged further, confirming that the bearish trend is now in control. Price is currently moving below key moving averages, and the structure has clearly formed a sequence of lower highs and lower lows — reinforcing the likelihood of continued downside.
If a pullback occurs before the next leg down, the Fibonacci 0.5 and 0.618 retracement zone — which aligns with the EMA 34 and 89 and a major resistance level — will be a key area to watch. This could present a prime opportunity for breakout and trend-following traders.
Looking ahead, the next key support sits near 3,220 USD. If this level breaks, gold may head toward the 3,162 USD zone.
What do you think? Will gold keep falling, or will buyers step in? Drop a comment and hit follow to catch the next big move!

Platinum Breakout Stalk: Thief Entry Only After Confirmed🧠 Thief's Heist Plan Activated!
Asset: XTI/USD (PLATINUM) 💎
Strategy: Bullish Pullback + Breakout Play 💥
🔍 We stalking platinum's neutral zone… waiting for that clean breakout!
No early entries, no premature SLs. Discipline = Profits. 🎯
🎯 Entry: After breakout confirmed. Use multiple DCA limit orders to layer in like a ghost.
🔐 Stop Loss: ONLY after breakout – Place at 1280.00 🛡️
💎 Target: 1560.00 – Vault unlock point! 💰
📵 DO NOT place SL or orders before breakout – patience is the thief’s edge. 🧘♂️
This isn’t gambling... this is precision trading. Breakout = green light 🚦
Get ready to raid the platinum vault!
#ThiefTrader #BreakoutStrategy #PlatinumHeist #XTIUSD #BullishSetup #SmartMoneyMoves

XAU/USD at Make-or-Break: $3,304 Holds the Key!"XAU/USD is testing a key resistance at $3,304. A breakout could trigger a rally to $3,315, while rejection may lead to a drop to $3,292."
Price Action & Key Levels
Support: 3,298 → 3,292 (critical demand zone).
Resistance: 3,304 → 3,310 (supply zone).
Breakout Level: 3,304 (confirmation needed).
Indicator-Based Evidence
RSI: "RSI at 62 (not overbought), suggesting room for upside."
MACD: "MACD histogram is rising, supporting bullish momentum."
Moving Averages: *"Price above 9 & 21 EMA, short-term trend bullish."
Fundamental Context
"Gold is supported by Fed rate cut expectations, but a strong USD could limit gains."
"Geopolitical risks (e.g., Middle East tensions) may boost safe-haven demand."
Scenario 1: Bullish Breakout
Entry: Buy above $3,304 (confirmed close).
Target: $3,310 → $3,315.
Stop-Loss: Below $3,298 (risk management).
Scenario 2: Bearish Rejection
Entry: Sell below $3,298.
Target: $3,292 → $3,288.
Stop-Loss: Above $3,306.
What a turnaround on copper futuresManipulation? Smells like it, but of course, this is just the market we are currently living in.
Let's dig in.
MARKETSCOM:COPPER
COMEX:HG1!
Let us know what you think in the comments below.
Thank you.
75.2% of retail investor accounts lose money when trading CFDs with this provider. You should consider whether you understand how CFDs work and whether you can afford to take the high risk of losing your money. Past performance is not necessarily indicative of future results. The value of investments may fall as well as rise and the investor may not get back the amount initially invested. This content is not intended for nor applicable to residents of the UK. Cryptocurrency CFDs and spread bets are restricted in the UK for all retail clients.
