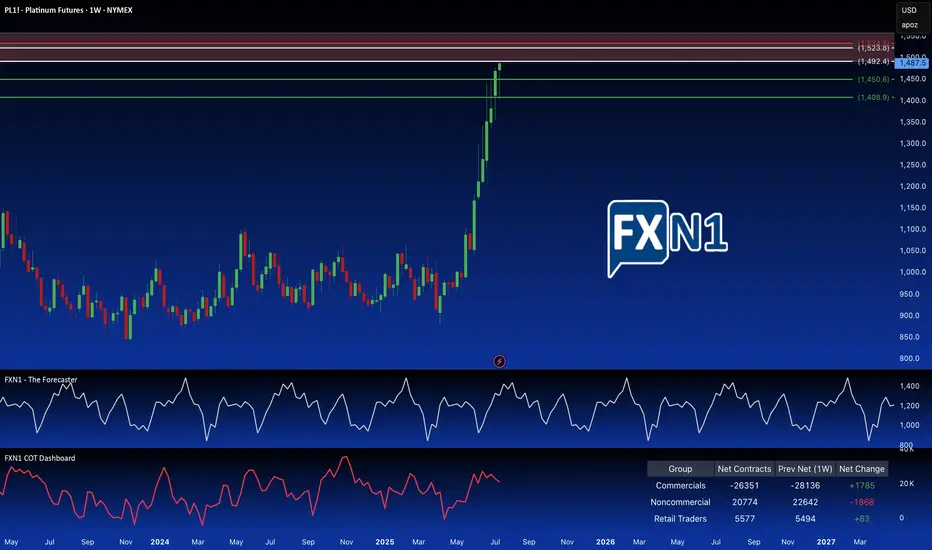
Platinum: Breaking the Supply Barrier?I'm adding a second Platinum position. Price has hit a strong weekly supply area, also a significant monthly supply zone. I'm anticipating a reversal here, as non-commercial holdings are decreasing, and seasonal patterns suggest a potential trend change. To further capitalize on potential upside, I've placed a pending order above the primary supply zone, at a slightly higher, but still relevant. These are older, established and fresh supply zones.
(Note: Reducing the chart size may help to better visualize the long-term significance of these overlapping areas.)
✅ Please share your thoughts about PL1! in the comments section below and HIT LIKE if you appreciate my analysis. Don't forget to FOLLOW ME; you will help us a lot with this small contribution.
Futures market
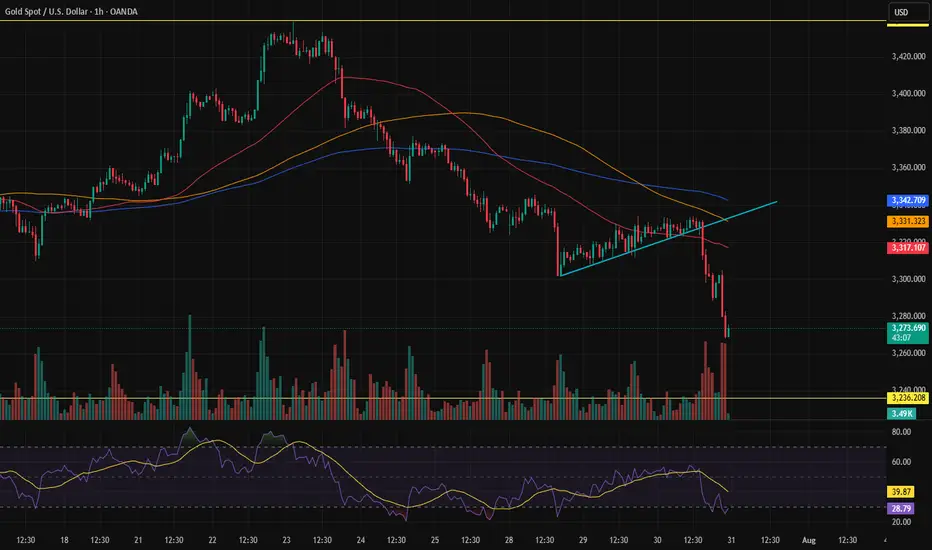
Gold Wave Analysis – 30 July 2025- Gold falling inside wave b
- Likely fall to support level 3250.00
Gold is under bearish pressure after the price broke the two upward-sloping support trendlines from May and February.
The breakout of these support trendlines accelerated the active short-term correction b – which belongs to the impulse wave 3 from June.
Gold can be expected to fall further to the next round support level 3250.00 (former low of waves 2 and (b) from May and June).

MGC Bear Flag or Dead Cat Bounce? Tokyo’s About to DecideClean structure forming on MGC after a heavy impulse sell during NY session. We’re now consolidating below VWAP in what looks like a textbook bear flag or descending wedge.
We had a sharp breakdown from the highs with no real attempt to reclaim the structure. Price is now compressing underneath the 9/21 EMAs and VWAP clear bear pressure. Volume POC from this range is sitting around 3,332.7, and price can’t even sniff it. Fibonacci 50% retrace off the sell leg aligns with POC stacked resistance.
Entry marked at 3,318.4, targeting a breakdown into 3,268.4 roughly the measured move from the flag.
Quant Confluence:
- Under VWAP
- Below 9 & 21 EMA
- Fib 50% rejection
- Bear flag structure
- POC rejection zone
If I'm Wrong:
If price closes above 3,332.7 (POC) or breaks and holds above VWAP, the bear thesis weakens significantly. Flip long only on a full structure reclaim.

GoldXau usd daily analysis
Time frame 4 hours
Maybe Earthquake in the east of Russia 🇷🇺 makes a revolution in the markets .
I never open a short or long position in this times.
I'm waiting and watching the markets.
I think the grey lines are the reverse point
So I must wait now

XAUDUSD SELL LIMITSymbol: XAU/USD
Timeframe: 15 Minutes (15m)
Trade Direction: Short (Sell)
Exact Entry Price:
3,295.254
Entry Rationale: This point is located within the FVG (Fair Value Gap) and at the 78.0% Fibonacci level (Optimal Trade Entry - OTE zone), which has a high potential for a price reaction and attracting sell orders.
Exact Stop Loss:
3,305.953
Stop Loss Rationale: This price is set slightly above the high of the bearish Order Block and also above the Swing High at 3,302.658 to protect the trade from a potential liquidity grab (Stop Hunt).
Exact Take Profit (TP1):
3,270.916
Take Profit Rationale: This target is set at the recent low. This area acts as a sell-side liquidity pool and is the next logical target for the price after pulling back to the supply zone.

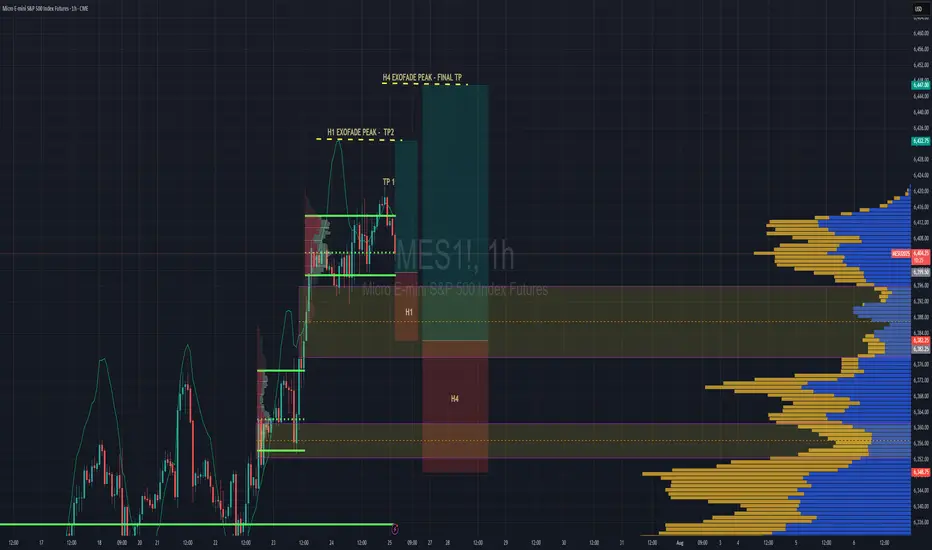
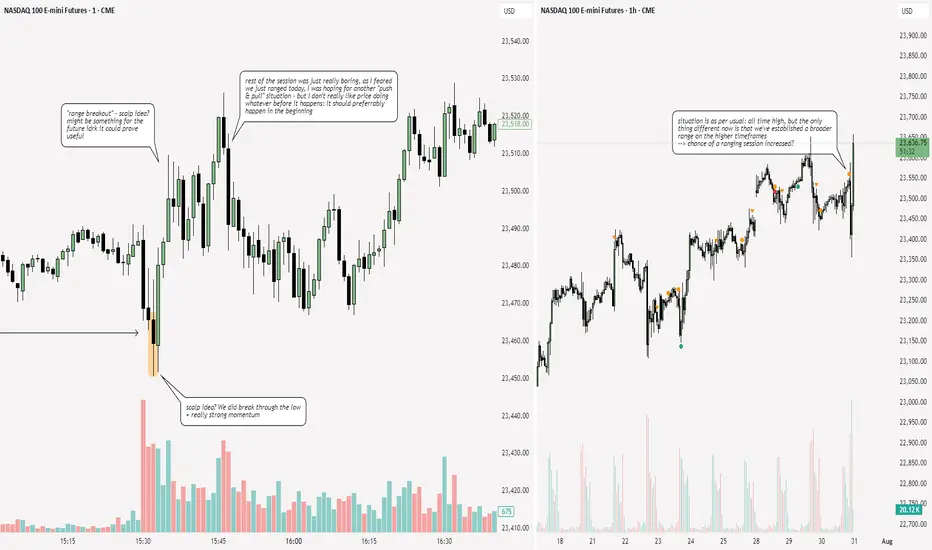
S&P 500 Intraday & Swing Entries H1 entry is close to getting activated for intraday.
If you want a swing trade then wait for H4 entry (you might be waiting a while obviously)
Reason for entries - We have broken out of Balance since July 25th and currently in a trend phase until we establish a new value area, or return to the one we broke out from.
So since Trend and Momentum is UP, then we should find Low Volume Areas to enter in the direction of the trend for a classic pullback entry trade.
07/30/25 Trade Journal, and ES_F Stock Market analysis EOD accountability report: +960
Sleep: 5 hours
Overall health: still struggling with sleep due to heat waves
VX Algo System Signals from (9:30am to 2pm)
— 8:30 AM Market Structure flipped bearish on VX Algo X3!✅
— 9:45 AM Market Structure flipped bullish on VX Algo X3! ✅
— 10:30 AM Market Structure flipped bullish on VX Algo X3!❌
— 11:30 AM Market Structure flipped bearish on VX Algo X3!❌
— 12:00 PM VXAlgo NQ X1DD Buy Signal, ✅
— 12:30 PM Market Structure flipped bullish on VX Algo X3!✅
What’s are some news or takeaway from today? and What major news or event impacted the market today?
I have started to noticed that the last 3 days, we have been getting false triggers on market structure signals and it almost feels MM are trying to do it to break people's algo that trade on that.
This is a good reminder that no matter how successful the signal has been for the last 30 days, you still need to have risk management. additionally, it's also a good way to test people's faith and trick new traders in going back to doing random things because it makes them think market can behave randomly and nothing works.
this is why i always tell people to religiously test out a system for 30 days before giving up.
News
*FEDERAL RESERVE SKIPS RATE CUT, KEEPS FED FUNDS RATE AT 4.50%
What are the critical support levels to watch?
--> Above 6410= Bullish, Under 6400= Bearish

XAUUSD Long@3275 TP@3350 SL@3243XAUUSD
Long@3275
TP@3350
SL@3243
It is better to long XAUUSD@3275 as the price hold above the dow theory of daily and weekly timeframe. Good risk/reward ratio. Target for 3350.

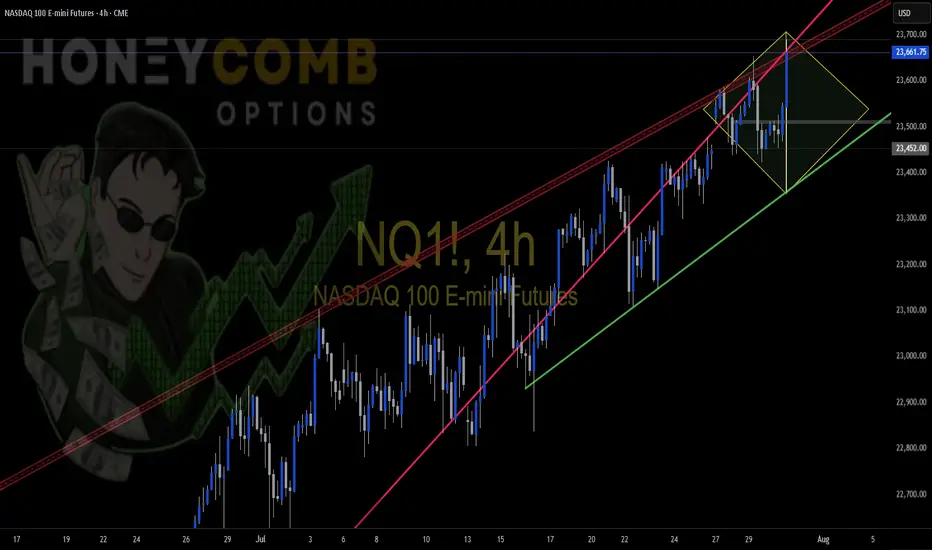
NQ Possible Diamond Top FormationPossible Diamond Top formation. This is a long play, and it may not be completed. I just wanted to show everyone what I see. Trade Safe
Copper: Trump Signs Tariffs on Imports Amid National Security...President Donald Trump signed a proclamation on Wednesday that imposes tariffs on copper imports, citing concerns over national security.
The White House announced that the new policy will introduce a 50% tariff on semi-finished copper products and other copper-derived goods that are highly dependent on the metal.
These tariffs are scheduled to come into effect on August 1, as outlined in a White House fact sheet.
In terms of market dynamics, copper is currently within a monthly demand zone, with a daily demand area also identified for setting pending orders. The potential impact on prices could be twofold: a possible upward movement driven by the discount effect on the metal, or continued decline following President Trump's announcement.
What are your thoughts on how these tariffs might influence copper prices moving forward?
✅ Please share your thoughts about HG1! in the comments section below and HIT LIKE if you appreciate my analysis. Don't forget to FOLLOW ME; you will help us a lot with this small contribution.

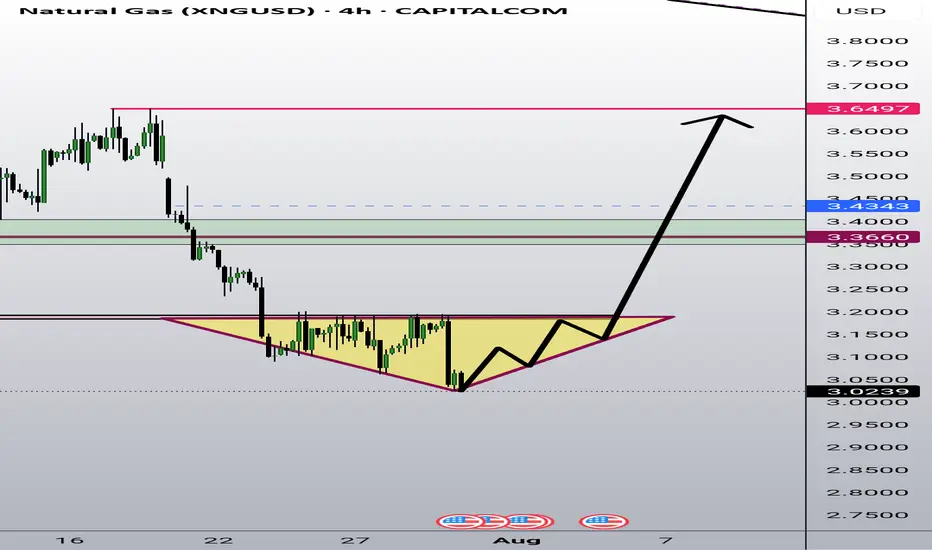
Bullish Diamond pattern (Reversal) is forming in Natural GasNatural Gas is show Classical bullish Diamond pattern character supported by oversold Rsi & triple bottom in weekly
Any good positive data will trigger sharp reversal in Natural Gas
Reversal will be brutual
Seller be cautious trail your stoploss
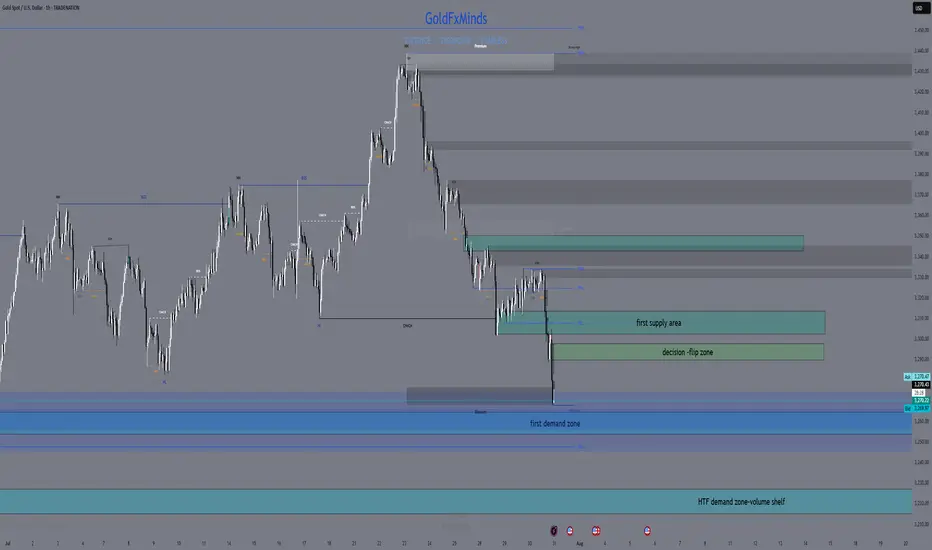
XAUUSD Market Update – July 30 Late NY Recap🔸Macro Context
Markets are still digesting Powell’s ongoing speech with no clear pivot signals. While FOMC tone remained cautious, no dovish surprise emerged. Trump’s upcoming comments keep geopolitical risks elevated. USD remains firm. Gold is reacting within key HTF demand as intraday volatility cools off.
🔸Bias Overview
Weekly Bias:
• Bearish rejection from the major supply wick 3439–3350
• Structure still below 3345, maintaining downside pressure
• Weekly RSI cooling off — no bullish divergence yet
Daily Bias:
• Lower high locked below 3345
• Price reentered the imbalance toward 3272
• Clean structure remains bearish unless we reclaim 3302
H4 Bias:
• Lower high formed at 3314
• Current price testing HTF Extreme Demand Base (3289–3272)
• Still bearish unless we see a confirmed M15 or H1 BOS from demand
🔸Key Structural Zones
🔺Above Price (3272):
• 3289–3294
Decision Block – M30 OB + FVG. First sign of momentum shift if reclaimed.
• 3302–3314
Supply Reversal – H1 OB + previous BOS zone. EMA alignment adds pressure.
• 3345–3350
Major Rejection Zone – H4 origin of last leg down. Strong resistance area.
🔻Below Price (3272):
• 3254–3264
Imbalance + OB – H4 FVG + clean demand zone. Buy setup only on deep flush + reversal PA.
• 3227–3214
HTF Demand Base – Daily OB + historical volume shelf. Final structural floor before deeper downside opens.
🔸Battle Plan
▶ Scenario 1 – Bearish Breakout
If 3272 fails with momentum and no reversal signs, expect continuation into 3254–3264.
No long trades unless BOS confirms.
▶ Scenario 2 – Reactive Long from Demand
If price gives a strong reaction from 3272 with BOS on M15 or H1 and clears 3294, then a recovery into 3302 is possible. Only valid with confirmed PA + EMA shift.
▶ Scenario 3 – Choppy Rejection from 3294
If price tests 3294 but fails, watch for rejections back toward 3272. Scalpers can fade reactions if no bullish structure forms.
🔸Final Thoughts
Price is once again testing our Extreme Demand Base from July 28 (3289–3272). The zone remains valid — but execution depends entirely on confirmation. Bears still in control unless we reclaim 3302 cleanly.
No need to rush. Best RR setups are found at clean structural edges.
Patience = profits.
—💬 Drop your thoughts in the comments.
❤️ Like if you appreciate the precision.
🔔 Follow GoldFxMinds for more sniper-level updates.
With you all the way,
— GoldFxMinds
📊 Analysis based on Trade Nation TradingView charts.
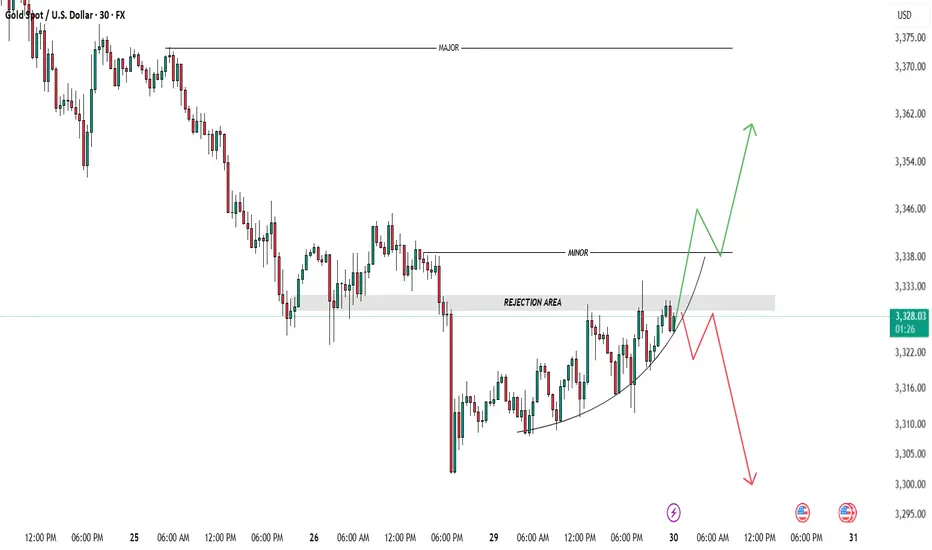
GOLD -Key Levels-Wait for Confirmation!Gold (XAUUSD) is now testing a critical Rejection Area 📍 (around 3,328–3,333), right beneath a minor CHOCH zone. This is a key decision level, and I'm just waiting for price to show its intrest – no early entries here. ⚠️
🔼 Bullish Scenario:
Price fails to hold above minor CHOCH ✅
Comes back to retest the Rejection Area as support 🧱
If we get a clean bounce + confirmation, I’ll look for buys toward 3,346 → 3,360 🎯
🔽 Bearish Scenario:
Price rejects from minor CHOCH ❌
Gives strong bearish confirmation 🔻
Then retests the Rejection Area as resistance 🚫
That’s my cue to short toward 3,310 → 3,295 📉
NOTE: possibility is that market take all liquidity from sell side. Avoid Taking any trade untill setup is clean.
Being patient here. Confirmation is everything! Let’s see🔍💡
Avoid Mid-Zone Entries!
Gold - The diligent top formation!🏆Gold ( TVC:GOLD ) finished the bullrun:
🔎Analysis summary:
For the past 10 years, Gold has been trading in a very strong expected bullrun. Just like we witnessed it in 2011, a 10 year bullrun is followed by a shorter term bearmarket. Gold is starting to lose its strength, which is a clear sign of weakness and the beginning of a bearish reversal.
📝Levels to watch:
$2.800
SwingTraderPhil
SwingTrading.Simplified. | Investing.Simplified. | #LONGTERMVISION

XAU / USD 4 Hour ChartHello traders. Here is a lower time frame analysis pertaining to the weekly that I recently posted. Area to watch is marked. It is the end of the month, things get tricky. Trade carefully. Be well and trade the trend. Shout out to Big G. Happy Wednesday.

NQ: 227th trading session - recapNot a good session today - I was so distracted + the price action was just awful. Stuff happens ig
Our previous analysis has been triggered.As we mentioned, the trigger has been activated, and the drop will likely continue down to 3,236.00.
ID: 2025 - 0146.16.2025
Trade #14 of 2025 executed.
Trade entry at 60 DTE (days to expiration).
BULLISH options trade executed on Crude Oil. Once price level of $75.00 gets taken out, this trade will get adjusted to secure a risk-free trade. Targets will be 100% ROI based upon this being a balanced bullish butterfly construct.
Defined risk
Defined reward
Happy Trading!
-kevin

Gold Bullish trend h1 chart target Now full bullish
Gold buy from 3271
3267 sl 3259 target 3338 don't miss trade best of luck 🤞

GOLD for todayHello to all traders. 😎😎
I hope all your deals will hit their targets. 🎉🎉
Based on yesterday’s analysis (link in the caption), we can expect gold to make a small upward move towards the 3335–3345 zone to collect sell orders in that area, and then potentially drop with more strength.
As you can see on the chart, the previous bearish move was strong, while the recent bullish move from yesterday until now has been slow and weak.
🌟🌟 The main reason for expecting this drop is the break of a key trendline on the 4H timeframe.
I’ve marked the entry point and stop-loss in red, and the targets in blue on the chart.
📌 Don’t forget to apply proper risk management!
⚠ Important: If a 1H candle closes above 3350 without giving us a valid entry beforehand, this analysis will be considered invalid.
What Do You Think?
Which scenario do you think is more likely to happen? **Share your thoughts!** ⬇️
Don't forget that this is just an analysis to give you an idea and trade with your own strategy. And don't forget the stop loss🛑🛑🛑
❤️❤️❤️The only friend you have in financial markets is your stop loss❤️❤️❤️
Please support me with your ✅' like'✅ and comments to motivate me to share more analysis with you and share your opinion about the possible trend of this chart with me 🙏😊
Be Happy , Ali Jamali

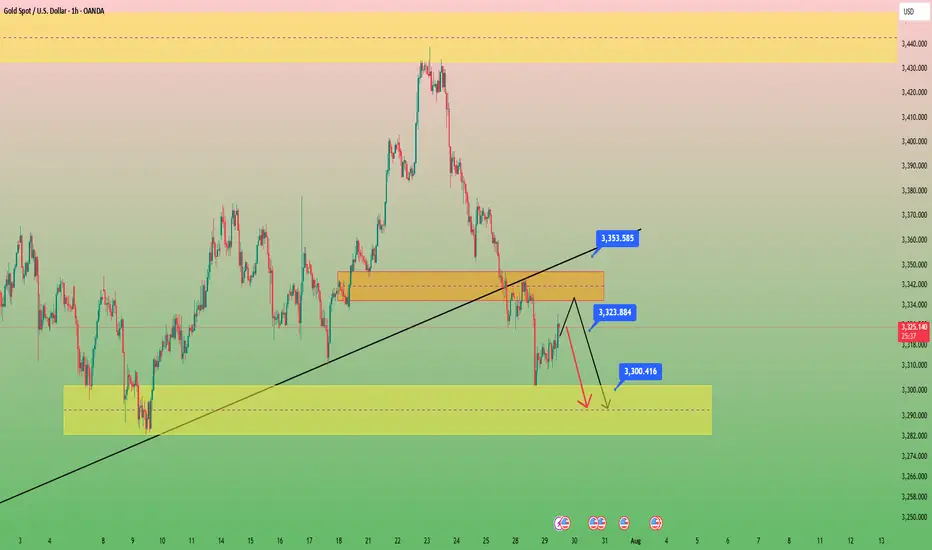
GOLD for short timeCaption important🛑🛑🛑
Hello to all traders. 😎😎
I hope all your deals will hit their targets. 🎉🎉
Gold has broken a key trendline on the 4H chart, and I believe the bearish move could continue today, potentially down to at least $3300.
My expectation is that price will first reach the $3335–$3340 zone. From there, you can look for a good short opportunity, with a suggested stop-loss at $3355.
If you’re willing to take on more risk, you could consider opening a short position from the current level around $3325, using a reasonable position size.
Personally, I prefer to wait for price to reach the orange zone ($3335) and enter a solid short position from there.
What Do You Think?
Which scenario do you think is more likely to happen? **Share your thoughts!** ⬇️
Don't forget that this is just an analysis to give you an idea and trade with your own strategy. And don't forget the stop loss🛑🛑🛑
❤️❤️❤️The only friend you have in financial markets is your stop loss❤️❤️❤️
Please support me with your ✅' like'✅ and comments to motivate me to share more analysis with you and share your opinion about the possible trend of this chart with me 🙏😊
Be Happy , Ali Jamali
XAU / USD Weekly ChartHello traders. News was good for the US dollar this morning. Powell did nothing, as expected, and gold is testing the lower boundries of the weekly candle body from last week. So now the question is, do we push down more, or does gold move up to take out all the leveraged shorts that are in profit? I marked the area to watch. Buys and sells with break and close out of the zone. Let's see how the daily and 4 hour candles play out. Shout out to Big G. Be well and trade the trend.

Sugar Long Trade PEPPERSTONE:SUGAR Long Trade, with my back testing of this strategy, it hits multiple possible take profits, manage your position accordingly.
Note: Manage your risk yourself, its risky trade, see how much your can risk yourself on this trade.
Use proper risk management
Looks like good trade.
Lets monitor.
Use proper risk management.
Disclaimer: only idea, not advice
