Gold Outlook- My BiasAlways know I do not own the market, I only predict what i think ,May happen and I may be wrong, but I have followed my set of rules.
Futures market

Be cautious with the numerous news and short sell on rebound#XAUUSD
The market is fluctuating sideways, and whether it can achieve a V-shaped reversal still needs to wait for information such as ADP and the Federal Reserve's decision.🗞 Invest lightly today and avoid letting emotions dictate your thinking.⚖️
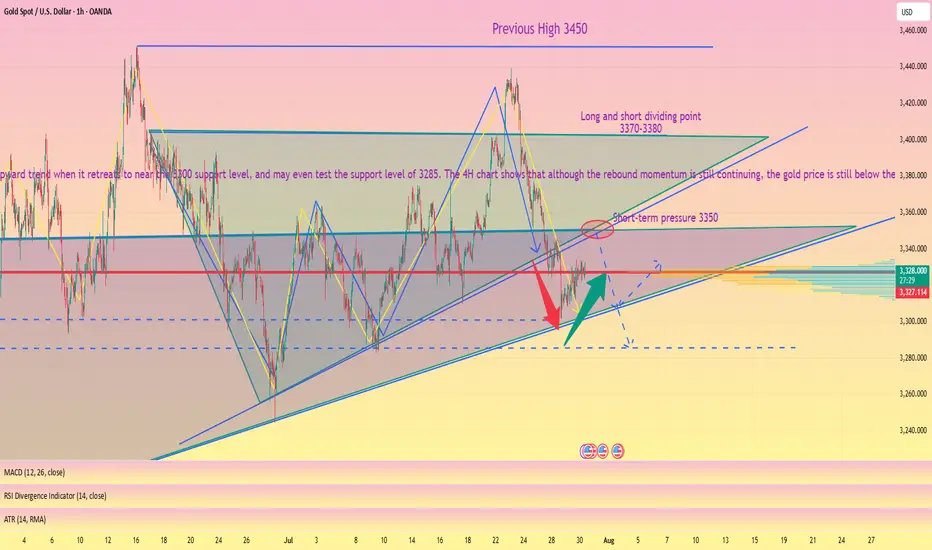
⚠️Although the market currently predicts that the news information is bullish for gold, and most of the trading voices are centered around bulls, we still need to be wary of the resistance area above 3345-3350.
📉Judging from the daily chart, I have clearly stated in the figure before that the current trend is a converging triangle. If the price hits the triangle boundary, coupled with the interference of external news, it may trigger panic selling, killing a wave of long buyers first🐂, and then trigger an upward trend when it retreats to near the 3300 support level, and may even test the support level of 3285. 🩳
The 4H chart shows that although the rebound momentum is still continuing📈, the gold price is still below the short-term moving average and has only recovered the lower support level. It is necessary to wait for a second retracement confirmation to determine whether a true trend reversal has been achieved. 📈
In addition, the price on the hourly chart continues to run in a downward channel. Combined with the previous trend pattern, after the rebound correction at the 4H level is completed, it is highly likely that the downward trend will continue to return to the lower support level of the daily level.🐻
If resistance is encountered at 3345-3350 for the first time today, consider shorting.💡
If the price currently retreats to around 3320-3315, consider a short-term long position. Long positions held yesterday can be manually closed at around 3330.💡
🚀 SELL 3340-3350
🚀 TP 3330-3320-3300
🚀 BUY 3320-3315
🚀 TP 3330-3340
GOLD: Multi-Timeframe Analysis Ahead of FOMCGOLD: Multi-Timeframe Analysis Ahead of FOMC
Gold prices may experience a short-term surge leading up to the FOMC announcement.
But what comes next?
Let’s break down the analysis, step by step.
For deeper insights, watch the full breakdown in the video.
Thank you!


Bearish Gold Outlook — Potential Flash Crash Imminent🔻 Technical Structure – Bearish Breakdown Brewing
Lower highs and lower lows forming on the daily and 4H timeframes — classic downtrend mechanics.
Price has rejected multiple times near $3,400–3,430, forming a strong resistance ceiling.
Support at $3,280–3,300 has been tested too many times— and each bounce is weaker. When support holds with less conviction, it's often about to break.
Volume spikes on red candles show smart money is exiting on down moves — signs of institutional distribution.
The **tightening consolidation range** looks like a **descending triangle** — usually resolves downward.
If $3,280 breaks, expect a **liquidity event**. Stops get swept, leading to a **sudden acceleration — possibly a flash crash** to $3,200 or lower.
🌍 **Fundamental Drivers – Macro Picture Is Turning Hostile for Gold**
1. Real Yields Are Climbing
U.S. real yields are up as inflation fades and the Fed stays hawkish.
Gold, being yieldless, suffers when investors can get positive returns from bonds.
2.The Dollar Is Gaining Strength
DXY is pushing higher, fueled by strong U.S. data and weak peers (euro, yen).
Gold priced in USD becomes more expensive globally — this suppresses demand.
3. **Rate Cuts Are Off the Table — or Delayed**
Market is pricing fewer and later rate cuts from the Fed.
This removes one of gold’s biggest bullish catalysts from earlier in the year.
4. Geopolitical Fear Is Cooling
No major escalation in Ukraine, Middle East, or Taiwan.
Without fear, gold loses its safe-haven premium.
5. Central Bank Buying May Have Peaked
Recent data from WGC shows some slowing in central bank accumulation.
If this institutional bid softens, gold could drop hard — few natural buyers remain above $3,300.
⚠️Conclusion: Gold Is Walking a Tightrope
The chart is a staircase down.
Macro fundamentals are no longer supportive.
A clean breakdown below $3,280 could trigger a **chain reaction** of automated selling and margin calls — **a flash crash is on the table**.
This isn’t just a correction — this feels like the calm before the storm.

31/7/25 Still Sideways to Down Pullback Phase
Wednesday’s candlestick (Jul 30) was a small bull bar with a prominent tail above.
In our last report, we said traders would see if the bulls could create a retest of the July 24 high and a breakout above, or if the market would trade slightly higher but stall around or below the July 24 high, forming bear bars instead.
The market traded slightly higher for the day.
The bulls want a retest of the April high.
They want any pullback to lack follow-through selling, similar to the last few pullbacks (July 7, July 11, July 15, and July 22).
They want the pullback to be shallow (overlapping candlesticks, bull bars and long tails below candlesticks). They want the 20-day EMA to act as a support level. So far, this appears to be the case.
If the market trades lower, they want it to form a double bottom bull flag with the July 29 low.
They want another strong leg up to form the wedge pattern, with the first two legs being Jun 20 and July 24.
The bears want a reversal from a large wedge pattern (May 15, Jun 20, and Jul 24) and an embedded wedge (Jul 14, Jul 18, and Jul 24). They want a major lower high vs the April high.
Previously, the bears were unable to create follow-through selling in the last four selloff attempts (July 7, July 11, July 15, and July 22). They were also unable to create follow-through selling on July 29.
They see Tuesday (July 30) as a pullback and want at least a small second leg sideways to down, retesting the July 29 low.
They need to create consecutive bear bars closing near their lows and trading below the 20-day EMA to show they are back in control.
If the market trades higher, they want it to stall around the July 24 high area, forming a double top.
Production for July is expected to be around the same level as June or slightly higher. August may be flat or down.
Refineries' appetite to buy looks decent recently.
Export: Perhaps down -8% for the month.
So far, the buying pressure is slightly stronger than the selling pressure, but not in an overwhelming way yet (no strong consecutive bull bars closing near their highs).
However, the move up has lasted a considerable amount of time. The market may have to form a pullback before it moves higher again. The pullback phase is still underway.
Traders will assess the strength of the pullback to determine whether it will be a minor correction or a more significant event. So far, the pullback appears to be minor.
The bears need to create follow-through selling to show they are back in control, something they couldn't do in the last few pullbacks (July 7, July 11, July 15, Jul 22, and Jul 29).
For tomorrow (Thursday, July 31), traders will see if the bears can create a strong retest of the July 29 low.
Or will the market trade slightly lower, but find support around the 20-day EMA, closing the day with a long tail below or a bull body instead?
Andrew

Gold long from 3242LOOKING FOR LONGS AT AROUND THAT REGION.
gold looks good .
Lets wait for this to unfold.

Gold next move (Read Description). Hello, Traders.
As we achieved more than 400 pips on last trade, Now I’m back with new idea for next move.
As you can see the gold is dropping since last few days.
Now the trend is bearish according Higher Time Frames and Bullish trend in Lower Time Frames, We will have to follow the Higher Time Frames to find the next move.
The market is creating the trend line buy according to H1,M30 and also respecting the trend line.
Keep in mind the trend is bearish, the gold will drop.
If the price doesn't breaks the 3347, then next move will be around 3284. If the price breaks the 3347 then gold will fly, trend will be change.
Kindly share your ideas and drop positive comments, Thanks.

GC1! – The Wedge Strikes BackGC1! – The Wedge Strikes Back 🚀
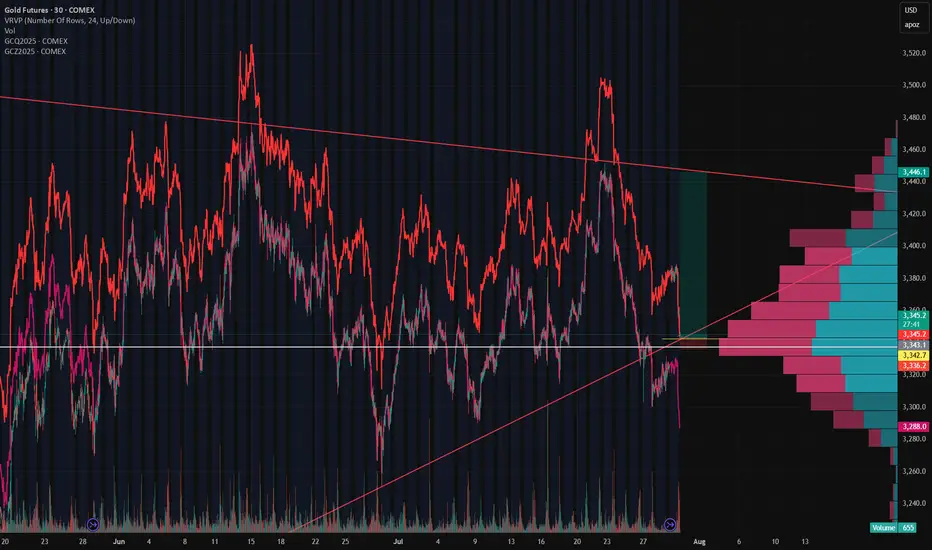
Gold futures (GC1!) just gave us a textbook rollover move. As the front-month rolled, price faked a wedge breakdown, only to rip back inside the structure once rollover completed. That failed breakout speaks volumes – and now the wedge is back in control.
Rollover Trap → Back Inside the Wedge
Rollover volatility flushed price below the wedge, pulling in shorts… but the move didn’t stick. Buyers stepped up and snapped price back inside, turning the wedge’s lower boundary into rock-solid support once again.
The Long Game 🎯
With GC1! holding the wedge:
Longs off wedge support are the play
Resistance: 3,380
Target: 3,446 (upper wedge boundary)
Stop-loss: 3,336 (below support)
Risk/Reward: 🔥 10.69 RRR
Volume Profile also shows heavy accumulation in the 3,336–3,380 zone – crack through 3,380, and we could see momentum accelerate quickly.
Bottom Line
This isn’t just another bounce – it’s a failed breakdown on rollover. Wedge traders are back in the driver’s seat, and the setup offers a crystal-clear invalidation point with serious upside potential.
Interest rates unchanged, sticking to my bearish idea.Look at my other posts and you''ll understand as to why, I was telling everyone to sell. There was a small sellers trap, we pushed up, at that moment I already had closed my positions. Now we go down to the other key levels. I'm done till the end of August. Will still post my setups, but won't take any trades. Stay safe and keep your funds safe. Hella Love!

Gold Alert: Key Levels for Potential Sell Setup!Good morning, my friends 🌞
Here’s today’s gold analysis. I'm expecting a decline in gold prices, specifically from the 3,383–3,420 level.
Once a correction starts around that zone, my target will be 3,310. Gold has been riding a strong uptrend, and if we reach those levels, I’ll be expecting a pullback and opening a sell position accordingly.
Please set your stop loss based on your personal margin preferences.
Your likes and support are my biggest motivation for continuing to share these analyses. Thank you to everyone showing appreciation 🙏

BUY XAUUSD ....GOLDBUY XAUUSD price gas reached a potential strong bullish orderblock and a well structured demand zone
use proper risk management

SILVER H9 IdeaWhen you look at silver market has actually been in an uptrend for about three years. It was sideways a couple of times, and it’s very possible that we go sideways or correctionn for the short term. But over the longer term, it goes from the lower left to the upper right, and there’s really no way to dispute that.

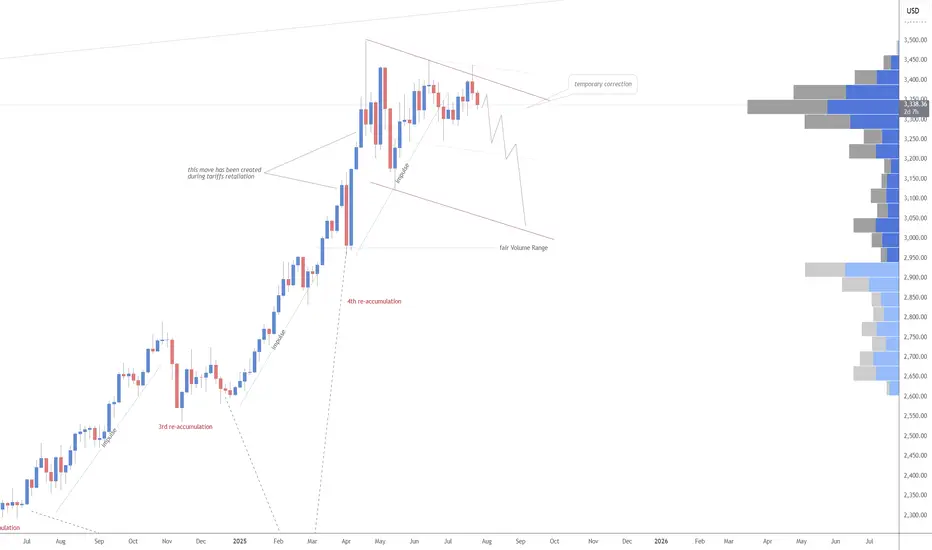
GOLD Weekly Idea💡Why Gold Pulled Back
- Gold pulled back today after hitting $3439.04, just below resistance at $3451.53. Traders took profits ahead of key Fed and trade headlines. Right now, it’s trading around $3414.48, down 0.50%.
- The dip came after the U.S.-Japan trade deal eased geopolitical tension, cutting safe-haven demand. Plus, U.S. bond yields are climbing (10-year at 4.384%), which adds pressure on gold.
Support is building at $3374.42, with stronger buying interest expected around $3347.97 and the 50-day moving average at $3336.40 — a key level bulls want to defend.
Short-term looks a bit weak, but as long as gold holds above the 50-day MA, the bullish trend remains intact. Longer-term, weakness in the dollar, central bank gold buying, and concerns about Fed independence could push prices higher.
🔍Watching the Fed’s July 29–30 meeting next
$copperlovely gift by trump i guess
50 ema holding for now
bid here and will look for a deviation below white line

Double bottom Double bottom on gold with RSI regular divergency on 5 , 15 and 1 hour chart. It seems like buyers are interested again on this level.
GOLD ROUTE MAP UPDATEHey Everyone,
Quick follow up on our 1H chart route map:
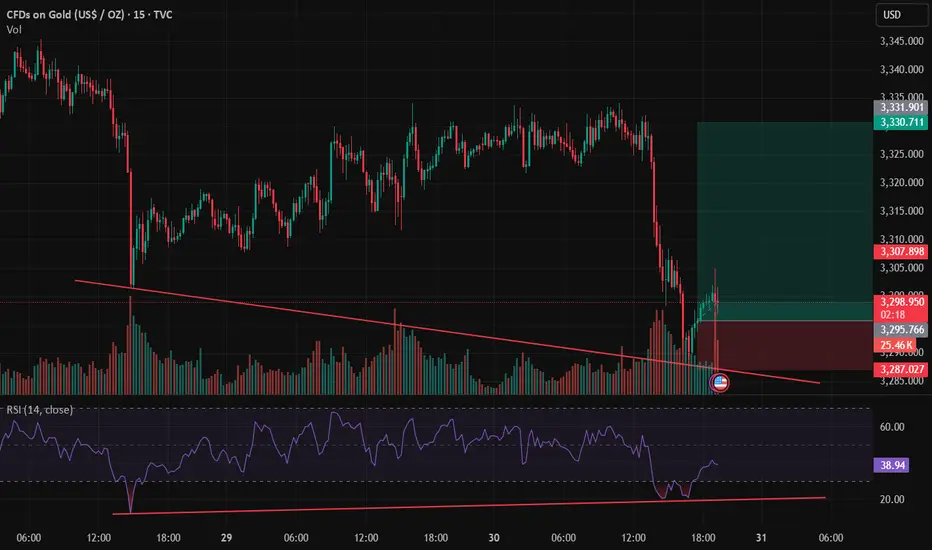
We had the break below 3305 Goldturn, opening and hitting the 1st level of the swing range at 3289, which did exactly what it says on the tin and gave us the perfect swing bounce into 3305.
We are now looking for support above the swing range and a break above 3305 to track the movement up or further retest and break below the 1st level of the swing range may open the the 2nd level at 3267. Ema5 cross and lock will confirm this.
From here, we’re watching for:
Support to hold above the swing range, followed by a clean break above 3305, which would suggest upward continuation.
Alternatively, if we retest and break below 3289, that opens the path toward the second level of the swing range at 3267.
We will keep the above in mind when taking buys from dips. Our updated levels and weighted levels will allow us to track the movement down and then catch bounces up.
We will continue to buy dips using our support levels taking 20 to 40 pips. As stated before each of our level structures give 20 to 40 pip bounces, which is enough for a nice entry and exit. If you back test the levels we shared every week for the past 24 months, you can see how effectively they were used to trade with or against short/mid term swings and trends.
The swing range give bigger bounces then our weighted levels that's the difference between weighted levels and swing ranges.
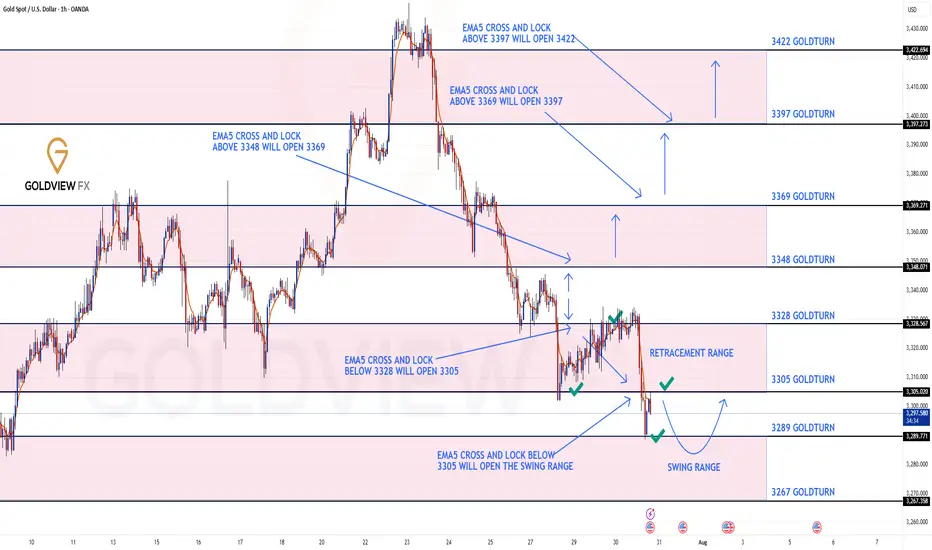
BULLISH TARGET
3348
EMA5 CROSS AND LOCK ABOVE 3348 WILL OPEN THE FOLLOWING BULLISH TARGETS
3369
EMA5 CROSS AND LOCK ABOVE 3369 WILL OPEN THE FOLLOWING BULLISH TARGET
3397
EMA5 CROSS AND LOCK ABOVE 3397 WILL OPEN THE FOLLOWING BULLISH TARGET
3422
BEARISH TARGETS
3328 - DONE
EMA5 CROSS AND LOCK BELOW 3328 WILL OPEN THE FOLLOWING BEARISH TARGET
3305 - DONE
EMA5 CROSS AND LOCK BELOW 3305 WILL OPEN THE SWING RANGE
3289 - DONE
3267
As always, we will keep you all updated with regular updates throughout the week and how we manage the active ideas and setups. Thank you all for your likes, comments and follows, we really appreciate it!
Mr Gold
GoldViewFX

THE KOG REPORT - FOMCTHE KOG REPORT – FOMC
This is our view for FOMC, please do your own research and analysis to make an informed decision on the markets. It is not recommended you try to trade the event if you have less than 6 months trading experience and have a trusted risk strategy in place. The markets are extremely volatile, and these events can cause aggressive swings in price.
It’s been an aggressive month on the markets especially this week which has been testing for traders due to the extended movement on gold. We’ve managed to stay ahead of the game and although we missed the move downside, we’ve capture scalps up and down trading it on an intra-day basis rather than a swing.
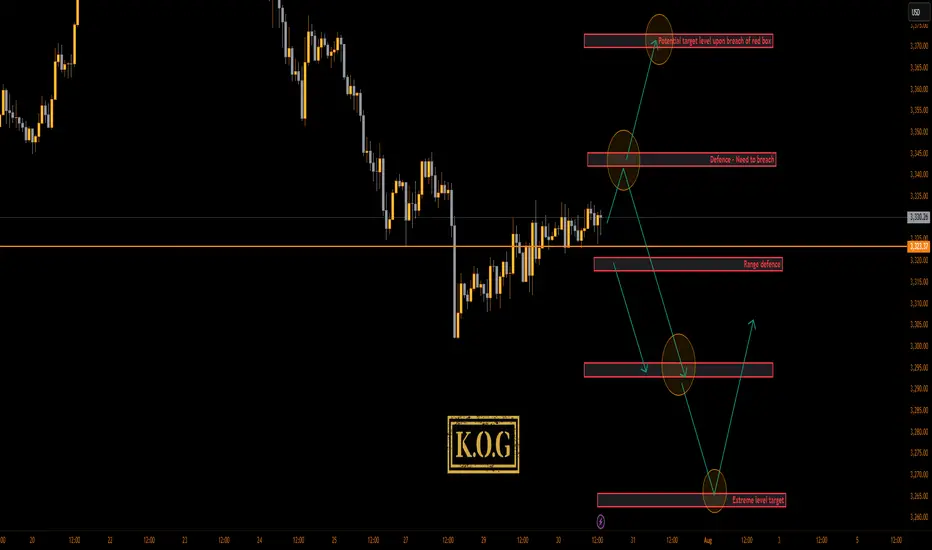
Looking at the 4H chart, we can see we have support forming at the 3310 level which is the key level for this week and will need to be broken to go lower. If we can flip the 3334 resistance, price should attempt higher into the 3355-60 region which is where we may settle in preparation for NFP. on Friday This is the level that needs to be watched for the daily close, as a close above will confirm the structure and pattern test which can form a reversal if not breached.
Now, here is the flip! We’re still sitting below the daily red box but we know this break does give a retracement and with sentiment long, it may not be a complete retracement again. Here 3345-50 is the red box to watch and as above, if not breached, we may see a rejection here which will confirm no reversal for higher and, potentially a further decline into the 3270-5 regions for the end of the month and quarter.
Pivot – 3323-6
RED BOX TARGETS:
Break above 3335 for 3338, 3340, 3345, 3347 and 3357 in extension of the move
Break below 3320 for 3310, 3306, 3302, 3297 and 3393 in extension of the move
Please do support us by hitting the like button, leaving a comment, and giving us a follow. We’ve been doing this for a long time now providing traders with in-depth free analysis on Gold, so your likes and comments are very much appreciated.
As always, trade safe.
KOG
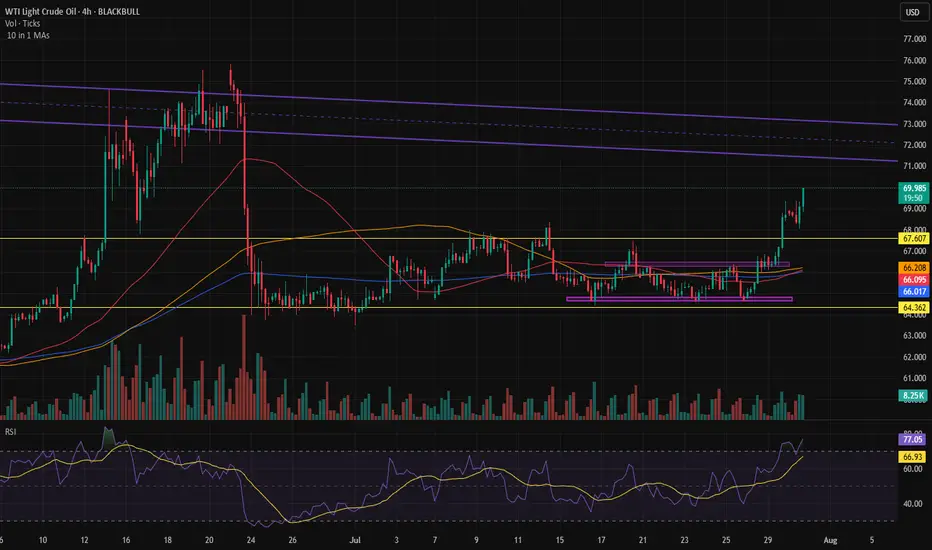
UKOIL Short UKOIL prices may decline from the $73.7 level within the Fair Value Gap (FVG) zone, targeting a lower FVG zone as the next potential objective.

Gold Price Rebound Towards 3325 Target After Support TestGold (30-min chart) shows a recovery from the support zone (3288–3298) with potential bullish movement. Key resistance levels are 3305 and 3316, with a target zone around 3325.510. Price is expected to follow a corrective structure before possibly reaching the target.

GOLD PLAN – LIQUIDITY HUNT BEFORE THE REAL MOVE? SCALPING PLAN – LIQUIDITY HUNT BEFORE THE REAL MOVE? 🔍
🔹 Timeframe: 30M
🔹 Bias: Intraday Bullish to Bearish Reversal
🔹 Posted by: Clinton Scalper | Smart Money Focus
🔹 Date: July 30, 2025
🔍 MACRO CONTEXT – WHY GOLD REMAINS HIGHLY REACTIVE
The macro backdrop continues to favor volatility in gold:
🟢 Dovish Fed tone ahead of FOMC
– Fed speakers hint at a pause or rate cut timeline.
– Inflation pressures are easing → lowers interest rate expectations.
📉 USD weakening + falling yields
– 10Y U.S. bonds retreating → dollar under pressure → gold gains ground.
🌐 Geopolitical risks remain elevated
– Tensions from Middle East and global recession risks continue to drive flows into safe-haven assets like gold.
🧭 Conclusion: Short-term upside still viable – but be cautious of liquidity traps and OB rejection.
📈 TECHNICAL + SMC INSIGHTS – THE CHART TELLS THE STORY
🔹 Structure Overview:
Market broke out of a descending channel and formed a bullish ascending wedge.
However, price is now approaching multiple OB SELL zones, aligning with smart money exhaustion levels.
🔹 Key Zones:
🔺 OB SELL Zones:
3,334 → 3,342
3,354 → 3,369 (Fibonacci 1.618 extension)
🔻 OB BUY Zones:
3,302 → 3,291 (confluence with previous liquidity sweep)
📍 Current Price: 3,330 – approaching first supply zone.
🔹 Smart Money Flow:
Liquidity above 3,334 has likely been targeted.
If price reaches 3,354–3,369 and shows exhaustion, expect distribution + reversal.
Key confirmation will be a break back below the ascending structure with momentum.
🎯 TRADE PLAN – TWO POSSIBLE SCALPING SCENARIOS
✅ SCENARIO 1: SHORT FROM PREMIUM OB SELL ZONE
Looking to fade bullish liquidity grab near top of range.
Entry: 3,354–3,369
SL: 3,375
TP1: 3,334
TP2: 3,302
TP3: 3,291
Ideal for reversal scalpers catching the distribution move.
✅ SCENARIO 2: LONG FROM DISCOUNT OB BUY ZONE
If price rejects OB SELL and dumps into unfilled demand.
Entry: 3,291–3,302
SL: 3,275
TP1: 3,322
TP2: 3,343
TP3: 3,354
Smart money often reloads after hunting liquidity beneath discount OBs.
⚠️ EXECUTION REMINDERS
✅ Wait for confirmation candles: engulfing / wick rejection / breaker structure
⛔ No market orders without OB reaction
📊 Risk max 1–1.5% per position
📉 Use volume to confirm absorption / exhaustion in OB zones
📢 FINAL THOUGHT – TRAPS COME FIRST, THEN MOVES
Smart Money doesn't chase price — it hunts stops first.
We’re watching closely to see if price completes its liquidity sweep at 3,354–3,369 before a potential reversal. Alternatively, we wait for price to return to the OB BUY zone around 3,291 for a high-RR long play.
🔥 If this helped you:
👍 Like this idea
💬 Comment your thoughts below
🔔 Follow Clinton Scalper for weekly institutional-grade setups

Is there any news in the Middle East?Rapid move in oil.
We need to see if something significant is about to happen in the Middle East — it usually is when we see moves like this.