GOLD – A Bottom in Place or Just the Calm Before the Storm?GOLD – A Bottom in Place or Just the Calm Before the Storm?
Gold has recently shed nearly $50, indicating sustained bearish pressure. But here’s the real question:
👉 Is this simply a liquidity sweep before a bullish reversal?
👉 Or are we witnessing the early stages of a broader bearish continuation?
Let’s break it all down – step by step – to map out smart, reaction-based trading opportunities.
🌍 Macro & Fundamental Overview
The US–EU trade and defence agreement has dampened gold’s role as a safe haven in the short term.
The US Dollar and equity markets remain strong, driven by solid macroeconomic data.
Overall market sentiment leans “risk-on”, pushing capital into riskier assets and away from precious metals.
📆 Upcoming Key Events:
Tuesday: ADP Employment Data
Friday: FOMC Statement & Nonfarm Payrolls (NFP)
These events could drastically shift market expectations around Fed policy, impacting gold’s direction.
📊 Technical Picture (Timeframes H1–H4)
Gold has rebounded from recent lows and is currently moving within a parallel bullish channel.
However, price is now nearing a critical resistance level at 3342 – a potential turning point.
🔎 Key Technical Zones:
🔺 Short-Term Resistance: 3342
🔺 Major Supply Zone: 3369–3388 (Order Block + Fair Value Gap + Fib 0.5–0.618)
🔻 High-Liquidity Support Zone: 3293–3290
🔻 Key Demand Zone (FVG): 3275–3273
🔺 High-Level Resistance: 3416
🧭 Trading Plan – Based on Price Action (Not Prediction)
We don’t guess the market. We wait, watch, and react based on price confirmation.
✅ Scenario 1 – Buy the Dip (Scalp Setup)
Entry: 3293 – 3291
Stop Loss: 3286
Targets: 3296 → 3300 → 3304 → 3308 → 3312 → 3315 → 3320 → 3330
🟢 Ideal for intraday scalps within high-liquidity zones.
✅ Scenario 2 – Buy from Deep Demand (Swing Setup)
Entry: 3275 – 3273
Stop Loss: 3269
Targets: 3280 → 3284 → 3288 → 3292 → 3300 → 3305 → 3310 → 3320 → 3330
🟢 Great opportunity if price absorbs selling pressure at the FVG zone and reverses.
❌ Scenario 3 – Short from Key Resistance (3342)
Entry: 3340 – 3342
Stop Loss: 3346
Targets: 3335 → 3330 → 3325 → 3320 → 3310
🔴 Use if price fails to break and hold above 3342.
❌ Scenario 4 – Short from Major Supply Zone (Swing)
Entry: 3369 – 3372
Stop Loss: 3376
Targets: 3365 → 3360 → 3355 → 3350 → 3345 → 3340 → 3330 → 3320
🔴 Higher-risk setup; enter only on strong rejection or bearish candlestick confirmation.
⚠️ Risk Management Guidelines
Avoid entries during the London and NY open – fakeouts and stop hunts are common.
Always wait for clear price reaction within zones – avoid impulsive entries.
Respect your stop-loss levels, especially with this week’s major data releases.
🎯 Final Thoughts for UK & Global Traders
Let the market come to you – never chase price.
Stay disciplined, especially in volatile weeks like this one.
The best trades are reactionary, not predictive.
💬 Found this plan useful?
Feel free to comment your views or follow for more structured gold analyses throughout the week.
Futures market

XAUUSD: Buy ideaOn XAUUSD we have a very nice buy candle. Indeed, this candle reassures us of a high probability of an upward trend....

retest and strong selling zonemarket na bearish pennant pattren banaya tha or thank you god proper pura levels ko repect dee hay market na ... or ab support form ker kay retest kern jara hay apna level ko agaar in area per market mila tau hum sell ki opportunity dekh sakta hay with strong risk management kay saath now Let see kya kerti hay market

Gold is in the Bearish Direction after Breaking SupportHello Traders
In This Chart GOLD HOURLY Forex Forecast By FOREX PLANET
today Gold analysis 👆
🟢This Chart includes_ (GOLD market update)
🟢What is The Next Opportunity on GOLD Market
🟢how to Enter to the Valid Entry With Assurance Profit
This CHART is For Trader's that Want to Improve Their Technical Analysis Skills and Their Trading By Understanding How To Analyze The Market Using Multiple Timeframes and Understanding The Bigger Picture on the Charts

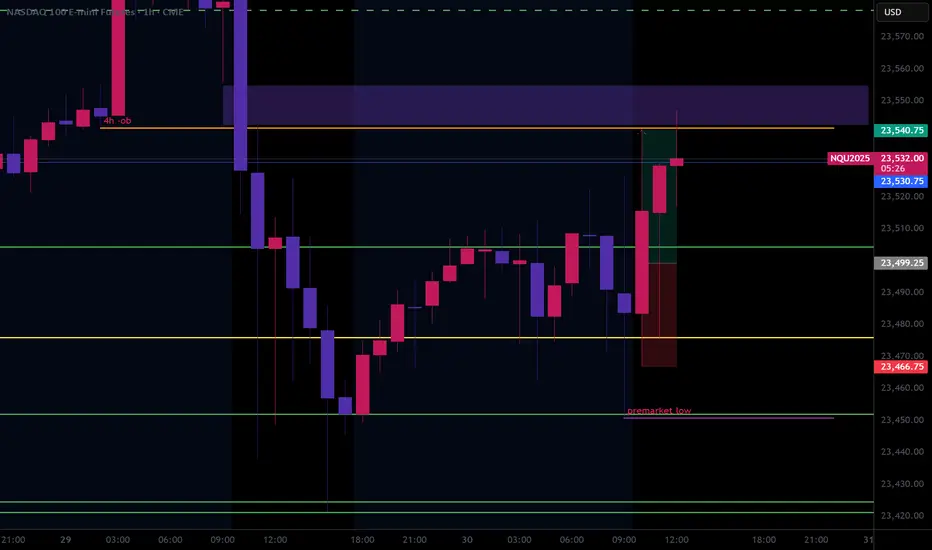
NASDAQ Long 7.30.25Price had hit a weekly +ob on 7.29.25, and the current day (7.30.25) had not taken the previous day high or low, but looked like it wanted to distribute into the pd wick equilibrium premium level. After 10 AM closed as a bullish candle, signifying higher price, I entered iat 11 AM on the 10 AM candle equilibrium. Price hit the 75% BE and Final TP with 1.28 RR.
Today's Gold Price: (3280-3290) Be Cautious About Bottom-fishingToday's Gold Price: (3280-3290) Be Cautious About Bottom-fishing
Today's gold price volatility was another lethargic day.
It oscillated back and forth between 3300 and 3330.
Like a loom, it was a lethargic experience.
In fact:
This market trend is typical of gold's volatility.
It suggests that significant news will be released today.
Buyers are reluctant to buy in large quantities.
Shorts are reluctant to sell in large quantities.
Everyone is waiting and watching.
Once news and market sentiment emerge, we will choose a new direction.
As shown on the 4-hour chart,
the area around 3330 has become a strong resistance zone.
The area around 3300 has become a temporary resistance zone.
The area around 3280 has become a strong support zone.
However, it is worth noting that when this ascending triangle descends, trading volume increases, indicating active selling.
Gold prices are rising, but trading volume is shrinking.
This clearly shows that the funds driving gold prices are not currently active enough.
This suggests that the current bullish momentum has yet to fully develop.
Bulls remain weak and wary of bears.
As a result, everyone awaits today's release of a small amount of non-farm payroll data and the Federal Reserve's interest rate decision.
I expect the Fed to adopt a more dovish stance this time, meaning that while they won't cut rates immediately, they will hint at a rate cut later this year.
Gold prices are likely to continue to fluctuate widely.
Trading Strategy:
Support: $3,280/$3,290
Resistance: $3,330/$3,300
Aggressive Strategy:
Sell Price: $3,295-$3,300
Stop Loss: $3,305
Target Price: $3,280-$3,280
Conservative Strategy:
Sell Price: $3,320-$3,330
Stop Loss: $3,335
Target Price: $3,300-$3,280
Bottom Picking Strategy: (Cautious)
Buy Price: $3,280-$3,290
Stop Loss: $3,275
Target Price: $3,330/$3,350

XAUUSD: Buy idea On XAUUSD we would have a high probability of having an uptrend depending on the configuration of the chart.

Gold May Dip Mildly Before US Data📊 Market Overview:
Spot gold is trading around $3,329/oz, up ~0.1%, supported by falling U.S. Treasury yields and a slightly weaker dollar, while investors await potential Fed dovish signals or rate cut in September . Meanwhile, easing U.S.–EU trade tensions weighed on safe-haven demand for gold.
📉 Technical Analysis:
• Key Resistance: ~$3,335–3,350 (recent highs and potential test zone)
• Nearest Support: ~$3,310 (previous stable support)
• EMA09 position: Price is above EMA9, indicating a mild bullish bias in the short term
• Momentum/Volume: RSI ~53 (neutral), MACD & StochRSI showing small buy signals. However, bullish momentum is fading, suggesting a possible mild pullback
📌 Conclusion:
Gold may dip modestly toward $3,310 if the dollar strengthens or if Fed rate-cut expectations recede. A break above $3,335–3,350 could pave the way for further gains, though current momentum remains insufficient to confirm a breakout.
💡 Suggested Trade Strategy:
SELL XAU/USD: $3,333–3,336
🎯 Take Profit: 40/80/200 pips
❌ Stop Loss: $3339
BUY XAU/USD: $3,310–3,308
🎯 Take Profit: 40/80/200 pips
❌ Stop Loss: $3305

XAUUSD SELL OFF CONTINUATION All my trade entry criterias met with the backing of the ADP Non-Farm Employment Change news release being positive for the USD, a SELL trade on GOLD

GOLD Bearish Breakout!
HI,Traders !
#GOLD is trading in a strong
Downtrend and the pair
Broke the key horizontal
Level around 3318.97 which
Reinforces our bearish
Bias and we will be
Expecting a further
Bearish move down !
Comment and subscribe to help us grow !

We go up!Gold trapped all the buyers, flash crash like said yesterday, now we buy till 3400. Rates ain't getting cut, they already have gold at the price they want.

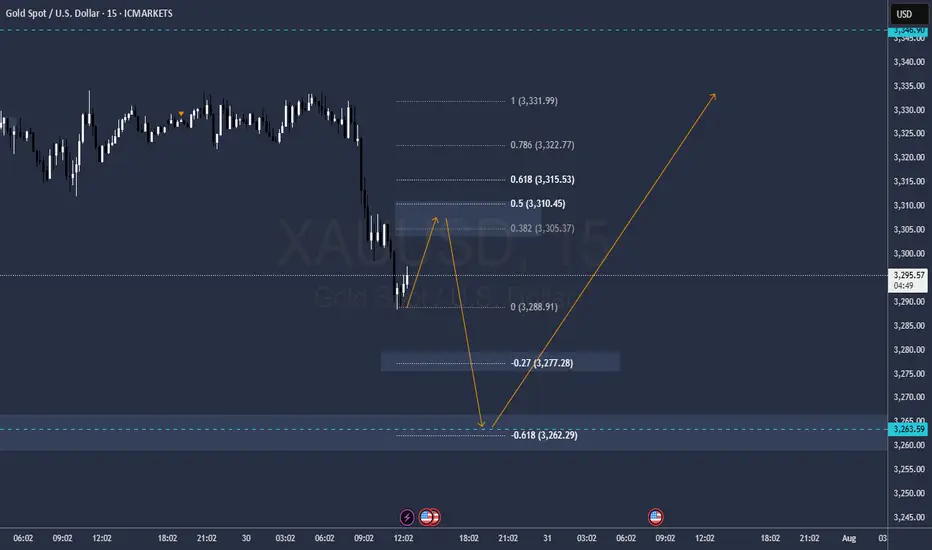
GOLD FOMC Ok it will be rising this previous FOMC 90 minutes but then will fall fasta and sharp
Sell levels 3305 / 3310 SL above .618
Targets 3277 3263
Reversal spectation on 3263 towars all time highs 3550 and 3650
WTI watch $70.34-70.43: Resistance zone that may STOP the surgeUSOIL spiked on Trump/Russia/Iran tariff threats.
Just hit a significant resistance at $70.34-70.43
Look for a Dip-to-Fib or Break-n-Retest for longs.

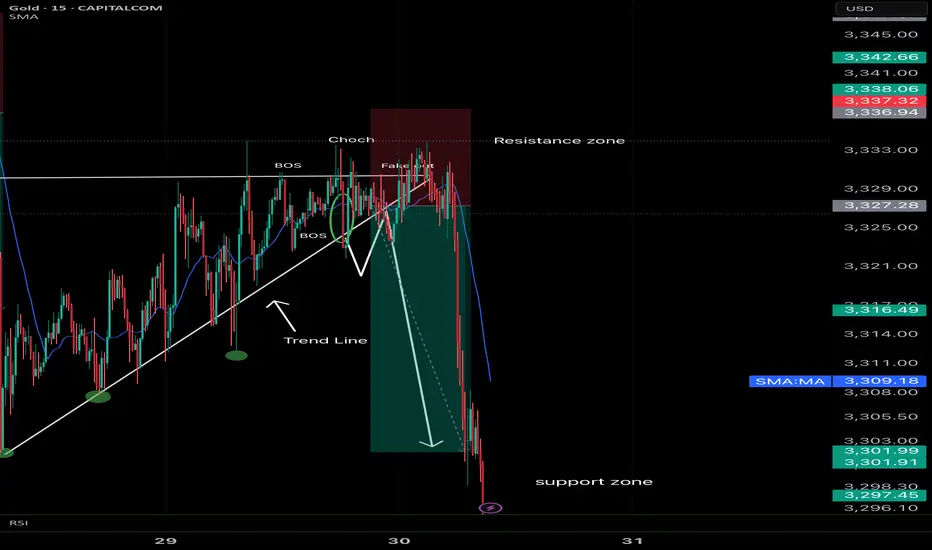
SMC 🔥 Awesome! This analysis was perfect.
• Plan Confirmation: The price fully respected the resistance zone, broke the trend line, and followed the bearish projection exactly.
• Liquidity and Fake Out: The market created the typical liquidity trap at the resistance level (fake breakout), as anticipated.
• TP: It went straight to the 3.301 target and even surpassed it, which shows that the reading of the institutional flow was accurate.
• Clean SMC: BOS, CHoCH, FVG mitigation, and impulsive movement toward the support zone → Smart Money textbook.
SI : Key levelsIt is possible to take a short from the blue level with an arrow. The other levels are still inactive. When it will be possible to take trades from them I will inform you. In the meantime, you can use them as part of your trading system.
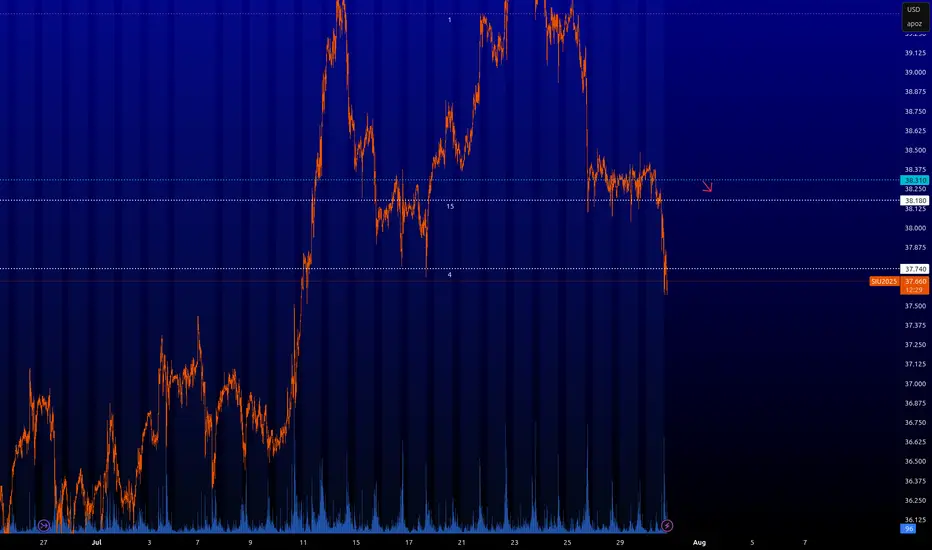
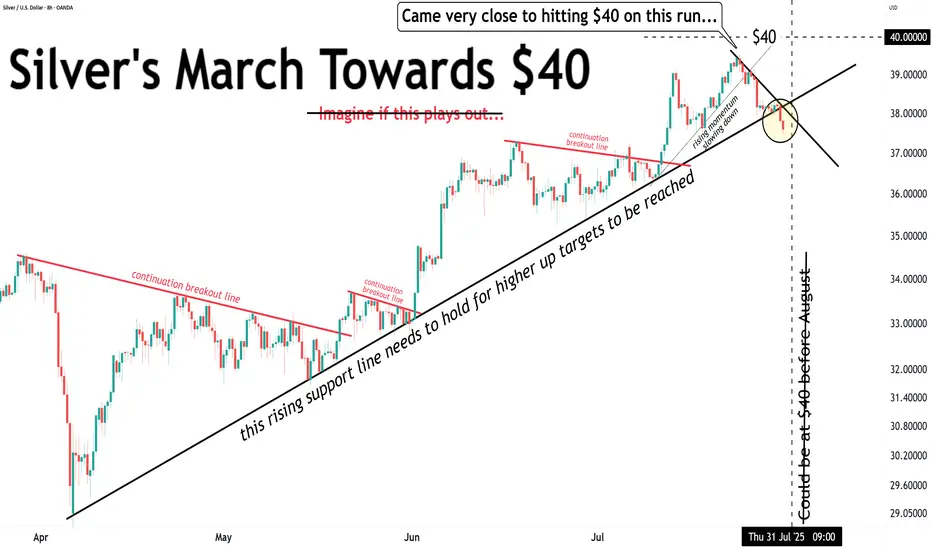
Silver came very close to $40… but lost steam.That’s it, folks.
Silver came very close to $40… but lost steam.
We’ve now closed below the rising support line.
Momentum has broken.
The correction deepens.
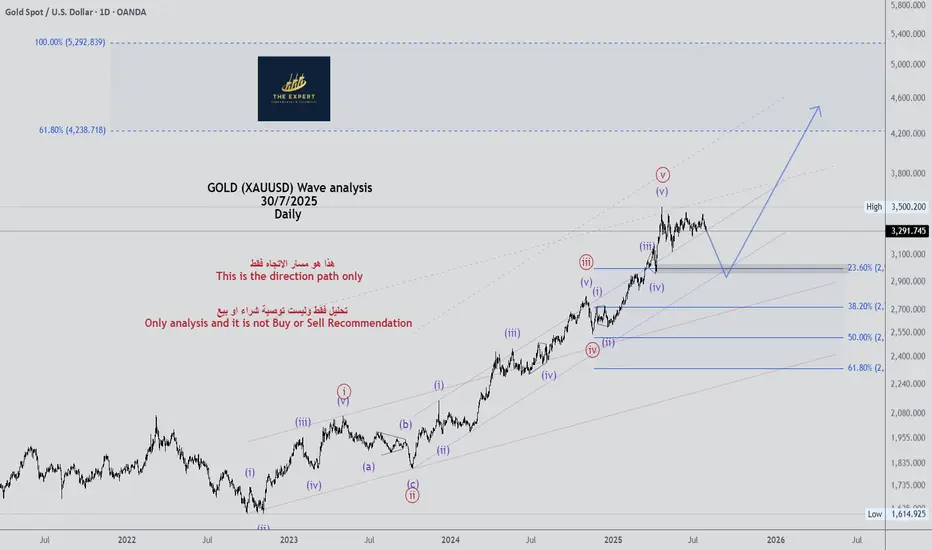
Gold analysis by majidbabaeiasl My predictions for gold in previous years have been quite accurate and calculated. Right now, I think a wave 4 correction, which is a micro-wave, is taking place.

GOLD (XAUUSD) Wave analysis Daily - 30/7/2025GOLD (XAUUSD) Wave analysis Daily - 30/7/2025
see the chart
Xauusd sell to buy ideaThere is going to be more sells all the way down to the support zone before a big buy to ALL TIME HIGH let's anticipate

GOLD (XAUUSD) Wave analysis Weekly - 30/7/2025 (Scenario 2)GOLD (XAUUSD) Wave analysis Weekly - 30/7/2025 (Scenario 2)

GOLD (XAUUSD) Wave analysis Weekly - 30/7/2025 (Scenario 1)GOLD (XAUUSD) Wave analysis Weekly - 30/7/2025 (Scenario 1)

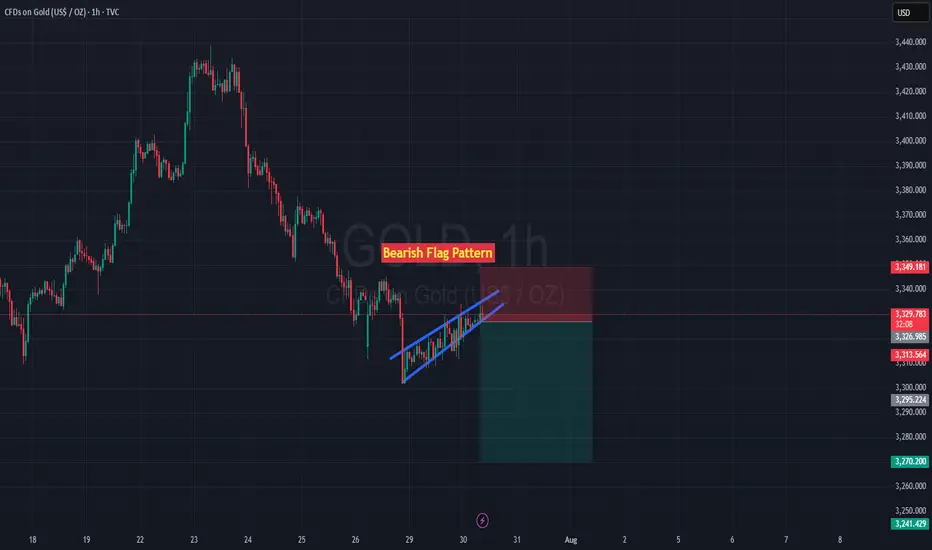
H1 Gold PatternH1 Gold TF, Bearish Flag Pattern
Trade what you see, not what you think, always use SL to protect your Equity.. GoodLuck
GOLD (XAUUSD) Wave analysis Monthly - 30/7/2025 (Scenario 2)GOLD (XAUUSD) Wave analysis Monthly - 30/7/2025 (Scenario 2)
