Gold (XAU/USD) 1H Chart AnalysisGold (XAU/USD) 1H Chart Analysis
**Current Trend:** Consolidation within a range
**Price:** \$3,335–\$3,336
**Indicators:**
* EMA 7: \$3,336.92
* EMA 21: \$3,339.36
* Price trading slightly below both EMAs – **short-term bearish pressure**
---
### 🔍 **Key Levels**
* **Resistance Zone:** \$3,344–\$3,348
* **Support Zone:** \$3,324–\$3,328
---
### 📊 **Trade Scenarios**
#### **Bullish Breakout Scenario**
* **Confirmation:** Clean breakout and candle close above **\$3,348**
* **Buy Entry:** Above \$3,348
* **Targets:**
* TP1: \$3,360
* TP2: \$3,372+
* **Invalidation:** Price falls back below \$3,344 after breakout (fakeout risk)
#### **Bearish Breakdown Scenario**
* **Confirmation:** Break and close below **\$3,324**
* **Sell Entry:** Below \$3,324
* **Targets:**
* TP1: \$3,312
* TP2: \$3,296
* **Invalidation:** Reclaim above \$3,328
---
### ⚖️ **Bias**
Neutral to Bearish until a clear breakout occurs. Monitor volume and candle strength near the support/resistance zones for trade confirmation.
Futures market

XAUUSD potential for a further decline? Fundamental perspective:
Gold hovered near $3,330, staying close to a three-week low as easing trade tensions dampened safe-haven demand. The US–EU tariff agreement and signs of progress in other trade talks have calmed fears of broader conflict, reducing gold’s geopolitical bid.
The focus now turns to the Fed’s policy decision. While interest rates are expected to remain unchanged, markets will scrutinize Powell’s remarks for any dovish signals ahead of September. Mixed US data, including softer job openings but an uptick in US consumer confidence, adds to the uncertainty, keeping gold traders on edge.
Technical Perspective:
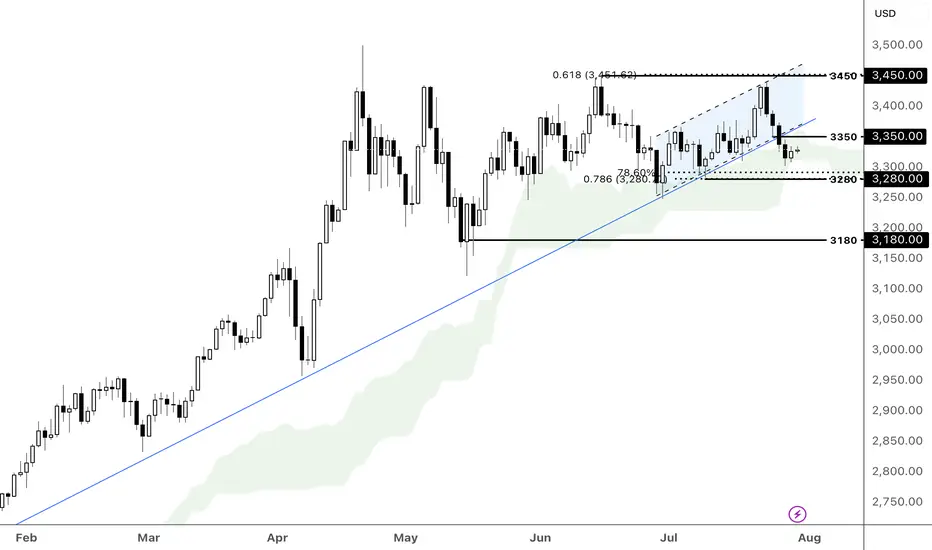
XAUUSD hovers between the 3200-3350 range following a bearish breakout of the ascending trend line and channel. An extension of its decline below the 3350 resistance and breakout zone could prompt a retest of the support at 3200, which coincides with the Fibonacci confluence area. Conversely, a break above 3350 with bullish momentum and higher swings shown on the lower timeframes could pave the way for further gains toward the swing high at 3450.
By Li Xing Gan, Financial Markets Strategist Consultant to Exness
GOLD: Next Move Is Down! Short!
My dear friends,
Today we will analyse GOLD together☺️
The market is at an inflection zone and price has now reached an area around 3,328.24 where previous reversals or breakouts have occurred.And a price reaction that we are seeing on multiple timeframes here could signal the next move down so we can enter on confirmation, and target the next key level of 3,318.05..Stop-loss is recommended beyond the inflection zone.
❤️Sending you lots of Love and Hugs❤️
Excellent re-Sell opportunities from #3,332.80 ResistanceAs discussed throughout my yesterday's session commentary: "My position: I will continue re-Sells starting with #3,332.80 Resistance and my continuation will be re-Sell every High's on Gold unless Gold closes the market above #3,352.80 benchmark."
Firstly I have Sold Gold on #3,321.80 with my set of Selling orders and in addition I have added Sells at #3,318.80 / closing all on #3,312.80 / first line of wall of Supports ahead of #3,300.80 benchmark. Then I have planned to re-Sell strong on #3,332.80 with Double Lot and closed my order on #3,322.80 (#3,332.80 - #3,322.80) which delivered excellent results. I am making spectacular Profits from my key reversal zones.
Technical analysis: Gold is Trading within my predicted values however both sides are equally probable at the moment. Needless to mention, Price-action is on important Short-term crossroads. Since #3,300.80 psychological benchmark isn't invalidated even with DX on extended relief rally, now Bullish reversal is possible towards #3,342.80 first Resistance, then #3,352.80 mark Trading above the fractal. Also #3,320.80 - #3,332.80 Neutral Rectangle Trading is possible until I have a break-out.
My position: My break-out points on both sides are calculated and ready to be used for more Profits.


Gold--sellWell, gold is having an interesting moment. It is currently correcting in a downtrend and is holding steady. I don't feel any strength in its trend. How far will it correct to the specified area?

WTI OIL The federal funds rate is the interest rate at which U.S. banks and credit unions lend their excess reserve balances to other banks overnight, usually on an uncollateralized basis. This rate is set as a target range by the Federal Open Market Committee (FOMC), which is the policymaking arm of the Federal Reserve. The current target range as of July 2025 is approximately 4.25% to 4.5%.
The federal funds rate is a key benchmark that influences broader interest rates across the economy, including loans, credit cards, and mortgages. When the Fed changes this rate, it indirectly affects borrowing costs for consumers and businesses. For example, increasing the rate makes borrowing more expensive and tends to slow down economic activity to control inflation, while lowering the rate stimulates growth by making credit cheaper.
The Fed adjusts this rate based on economic conditions aiming to maintain stable prices and maximum employment. It is a vital tool of U.S. monetary policy, impacting economic growth, inflation, and financial markets.
In summary:
It is the overnight lending rate between banks for reserve balances.
It is set as a target range by the Federal Reserve's FOMC.
It influences many other interest rates in the economy.
Current range (July 2025) is about 4.25% to 4.5%.
1. ADP Non-Farm Employment Change (Forecast: +82K, Previous: -33K)
Above Forecast:
If ADP employment is much stronger than expected, the Fed would see this as a sign of ongoing labor market resilience. Robust job growth would support consumer spending, potentially keep wage pressures elevated, and could make the Fed less likely to ease policy soon. This reinforces the case for holding rates steady or staying data-dependent on further cuts.
Below Forecast or Negative:
If ADP jobs gain falls short or is negative again, the Fed may interpret it as a weakening labor market, raising recession risk and reducing inflationary wage pressures. This outcome could increase the chances of a future rate cut or prompt a more dovish tone, provided it aligns with other softening indicators.
2. Advance GDP q/q (Forecast: +2.4%, Previous: -0.5%)
Above Forecast:
A GDP print above 2.4% signals surprisingly strong economic growth and likely sustains the Fed’s view that the U.S. economy is avoiding recession. The Fed may delay rate cuts or take a more cautious approach, as stronger growth can support higher inflation or at least reduce the urgency for support.
Below Forecast or Negative:
Weak GDP—especially if close to zero or negative—would signal that the economy remains at risk of stagnation or recession. The Fed may then pivot to a more dovish stance, become more willing to cut rates, or accelerate discussions on easing to avoid a downturn.
3. Advance GDP Price Index q/q (Forecast: 2.3%, Previous: 3.8%)
Above Forecast:
A significantly higher-than-expected GDP Price Index (an inflation measure) points to persistent or resurgent inflationary pressures in the economy. The Fed might see this as a reason to delay cuts or maintain restrictive rates for longer.
Below Forecast:
If the Price Index prints well below 2.3%, it suggests that inflation is cooling faster than anticipated. This outcome could allow the Fed to move toward easing policy if other conditions warrant, as price stability is more clearly in hand.
Bottom Line Table: Data Surprises and Likely Fed Reaction
Data Surprise Fed Outlook/Action
All above forecast Hawkish bias, rate cuts delayed or on hold
All below forecast Dovish bias, higher chances of rate cut
Mixed Data-dependent, further confirmation needed
Summary:
The Fed’s interpretation hinges on how these figures compare to forecasts and to each other. Stronger growth, jobs, and inflation = less rush to cut; weaker numbers = lower rates sooner. If growth or jobs are especially weak or inflation falls sharply, expect more dovish Fed commentary and a greater likelihood of future easing. Conversely, if the data all surprise to the upside, hawkish (rate-hold) messaging is likely to persist.
The U.S. Dollar Index (DXY) is a financial benchmark that measures the value of the United States dollar relative to a basket of six major foreign currencies. It provides a weighted average reflecting the dollar's strength or weakness against these currencies. The DXY is widely used by traders, investors, and economists to gauge the overall performance and health of the U.S. dollar on the global stage.
Key Features of the DXY:
Currencies included and their weights:
Euro (EUR) – 57.6%
Japanese Yen (JPY) – 13.6%
British Pound (GBP) – 11.9%
Canadian Dollar (CAD) – 9.1%
Swedish Krona (SEK) – 4.2%
Swiss Franc (CHF) – 3.6%
It was established in 1973 after the collapse of the Bretton Woods system to serve as a dynamic measure of the dollar's value.
The index reflects changes in the exchange rates of theses versus the U.S. dollar, with a higher DXY indicating a stronger dollar.
The DXY influences global trade dynamics, commodity prices (like oil and gold)
#SHAVYFXHUB #USOIL #WTI #OIL
Gold-sellWell, gold is having an interesting moment. It is currently correcting in a downtrend and is holding steady. I don't feel any strength in its trend. How far will it correct to the specified area

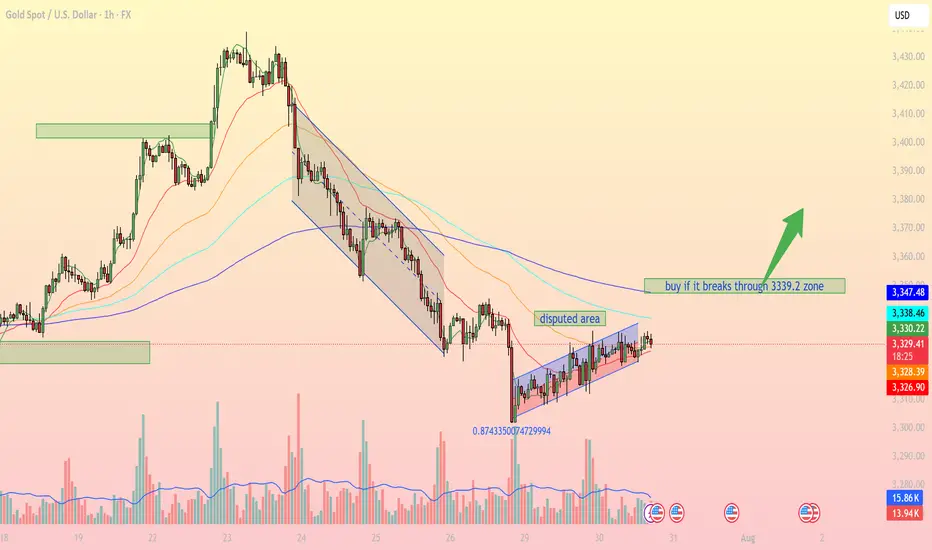
Accumulation pattern awaiting breakout confirmationIntraday Outlook: Accumulation pattern awaiting breakout confirmation
On the 1H timeframe, XAUUSD is forming a clear consolidation pattern within a narrow ascending channel after falling from a prior distribution zone. Buyers are attempting to regain control, but strong resistance remains around the 3,339 – 3,347 USD area.
1. Technical Breakdown:
Trendline & Channel: Price is currently moving inside a small rising channel, indicating a short-term bullish bias, though momentum remains limited.
EMA Dynamics: EMA 20, 50, and 100 are beginning to converge, signaling a potential breakout. A bullish EMA crossover (EMA20 > EMA50) could confirm stronger upward momentum.
Disputed Area: This zone represents heavy indecision between bulls and bears. A clear breakout above or below is needed for directional clarity.
Fibonacci Level: The 0.874 retracement level from the recent low shows strong buyer interest, potentially forming a short-term bottom.
2. Key Support & Resistance Levels:
3,339.2 USD Major resistance – needs to be broken for bullish continuation
3,347.4 USD Next resistance if breakout occurs
3,328.2 USD Immediate support (current price zone)
3,326.7 USD Strong support if price retraces
3. Suggested Trading Strategies:
Scenario 1 – Breakout Buy Strategy:
Entry: Buy if price breaks and closes above 3,339.2 USD on the 1H chart.
Stop Loss: Below 3,328 USD.
Take Profit: First target at 3,347, extended targets at 3,358 and 3,372 USD.
Scenario 2 – Pullback Long Entry:
If price fails to break resistance, consider buying the dip near the 3,326 – 3,328 USD support zone for a better risk-reward setup.
Scenario 3 – Breakdown Sell Setup:
If price breaks below 3,326 USD and exits the channel, a bearish move towards 3,295 – 3,300 USD becomes likely.
Gold is in a key consolidation phase, with the 3,339 USD resistance acting as the decisive breakout zone. Traders should closely monitor price action, volume, and EMA behavior to catch the next directional move.
Follow for more trading strategies like this. Save this post if you find it useful!
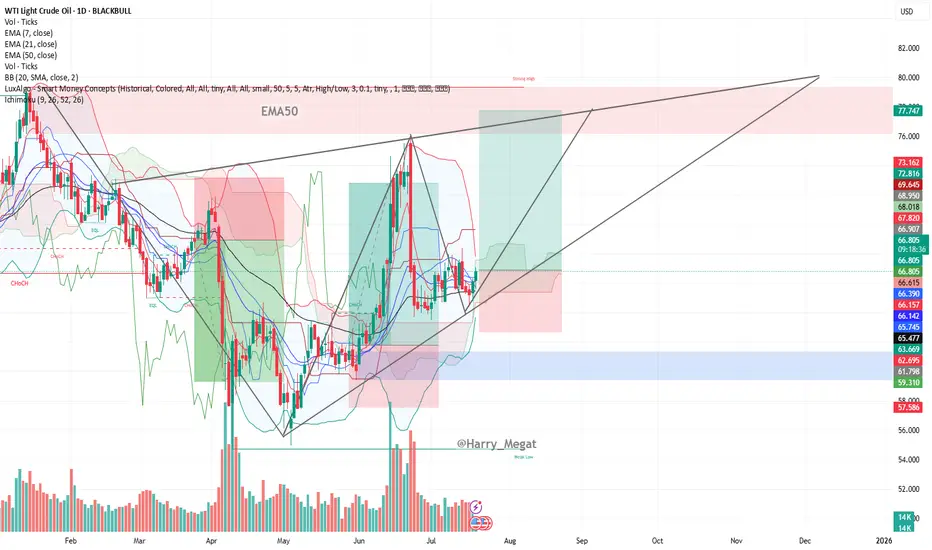
WTI Crude Oil Daily Chart Analysis (symmetrical triangle)WTI Crude Oil Daily Chart Analysis
**Trend & Structure:**
* The chart displays a **symmetrical triangle** formation, signaling a **potential breakout setup**.
* Price is currently trading around **\$66.78**, gradually rising from its recent consolidation.
* **Higher lows** and **lower highs** indicate a tightening range, which usually precedes a sharp move.
**Support & Resistance:**
* **Support Zone:** Around **\$65.47–\$66.15**, marked by the 50 EMA and prior price reactions.
* **Resistance Levels:**
* **\$68.95** – Short-term resistance and previous peak.
* **\$72.81** – Strong horizontal resistance.
* **\$77.75–\$80.00** – Projected upper trendline zone of triangle.
**Moving Averages (Bullish Setup):**
* EMA 7: **\$66.15**
* EMA 21: **\$66.14**
* EMA 50: **\$65.47**
* All EMAs are aligned in bullish order (7 > 21 > 50), confirming **bullish momentum**.
**Volume Insight:**
* Volume remains relatively steady; a spike in volume with breakout from the triangle would confirm trend continuation.
**Trade Setup Suggestion (based on chart):**
* **Breakout Buy Idea:** If price breaks above **\$68.95–\$70**, potential upside to **\$77–\$80**.
* **Invalidation:** A break below **\$65** would invalidate the bullish structure.
**Conclusion:**
WTI crude oil is trading within a symmetrical triangle, supported by bullish EMAs and tightening price action. A breakout above \$69 could trigger a bullish rally toward \$77–\$80. Keep an eye on volume confirmation and geopolitical headlines that can impact oil fundamentals.
WTI is up on my radarPrice closed above daily GM, travelled, and now retraced back to the GM..
For now, I'll be BULLISH biased and look for Buy setup on the lower time frames..
Price took out the Asian high, then gave a bearish coh triggering the backside (bearish) move of the Buy set up..
Note that the backside move is more of the manipulative move.
Price has now taken out the Asian low and come into the daily PRZ..this is an early sign that the backside move is likely coming to an end..
We wait to a see bullish coh for more confirmation, then look for complete buy set up to pull the trigger.

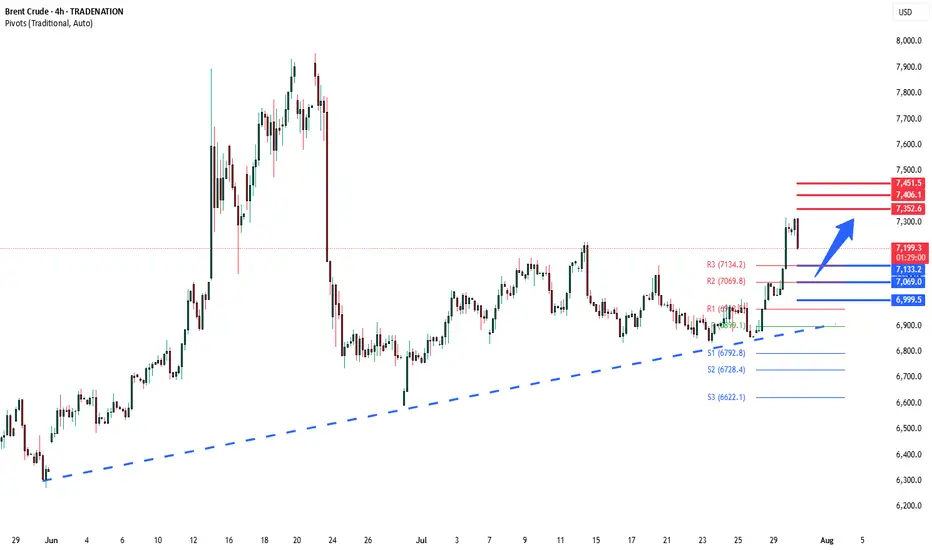
Brent Crude corrective pullback support at 7133The Brent Crude remains in a bullish trend, with recent price action showing signs of a corrective pullback within the broader uptrend.
Support Zone: 7133 – a key level from previous consolidation. Price is currently testing or approaching this level.
A bullish rebound from 7133 would confirm ongoing upside momentum, with potential targets at:
7352 – initial resistance
7406 – psychological and structural level
7451 – extended resistance on the longer-term chart
Bearish Scenario:
A confirmed break and daily close below 7133 would weaken the bullish outlook and suggest deeper downside risk toward:
7069 – minor support
7000 – stronger support and potential demand zone
Outlook:
Bullish bias remains intact while the Gold holds above 7133. A sustained break below this level could shift momentum to the downside in the short term.
This communication is for informational purposes only and should not be viewed as any form of recommendation as to a particular course of action or as investment advice. It is not intended as an offer or solicitation for the purchase or sale of any financial instrument or as an official confirmation of any transaction. Opinions, estimates and assumptions expressed herein are made as of the date of this communication and are subject to change without notice. This communication has been prepared based upon information, including market prices, data and other information, believed to be reliable; however, Trade Nation does not warrant its completeness or accuracy. All market prices and market data contained in or attached to this communication are indicative and subject to change without notice.
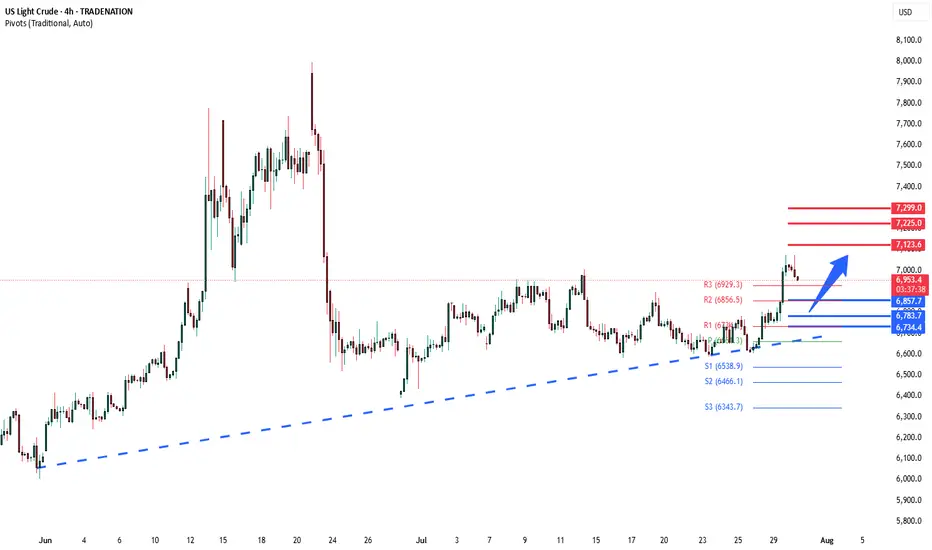
WTI uptrend pause support at 6857The WTI Crude remains in a bullish trend, with recent price action showing signs of a corrective pullback within the broader uptrend.
Support Zone: 6857 – a key level from previous consolidation. Price is currently testing or approaching this level.
A bullish rebound from 6857 would confirm ongoing upside momentum, with potential targets at:
7123 – initial resistance
7225 – psychological and structural level
7299 – extended resistance on the longer-term chart
Bearish Scenario:
A confirmed break and daily close below 6857 would weaken the bullish outlook and suggest deeper downside risk toward:
6783 – minor support
6735 – stronger support and potential demand zone
Outlook:
Bullish bias remains intact while the WTI Crude holds above 6734. A sustained break below this level could shift momentum to the downside in the short term.
This communication is for informational purposes only and should not be viewed as any form of recommendation as to a particular course of action or as investment advice. It is not intended as an offer or solicitation for the purchase or sale of any financial instrument or as an official confirmation of any transaction. Opinions, estimates and assumptions expressed herein are made as of the date of this communication and are subject to change without notice. This communication has been prepared based upon information, including market prices, data and other information, believed to be reliable; however, Trade Nation does not warrant its completeness or accuracy. All market prices and market data contained in or attached to this communication are indicative and subject to change without notice.
SILVER: Move Up Expected! Long!
My dear friends,
Today we will analyse SILVER together☺️
The recent price action suggests a shift in mid-term momentum. A break above the current local range around 38.054 will confirm the new direction upwards with the target being the next key level of 38.107 and a reconvened placement of a stop-loss beyond the range.
❤️Sending you lots of Love and Hugs❤️

Back to boring range or a pullback and trend continuation?I hope it doesn't return to that boring range and instead makes a pullback and moves upward.
Although the price of oil depends on thousands of fundamental reasons.
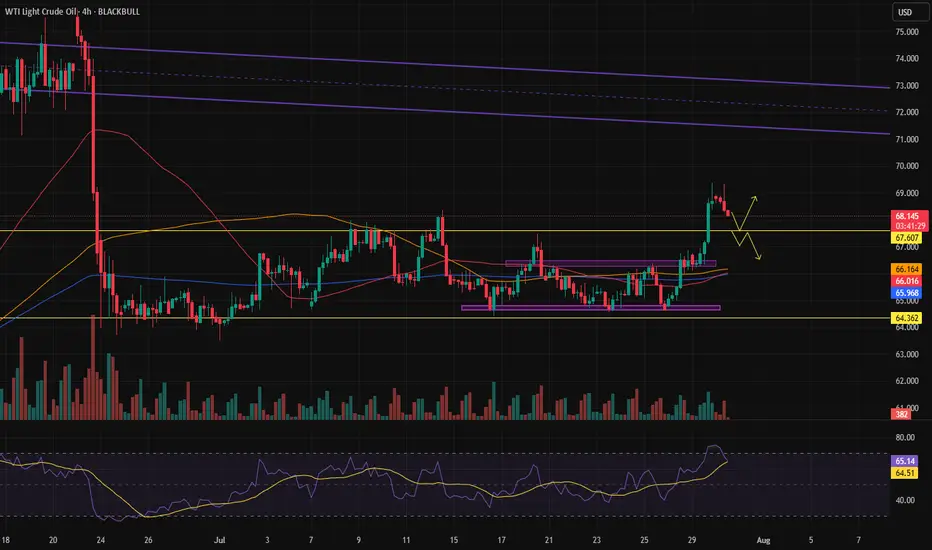
US CRUDE OIL(WTI): Consolidation ContinuesUSOIL is currently consolidating within a horizontal channel and has shown a bearish response at resistance,
The price formed a small double top pattern before declining.
There's a strong likelihood that the price will soon reach the 67.83 level.


GOLD → False breakdown 3310. Consolidation ahead of news...FX:XAUUSD is forming a false breakdown of support at 3310, thereby confirming the boundaries of the trading range. The dollar is testing strong resistance within the global downtrend. And in the near future, we can expect more economic news...
Gold is trading below the key resistance level of $3345, remaining in a narrow range ahead of the Fed's decision and US GDP data for Q2. Weak data could reinforce expectations of a rate cut and support gold, while strong data would strengthen the dollar. The Fed is likely to keep rates at 4.25–4.5%, with markets pricing in a 64% chance of a 25 bps cut in September. Investors are waiting for signals from Jerome Powell, with a possible split within the Fed: some members may support calls for easing, which would be a driver for gold.
Technically, the situation on D1 is quite interesting. Gold is still below the previously broken trend resistance, but there is no continuation of the momentum. Buyers are reacting to support at 3310, but the market is stagnating due to uncertainty ahead of the news...
Resistance levels: 3345, 3375
Support levels: 3320, 3310, 3287
Thus, from a technical analysis perspective, I expect a retest of 3345, followed by a pullback to support at 3320, from which gold could move higher (if the bulls take the initiative), but if 3320 breaks and 3310 comes under pressure, gold could test 3287. Again, the emphasis is on trend support (the upward line) in the 3335-33450 zone. If the price can consolidate in this zone, we will have confirmation that the price has returned to the boundaries of the upward trend.
Best regards, R. Linda!

XAU/USD 4H AnalysisXAU/USD 4H Analysis 🟠
Gold is currently testing the 3,333 resistance zone after a temporary pullback. With visible rejection and weak bullish momentum, I’ve entered a short position at 3,333.54.
📉 Sell Setup Details:
Entry: 3,333.54
Stop Loss: 3,346.90 (Above key structure)
Target: 3,247.63
Risk/Reward Ratio: 6.53
Target Profit: 85.91 pts (2.58%)
📊 MACD shows fading bullish strength and histogram is starting to flip.
🎯 Looking for continuation towards 3,246 support zone if price holds below VWAP.

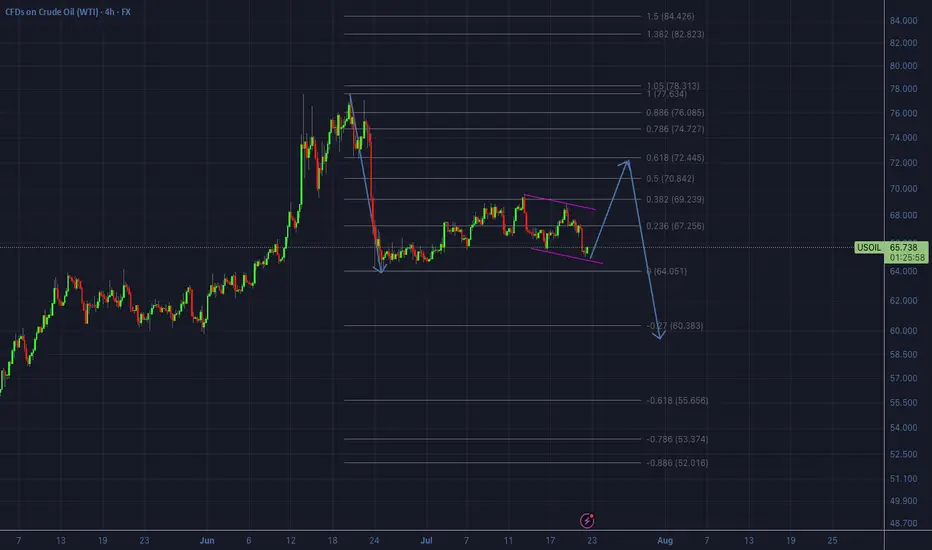
OIL - Likely development on the 4hr/daily scenarioThis looks like the likely scenario that will now develop on oil on the 4hr/daily timeframe.
In other words, we will look for an upside from now on first, back to the 0.618 re-tracement of the huge downside impulse that occurred in the last week of June.
So all buy setups we will be able to take until price hits the $72 area, then we will start looking for sells.
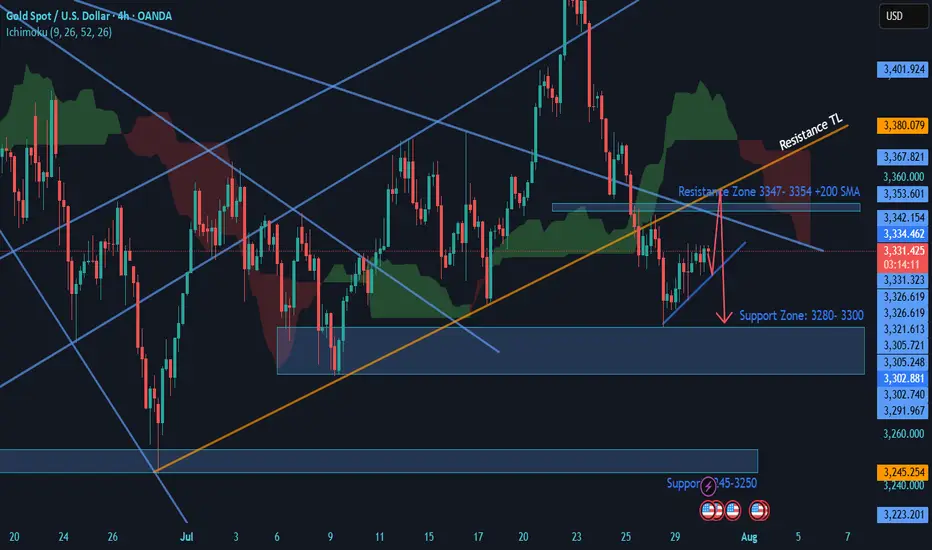
Gold holds Bearish Structure- SELLGold: Price is Exhibiting Head & Shoulders Strcure on 4H & 1 H chart. 4 H chart is Bearish, Daily chart is Neutral to bearish. Price is under the IChimuku Cloud in 4 H.
Daily chart is forming a death cross (20 SMA cutting 50 SMA) which might be completed in 1 day or Two.
Currently Gold is trying to recover losses and on retracement journey. I am expecting Price to test the 3347-3354 Zone of resistance where 4H 200+100 SMA + TL resistances+ Structure resistance will likely to Push price back to 3320 & 3300 Support Zone.
If price breaks the 3300 level. Then this daily candle break may take price to 3280 Support Level.
Good Luck
XAUUSD Outlook – July 29, 2025
Gold enters a high-risk environment starting today.
All eyes are on Jerome Powell's speech, which will signal whether the Fed remains firm on its hawkish stance or adopts a more dovish tone.
📈 That said, a broader look at the chart suggests the market has already aligned itself with the dominant trend.
🗓️ In addition to today’s speech, tariff-related news expected on Friday doesn’t seem likely to disrupt the ongoing bullish momentum in gold — or in crypto markets, for that matter.
🧠 That’s the general market read I'm sensing right now, but we’ll have to see how it unfolds.
🎯 Personally, I still view the $3290 level as a solid buy zone, with the potential to become one of gold’s historical bottoms.
