XAU/USD Intraday Plan | Support & Resistance to WatchGold remains in a bearish structure, consolidating in a narrow range after the sharp drop earlier this week. Price is trading around 3,330, testing the 3,334 resistance zone while still below the 200MA (3,362), which may act as dynamic resistance.
As long as price stays below 3,348–3,362, the bias remains to the downside, with a break below 3,309 likely exposing the 3,289–3,267 support zone.
A clean reclaim above 3,334- 3,348 would neutralize the immediate downside pressure and open the path back toward 3,373–3,387.
📌 Key Levels to Watch
Resistance:
‣ 3,334
‣ 3,348
‣ 3,362
‣ 3,373
‣ 3,387
Support:
‣ 3,309
‣ 3,289
‣ 3,267
‣ 3,241
🔎Fundamental Focus – FOMC
The FOMC rate decision and Powell’s press conference later today will be the key driver for gold. Expect sharp volatility and potential whipsaws around the release.
⚠️ Manage risk carefully, avoid chasing initial spikes, and wait for clear direction once the event dust settles.
Futures market

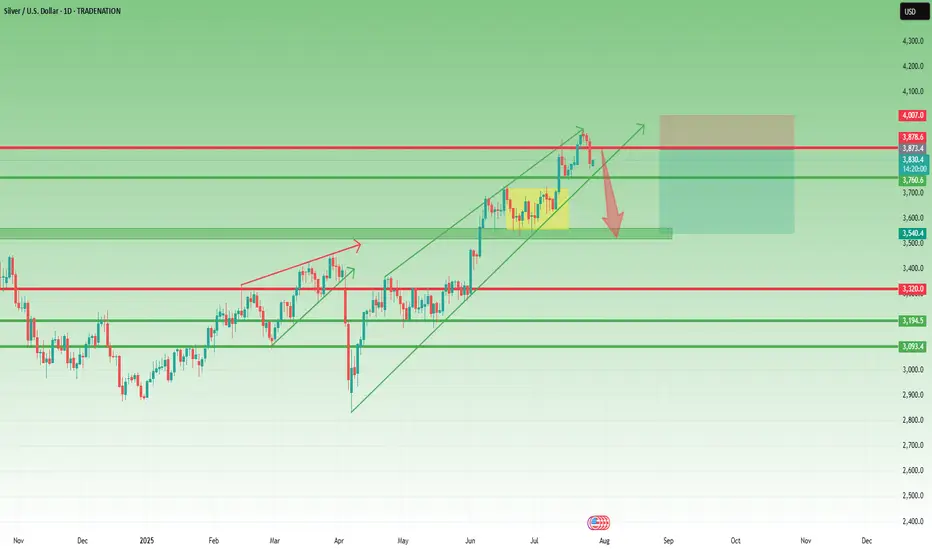
XAGUSD – Reversal Signs After the Run Toward $40Lately, I’ve been a strong advocate for a Silver rally toward $40, and indeed, we got a solid move, with price reaching as high as $39.50, not touching 40 though...
Just like with Gold, the last 3 days of last week turned bearish, and now it looks like we may be entering the early stage of a correction.
📉 Current Setup:
- The rejection from $39.50, right below the psychological $40 level, is significant
- I’ll be monitoring for a possible short entry if we get a rebound into the $38.80–$39.00 zone
- A new high above $39.50 would invalidate this setup
📌 On the downside, if price breaks below the confluence support at $37.70–$38.00, that would confirm the reversal and could lead to an acceleration toward $35.50 support
Conclusion:
The bullish narrative on Silver is pausing here. Until a new high is made, I’m looking to sell the bounce and follow the momentum if the breakdown under support is confirmed.
Let’s see how this plays out this week. 🧭
Disclosure: I am part of TradeNation's Influencer program and receive a monthly fee for using their TradingView charts in my analyses and educational articles.
[XAUUSD – Intraday Price Action Outlook | 30 July 2025Gold (XAUUSD) is currently trading around 3,329 USD and is consolidating within a narrow rising channel after completing a significant downtrend. The market is showing signs of a potential breakout, either to continue a short-term bullish correction or resume the dominant bearish momentum.
Key Technical Zones:
Resistance zone: 3,339.2 – 3,348
This is a critical zone where bullish breakout confirmation is likely to attract momentum buyers. The zone aligns with upper trendline resistance and previous consolidation highs.
Support zone: 3,325.6 – 3,292.7
This range acts as a short-term support base, marked by multiple rejections and aligned with the lower boundary of the current rising wedge formation. A breakdown here could trigger strong bearish continuation.
Indicators & Confluences:
EMA200 (blue): Acting as dynamic resistance, slightly above current price.
EMA50 & EMA100: Compressing toward current price action, indicating price equilibrium and coiling volatility.
RSI (not shown): Likely hovering near 50 – signaling market indecision.
Fibonacci 0.874 has been tagged – often a zone where false breakouts or liquidity grabs occur, demanding caution.
Trading Strategy Suggestions:
Bullish Scenario (Breakout Strategy)
Entry: Buy only if price closes above 3,339.2 (confirmed breakout of wedge).
Stop-loss: Below 3,328.1 (previous supply turned demand).
Target: 3,370 – 3,392 zone (aligned with EMA200 breakout & prior structure).
Note: This setup relies on confirmation and should not be anticipated early. Wait for candle close above 3,339.2 to invalidate current wedge structure.
Bearish Scenario (Rejection & Breakdown Strategy)
Entry: Sell if price rejects 3,330–3,332 area and returns below 3,327.80 (as marked).
Stop-loss: Above 3,332.04 (above trendline and EMA cross).
Target: 3,292.74 (volume node + base of channel).
Risk/Reward: >7.0 (based on current tool parameters shown in chart).
This is a favorable setup if price respects current wedge resistance and fails to breakout convincingly.
Conclusion:
Gold is at a decisive point. The formation of a rising wedge in a prior downtrend signals potential bearish continuation, but a breakout above 3,339.2 could trigger a reversal short-term. Both bulls and bears need confirmation before entering. Monitor volume closely — rising volume on breakout/breakdown will validate either scenario.

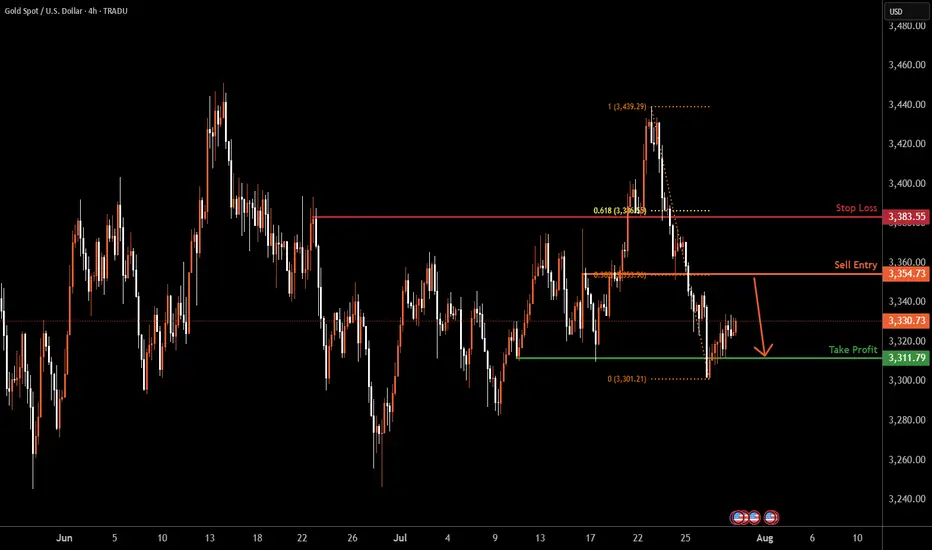
XAUUSD H4 | Heading into pullback resistanceBased on the H4 chart analysis, the price is rising towards the sell entry, which is a pullback resistance that lines up with the 38.2% Fibonacci retracement and could drop to the take profit.
Sell entry is at 3,354.73, which is a pullback resistance that aligns with the 38.2% Fibonacci retracement.
Stop loss is at 3,383.55, which is a pullback resistance that is slightly below the 61.8% Fibonacci retracement.
Take profit is at 3,311.79, which is a multi-swing low support.
High Risk Investment Warning
Trading Forex/CFDs on margin carries a high level of risk and may not be suitable for all investors. Leverage can work against you.
Stratos Markets Limited (tradu.com ):
CFDs are complex instruments and come with a high risk of losing money rapidly due to leverage. 65% of retail investor accounts lose money when trading CFDs with this provider. You should consider whether you understand how CFDs work and whether you can afford to take the high risk of losing your money.
Stratos Europe Ltd (tradu.com ):
CFDs are complex instruments and come with a high risk of losing money rapidly due to leverage. 66% of retail investor accounts lose money when trading CFDs with this provider. You should consider whether you understand how CFDs work and whether you can afford to take the high risk of losing your money.
Stratos Global LLC (tradu.com ):
Losses can exceed deposits.
Please be advised that the information presented on TradingView is provided to Tradu (‘Company’, ‘we’) by a third-party provider (‘TFA Global Pte Ltd’). Please be reminded that you are solely responsible for the trading decisions on your account. There is a very high degree of risk involved in trading. Any information and/or content is intended entirely for research, educational and informational purposes only and does not constitute investment or consultation advice or investment strategy. The information is not tailored to the investment needs of any specific person and therefore does not involve a consideration of any of the investment objectives, financial situation or needs of any viewer that may receive it. Kindly also note that past performance is not a reliable indicator of future results. Actual results may differ materially from those anticipated in forward-looking or past performance statements. We assume no liability as to the accuracy or completeness of any of the information and/or content provided herein and the Company cannot be held responsible for any omission, mistake nor for any loss or damage including without limitation to any loss of profit which may arise from reliance on any information supplied by TFA Global Pte Ltd.
The speaker(s) is neither an employee, agent nor representative of Tradu and is therefore acting independently. The opinions given are their own, constitute general market commentary, and do not constitute the opinion or advice of Tradu or any form of personal or investment advice. Tradu neither endorses nor guarantees offerings of third-party speakers, nor is Tradu responsible for the content, veracity or opinions of third-party speakers, presenters or participants.
Gold Price Analysis July 30Gold (XAUUSD) Consolidating in a Triangle Pattern – Preparing for a Big Breakout
Currently, gold is moving within a triangle consolidation pattern, reflecting the market’s indecision as investors await a series of important economic data from the US this week. This hesitation suggests that a breakout from the triangle pattern could trigger a strong FOMO effect, creating a significant price movement in either direction.
The current price action is similar to a “bull flag” or “pennant” pattern, where a breakout could lead to a clearer and more decisive trend. If the support zone in the pattern fails to hold, the possibility of a sell-off is high.
Trading scenario:
🔻 Activate SELL order:
When price breaks the triangle bottom around 3324
Downside target: 3285, further is the strong support zone at 3250
🔺 Activate BUY order:
When price breaks and holds above the resistance zone 3333
Or: when there is a bearish rejection signal and candle confirmation at the area 3385

XAUUSD. MINOR UPWARDS CONSOLIDATION BEFORE THE NEXT MOVE.XAUUSD. MINOR UPWARDS CONSOLIDATION BEFORE THE NEXT MOVE.
XAUUSD rebounded from local support level of 3,300.00 and attempted to develop some bullish momentum here yesterday. However, the price went into consolidation, showing us the weakness of this short-term bullish rebound. RSI shows the bearish divergence, the price is ready to drop. Of course, fundamentals of last couple of days don't favor this asset either. The decline towards support level of 3,300.00 is expected.

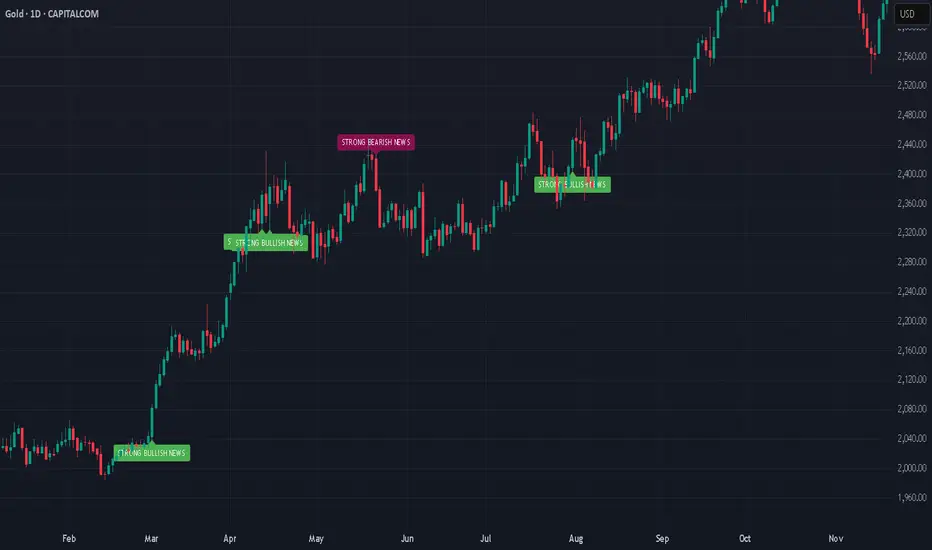
Gold - Powerful RunAfter its powerful run, gold has shown signs of fatigue, stalling near technical resistance between $3,330–$3,350 per ounce in late July. Analysts warn that while the bullish trend remains intact on a structural level, daily volatility is high and some profit-taking or consolidation could continue unless new destabilizing events emerge.
Will the Rally Continue?
The Bull Case
Structural Demand: Multiple sources, including J.P. Morgan and other major forecast groups, predict gold’s structural bull case remains strong with average prices of $3,220–$3,675 per ounce likely through the end of 2025, and even $4,000 possible by 2026.
Ongoing Uncertainty: Persistent geopolitical risks, trade disputes, and fiscal pressures are expected to maintain robust safe haven flows into gold.
Central Bank and Asian Demand: Sustained buying by central banks and consumers in Asia could provide a solid floor below current levels.
The Bear Case
Interest Rate Dynamics: If central banks, especially the US Federal Reserve, hold or increase interest rates, gold could lose momentum, higher rates increase the opportunity cost of holding non yielding bullion.
Diminishing New Risks: Unless fresh economic or geopolitical shocks appear, further upside may be capped in the near term. Several experts predict gold may consolidate or trade sideways pending new catalysts.
Speculator Flows: Rapid speculative bets could lead to sharp corrections, particularly on technical breakdowns after such a strong rally.
Conclusion
The gold rally of 2025 has been driven by an unusual mix of global volatility, central bank behavior, and shifting investor psychology. While prices could pause or pull back in the coming months, the fundamental supports structural demand, central bank buying, and persistent global risks, suggest that the broader gold bull cycle is not yet over, with $3,000+ likely forming the new base for gold as we look toward 2026.
*NOT INVESTMENT ADVICE*
#gold #safehaven #uncertainty #economy #finance #trading #indicator
20250730-XAUUSD IdeaSupport was found at the key level of 3310. The ADP report is scheduled to be announced at 8:15 p.m. today. Monitoring whether the price continues to break lower or begins an ABC retracement following the strong downward impulse.

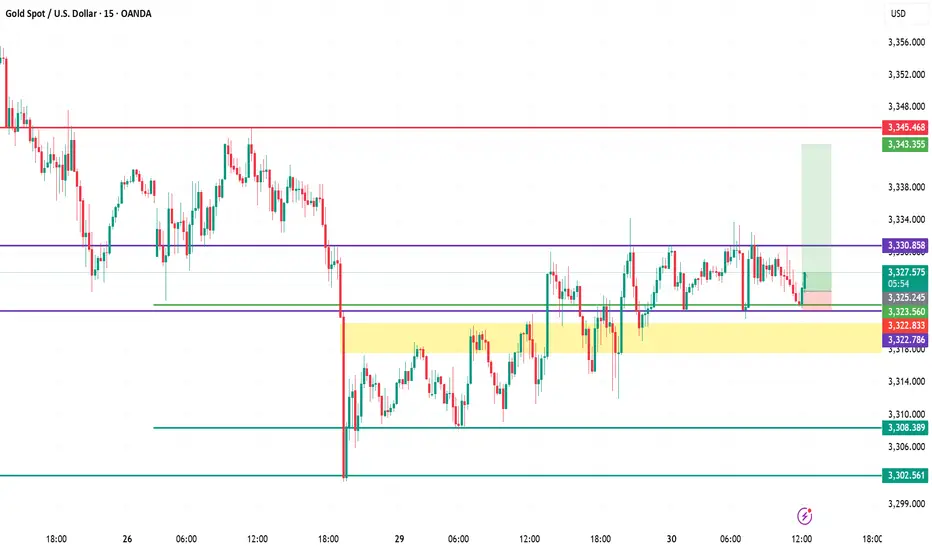
XAUUSD (Gold) Analysis – July 30, 2025 | 15-Min ChartStructure & Context
Gold is consolidating just above the key intraday support of $3,323, following a bounce from the high-demand zone ($3,322–$3,323.5).
Demand Zone Validity
The yellow zone has consistently attracted buyers, defending it multiple times with sharp rejections. This confirms it as a short-term demand base.
Resistance Still Capping Upside
$3,330.85 acts as immediate resistance. Price has failed to close above it despite several wicks testing this zone — showing strong seller presence.
Scalp Long Idea In Play
A buy setup is in motion with entry near $3,323.5, stop below $3,322, and target at $3,337.5. Risk-to-reward remains favorable while above demand.
Critical Levels to Watch
Support: $3,322.8 → $3,308.3 → $3,302.5
Resistance: $3,330.8 → $3,337.5 → $3,345.4
🎯 Bias: Bullish above $3,322, bearish if broken.
XAU/USD (Gold Spot vs US Dollar) Technical Analysis – 4H Char🔍 XAU/USD (Gold Spot vs US Dollar) Technical Analysis – 4H Chart
Based on my shared image from TradingView, here's a detailed analysis of the current XAU/USD market scenario:
---
🧩 Chart Type & Indicators Used
Timeframe: 4-Hour (H4)
Platform: TradingView
Indicators:
Ichimoku Cloud
Bollinger Bands (BB)
Support/Resistance zones
Trendlines
Price Action with Target Points Marked
---
📉 Current Market Structure
Price: ~$3,324 (Sell/Buy zone shown)
Overall Trend: Turning bearish in the short term.
Price Action:
Price has broken below an ascending trendline, suggesting a shift from bullish to bearish momentum.
The price is trading below the Ichimoku cloud, reinforcing a bearish bias.
Failed retest of the cloud resistance zone (around 3,335–3,340), which now acts as a resistance.
---
🔻 Bearish Signals
1. Trendline Break:
The rising trendline support (mid-July to now) is broken.
This indicates a potential reversal from the previous bullish momentum.
2. Retest & Rejection:
Price attempted to retest the breakdown zone and was rejected from the 3,335–3,340 level.
3. Ichimoku Cloud Bearish Setup:
Price is clearly below the cloud.
Future cloud is bearish (red shaded).
Chikou Span (lagging line) is below price candles and cloud.
---
🎯 Targets
First Target Point: ~3,300
This is the next horizontal support level (near recent lows).
Final Target Point: ~3,270
Stronger support zone and measured move from breakdown.
---
🛡 Resistance Zone
Immediate Resistance: 3,335–3,340
Stronger Resistance: 3,370
---
📌 Conclusion
The XAU/USD 4H chart shows a bearish breakout below the rising channel, with confirmation from Ichimoku and price rejection at cloud resistance. The market is targeting 3,300 as the first support, and if that breaks, 3,270 will likely follow.
---
✅ Strategy Suggestion (if trading):
Bias: Short/Sell
Entry: After a weak pullback or retest near 3,330–3,335
Targets:
TP1: 3,300
TP2: 3,270
Stop Loss: Above 3,345 or near 3,350 zone
Let me know if you'd like this in simpler terms or want me to track the next setup.

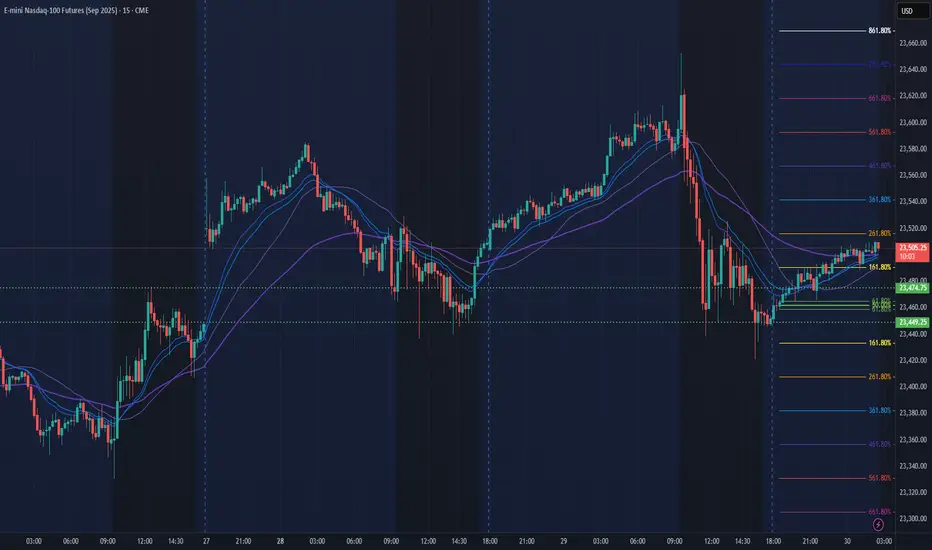
NQ Power Range Report with FIB Ext - 7/30/2025 SessionCME_MINI:NQU2025
- PR High: 23474.75
- PR Low: 23449.25
- NZ Spread: 57.0
Key scheduled economic events:
08:15 | ADP Nonfarm Employment Change
08:30 | GDP
10:30 | Crude Oil Inventories
14:00 | FOMC Statement
- Fed Interest Rate Decision
14:30 | FOMC Press Conference
AMP temp margins increase anticipating vol spike for economic events
Session Open Stats (As of 12:25 AM 7/30)
- Session Open ATR: 232.98
- Volume: 16K
- Open Int: 281K
- Trend Grade: Long
- From BA ATH: -0.6% (Rounded)
Key Levels (Rounded - Think of these as ranges)
- Long: 23811
- Mid: 22096
- Short: 20383
Keep in mind this is not speculation or a prediction. Only a report of the Power Range with Fib extensions for target hunting. Do your DD! You determine your risk tolerance. You are fully capable of making your own decisions.
BA: Back Adjusted
BuZ/BeZ: Bull Zone / Bear Zone
NZ: Neutral Zone
Oil surges on Russia sanction threats but long-term risks remainOil prices have climbed around 6% this week, driven by two key developments: a trade deal between the EU and the US, and Donald Trump’s warning that the US may impose sanctions on Russian oil buyers within 10 days unless progress is made toward ending the Russia-Ukraine war.
Russia accounts for about 10.5% of global oil production. Major buyers like China and India, which take 47% and 38% of Russia’s crude exports respectively, are still negotiating their trade deals with the US. That gives Washington leverage to pressure them into cutting back without fully banning imports, which would risk triggering a much sharper price surge.
If China, India, the EU, and Turkey shift away from Russian oil, demand would rise elsewhere, supporting prices. Still, while the short-term technical picture remains bullish above 67.28, prices face resistance between 75.43 and 77.80. This range marks the upper bound of a multi-year downward channel.
OPEC+ also meets this weekend. The group has been increasing production to align with Trump’s promise to lower oil prices, a move that weighs on the long-term outlook. Add to that the impact of new tariffs—15% on EU and Japan exports, 10% on UK goods, and likely more to come for China and India—and global GDP growth could slow, further capping oil’s upside.
Unless prices break convincingly above 77.80, the broader trend remains bearish.
This content is not directed to residents of the EU or UK. Any opinions, news, research, analyses, prices or other information contained on this website is provided as general market commentary and does not constitute investment advice. ThinkMarkets will not accept liability for any loss or damage including, without limitation, to any loss of profit which may arise directly or indirectly from use of or reliance on such information.

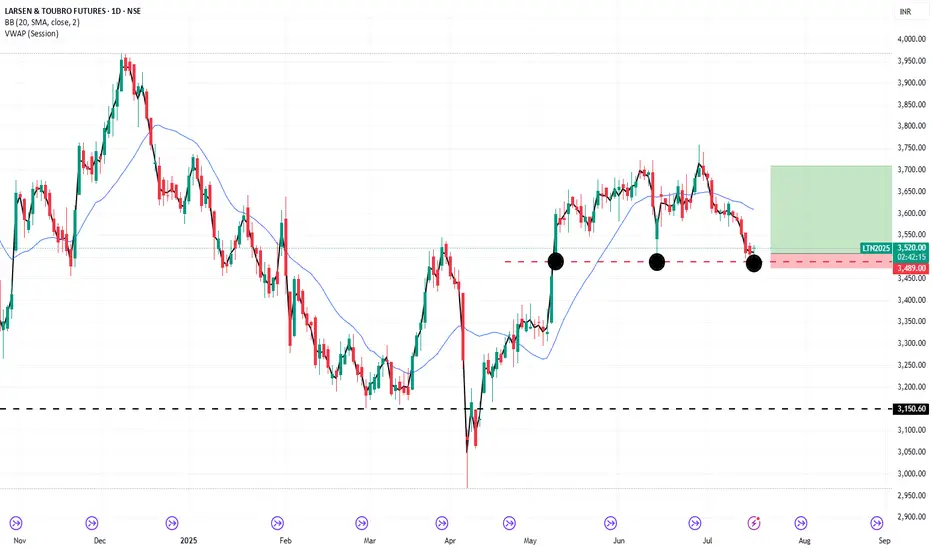
0.5:2 = risk:rewardIts third time LT is taking support @ 3480 & bouneing back, if it sustains & close above 3525 then it ll target 3700.
Very good Risk:Reward Ratio.
Could b bought @ cmp Wih Stoploss of 3475 & target of 3700
XAUUSDXAUUSD Updated in 30M :
The gold signal is marked on the chart based on the latest price changes and the supply and demand in the market. These points include the entry point, stop loss, and take profit

XAUUSDXAUUSD Updated in 30M :
The gold signal is marked on the chart based on the latest price changes and the supply and demand in the market. These points include the entry point, stop loss, and take profit


POLICYBZRPolicybzr breaking out of consolidation of over a month time & made flag pattern on daily charts while taking support from 100 MA as well 0618 fib retracement level. With all indicators suggesting long.
Risk: Reward = 1:2.5
Short term traders can trade with target of 1900 & stoploss of 1750

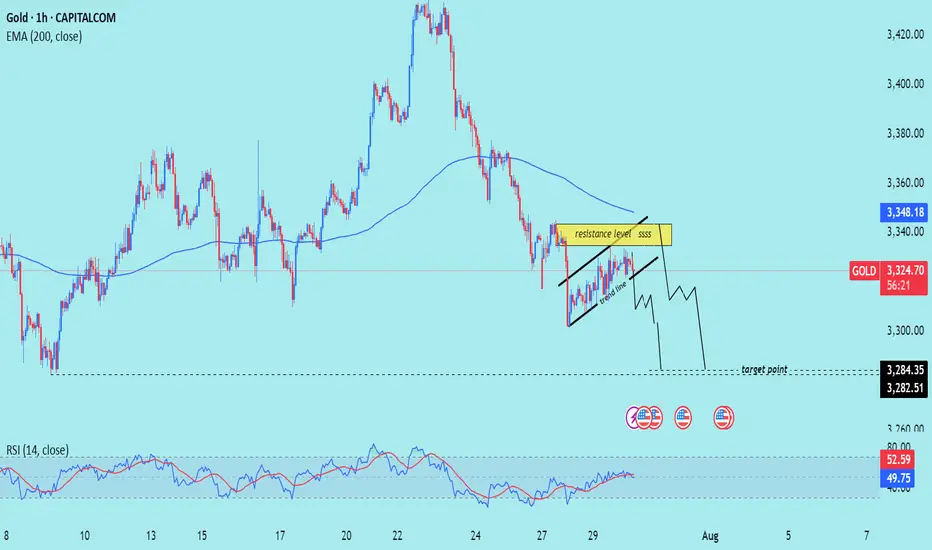
XAU/USD) Bearish Trend Read The captionSMC Trading point update
Technical analysis of Gold (XAU/USD) on the 1-hour timeframe, using a combination of trend lines, EMA, RSI, and price structure.
---
Technical Breakdown:
1. Price Structure:
Gold is forming a rising channel (black trend lines) within a short-term uptrend, but this is happening below the 200 EMA, which generally indicates bearish momentum.
A resistance zone is highlighted near the top of the channel, suggesting sellers might defend this level.
2. Key Level:
Resistance Level: Around 3,330–3,335 zone.
Target Point: Price is expected to break down from the channel and reach support levels near 3,284.35 and 3,282.51.
3. Moving Average (EMA 200):
Current price is below the 200 EMA (3,348.42), reinforcing a bearish bias.
4. RSI (14):
RSI is near 52.58, indicating neutral-to-slightly-overbought territory. No strong divergence is visible, but RSI is not confirming a bullish trend either.
5. Projection (Hand-drawn Path):
The drawn path shows a potential breakdown from the channel with a bearish impulse targeting lower support zones.
Mr SMC Trading point
---
Trade Idea Summary:
Bias: Bearish
Confirmation Needed: Break below channel support
Entry Zone: Near the resistance of the rising channel (~3,330–3,335)
Target Zone: 3,284.35 – 3,282.51
Invalidation: Sustained break above 3,348 (above EMA 200)
plesse support boost 🚀 this analysis)
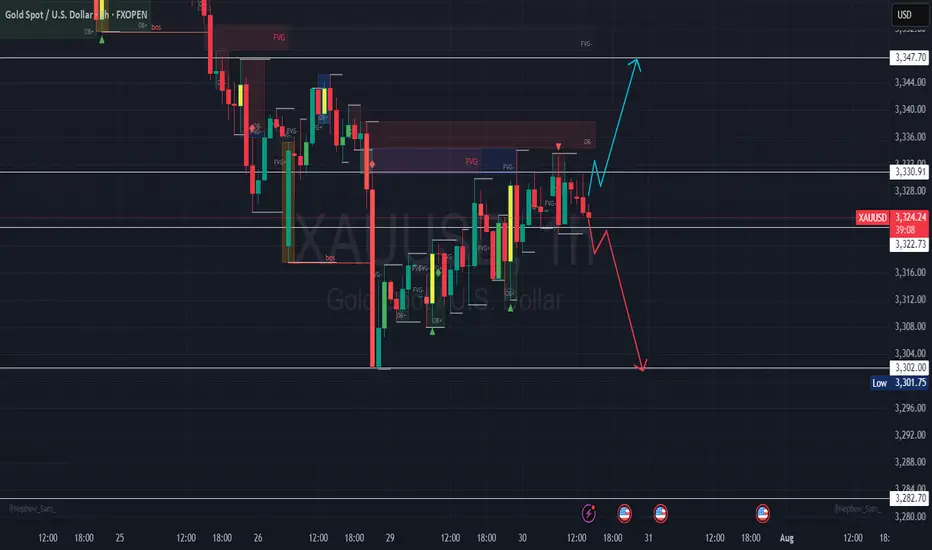
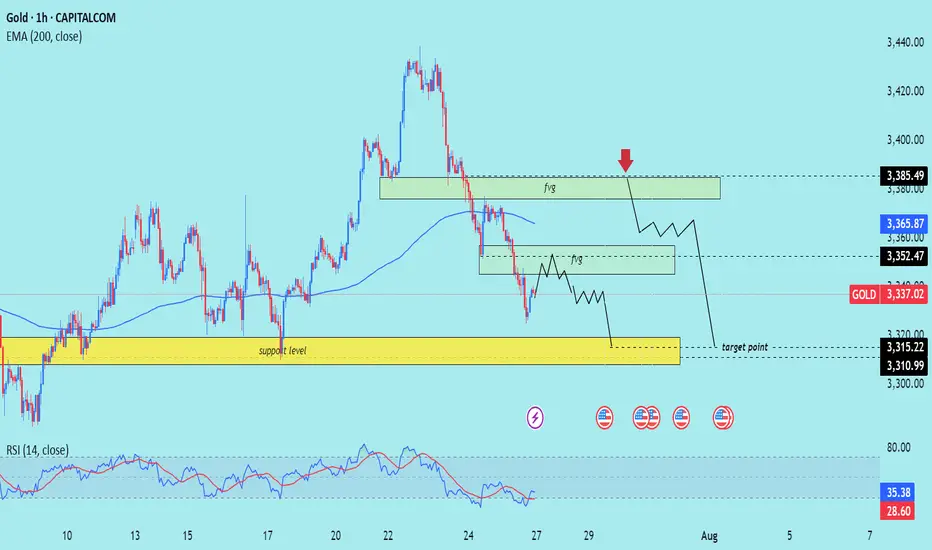
XUA/USD) Bearish Trend Read The captionSMC Trading point update
Technical analysis of (XAU/USD) on the 1-hour timeframe, targeting a move toward the $3,310–$3,315 support zone. Here's the full breakdown:
---
Technical Analysis – Gold (1H)
1. Fair Value Gap (FVG) Supply Zones
Two FVG supply zones are marked where price previously dropped sharply:
Upper FVG zone near $3,385.49 (with red arrow: expected rejection point)
Lower FVG zone near $3,352.47
Price is expected to reject from either zone, resuming the bearish move.
2. Market Structure: Lower Highs, Lower Lows
The chart shows a clear bearish structure, with consistent lower highs and lower lows.
The current price action suggests a potential pullback into FVG, followed by another leg down.
3. Key Support Zone (Target Area)
The yellow box between $3,315.22–$3,310.99 represents a strong demand/support zone and is marked as the target point.
This level has acted as a prior accumulation zone and is likely to attract buying interest again.
4. EMA 200 Resistance
Price is trading below the 200 EMA (currently at $3,365.87) — indicating a bearish bias.
EMA also aligns near the lower FVG zone, reinforcing the area as a potential reversal point.
5. RSI Indicator
RSI at 35.38 is nearing oversold territory but still shows downward pressure.
No divergence or reversal signal yet — supports the continuation view.
Mr SMC Trading point
---
Summary
Bias: Bearish
Current Price: $3,337.02
Supply Zones (FVG):
$3,385.49 (stronger supply)
$3,352.47 (minor supply)
Support Target: $3,315.22–$3,310.99
Structure: Bearish (LL-LH formation)
EMA: 200 EMA acting as dynamic resistance
RSI: 35.38 – still bearish momentum
---
Please support boost 🚀 this analysis)
Patience Through VolatilityThere's something the market teaches you over time that no book, course, or checklist ever really prepares you for - “how to live with uncertainty” .
It's amazing how quickly the market can make you doubt yourself. You can be doing everything right - following your process, managing your risk, sticking to your plans, and then volatility hits. Suddenly, nothing seems to make sense. The moves feel random. Your setups fail. Your confidence fades. You start questioning not just your trades, but yourself.
You'll have stretches where patience feels like the hardest thing in the world. Watching markets whip up and down without direction, sitting on your hands when you want to trade just to feel in control again, it's exhausting in a different way. It's not the exhaustion of doing too much. It's the weight of doing nothing when your instincts scream at you to act.
That’s the part most people don’t talk about. It’s not the losing trades that break most traders, it’s the feeling of being stuck. The uncertainty of not knowing when the noise will fade. The frustration of watching opportunities slip by without a clear way to take part. It’s the slow grind of sitting through volatility while your discipline quietly wears down, day after day.
Patience isn’t something you can show off. Most of the time, it looks like doing nothing. And often, it feels like falling behind.
Good trading isn't about finding opportunities in every move, it's about knowing when the market favours you, and when it doesn't. It's about understanding your edge and protecting it.
Some environments aren't built for your system, your style, or your strengths. Volatile markets don't offer you clean setups or easy entries. They offer noise, confusion, and temptation.
Most traders don’t struggle because of volatility itself, but because of the impatience it creates. They force trades. They chase moves. They try to squeeze something out of the market simply because the waiting feels unbearable.
But waiting is not a weakness. Sitting still is not inaction. Restraint is a skill.
Your progress won’t always be visible. It won’t always show up on a chart at the end of the day. Sometimes, progress is simply preserving your capital. Sometimes, it’s maintaining your discipline. And sometimes, it’s protecting your mindset so you’re ready when the right opportunities finally come back into focus.
You have to learn to stomach the discomfort of volatility without tying your self-worth to every swing in your account. The noise always feels permanent in the moment. Doubt grows louder. You start questioning your system, your progress, and even yourself. (More on this in a future post.)
That's normal.
What matters is what you do with those feelings. Whether you let them push you into reckless trades just to feel something again, or whether you have the maturity to sit still, protect your capital, protect your mindset, and wait.
There’s no hack for this. No shortcut. Patience is something you earn the hard way - forged in boredom, frustration, and the silence between trades. Patience isn’t about passively waiting; it’s about actively protecting yourself, your energy, your future self from the damage you could cause today.
Not every moment in the market is meant for action. Not every day is meant for progress. Some days, weeks, or even months are simply about survival. Some seasons are for growth, and others are just for holding on. Knowing the difference is what keeps you in the game long enough to eventually see the rewards.
The market will calm. Patterns will return. Opportunities will align. Your edge will reappear. The chaos always fades. The clarity always returns. When it does, you want to be ready - not emotionally drained, not financially wrecked, and not scrambling to recover from the mistakes impatience forced on you.
But if you lose patience and start chasing just to feel active, you risk more than money. You risk undoing the very discipline you’ve worked so hard to build.
Volatility will always test you. That's its nature. Patience will always protect you. That's your choice.
If you’re in one of those stretches right now - high volatility, failing setups, doubt creeping in; remind yourself this is part of the process. It’s normal, and it’s not the time to force progress.
Let the market burn itself out.
If you can do that, you’ll find yourself ahead, not because you forced results, but because you endured the pain when others couldn’t.
The rewards won’t come from predicting the next move. They’ll come from knowing you didn’t let the storm in the market create a storm within you.
Trust that clarity will return. Your only job is to make sure you’re still here when it does.
There’s strength in waiting. There’s wisdom in restraint.
Xausd techinical analysis.Xausd techinical analysis next move posibale at h2 time frame not finchinal advice.
