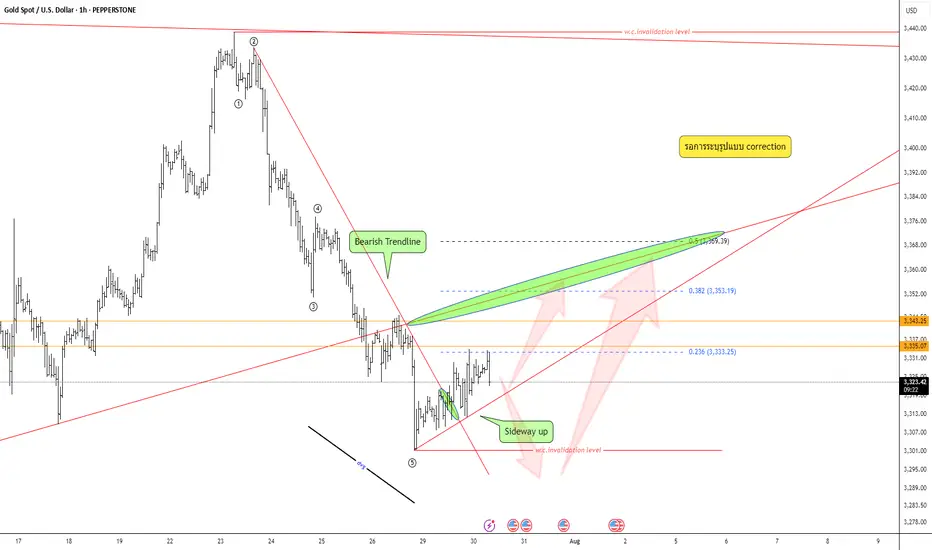
Keep an eye on the correction pattern —Quick Take:
- Strong bearish move, but wave structure still unclear — not a confirmed impulse.
- Bear trendline has broken; market now leaning toward sideways-up.
- Divergence is visible.
Plan:
Wait for correction pattern → confirm with your system → execute only with full data and strict risk management.
Futures market
XAU/USD(20250730) Today's AnalMarket News:
According to a Reuters/Ipsos poll, Trump's approval rating has fallen to 40%, the lowest level since his second term.
Technical Analysis:
Today's Buy/Sell Levels:
3322
Support and Resistance Levels:
3348
3338
3332
3312
3306
3296
Trading Strategy:
If the market breaks above 3332, consider entering a buy position, with the first target price at 3338. If the market breaks below 3322, consider entering a sell position, with the first target price at 3312.

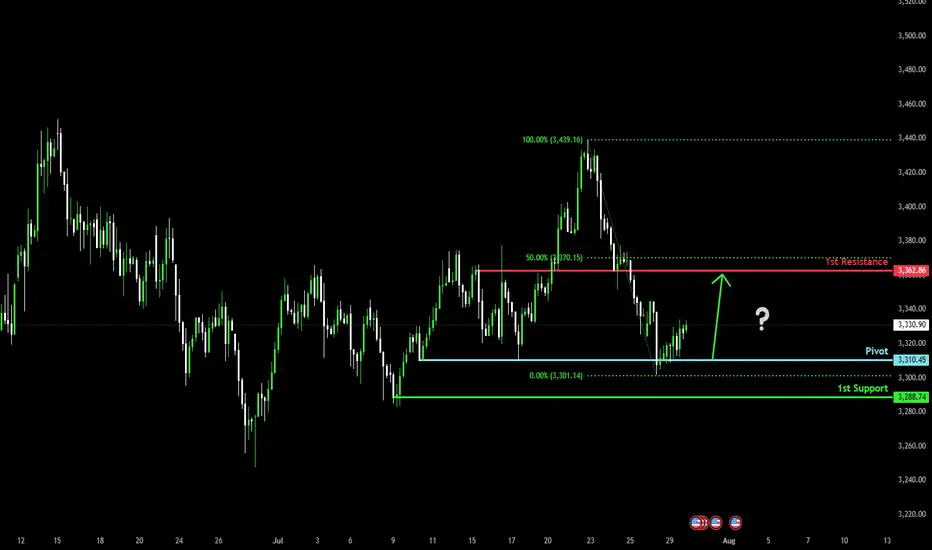
Bullish bounce off?The Gold (XAU/USD) has bounced off the pivot, which acts as a multi-swing low support and could rise to the 1st resistance, which is slightly below the 50% Fibonacci retracement.
Pivot: 3,310.45
1st Support: 3,288.74
1st Resistance: 3,362.86
Risk Warning:
Trading Forex and CFDs carries a high level of risk to your capital and you should only trade with money you can afford to lose. Trading Forex and CFDs may not be suitable for all investors, so please ensure that you fully understand the risks involved and seek independent advice if necessary.
Disclaimer:
The above opinions given constitute general market commentary, and do not constitute the opinion or advice of IC Markets or any form of personal or investment advice.
Any opinions, news, research, analyses, prices, other information, or links to third-party sites contained on this website are provided on an "as-is" basis, are intended only to be informative, is not an advice nor a recommendation, nor research, or a record of our trading prices, or an offer of, or solicitation for a transaction in any financial instrument and thus should not be treated as such. The information provided does not involve any specific investment objectives, financial situation and needs of any specific person who may receive it. Please be aware, that past performance is not a reliable indicator of future performance and/or results. Past Performance or Forward-looking scenarios based upon the reasonable beliefs of the third-party provider are not a guarantee of future performance. Actual results may differ materially from those anticipated in forward-looking or past performance statements. IC Markets makes no representation or warranty and assumes no liability as to the accuracy or completeness of the information provided, nor any loss arising from any investment based on a recommendation, forecast or any information supplied by any third-party.
Daily Analysis- XAUUSD (Wednesday, 30th July 2025)Bias: Bullish
USD News(Red Folder):
-ADP Non-Farm Employment Change
-Advance GDP q/q
-Federal Funds Rate
-FOMC Statement
-FOMC Press Conference
Notes:
- Bullish closure after daily liquidity sweep
- Looking for price to respect 0.618 fib level
- Potential BUY if there's
confirmation on lower timeframe
- Pivot point: -
Disclaimer:
This analysis is from a personal point of view, always conduct on your own research before making any trading decisions as the analysis do not guarantee complete accuracy.

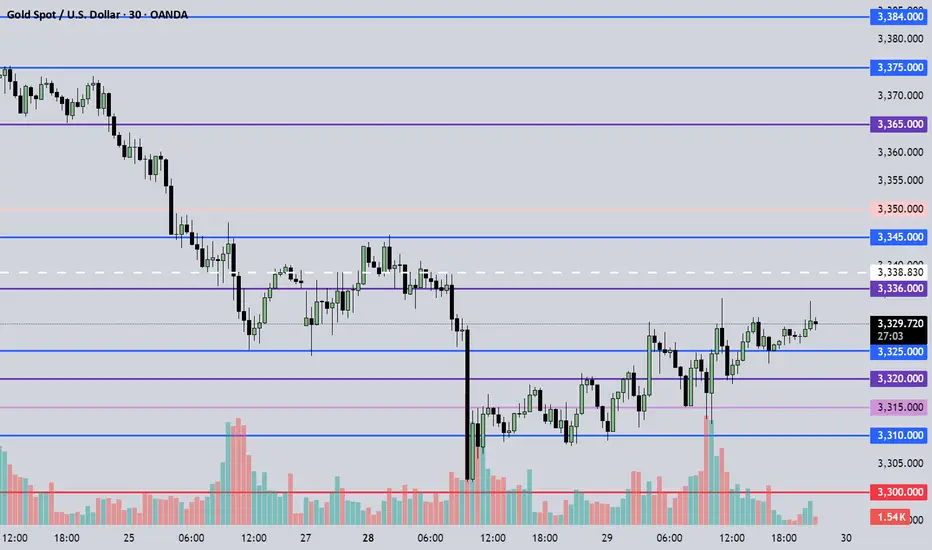
July 30, 2025 - XAUUSD GOLD Analysis and Potential Opportunity🔍 Key Levels to Watch:
• 3384 – Resistance
• 3375 – Key resistance
• 3365 – Resistance
• 3345 – Resistance
• 3336 – Resistance
• 3325 – Key support
• 3310 – Support
• 3300 – Psychological level
• 3283 – Major support
• 3275 – Support
• 3265 – Support
📈 Intraday Strategy:
• SELL if price breaks below 3325 → target 3320, then 3315, 3310, 3300
• BUY if price holds above 3330 → target 3336, then 3345, 3350, 3356
👉 If you find this helpful or traded using this plan, a like would mean a lot and keep me motivated. Thanks for the support!
Disclaimer: This is my personal view, not financial advice. Always use proper risk control.
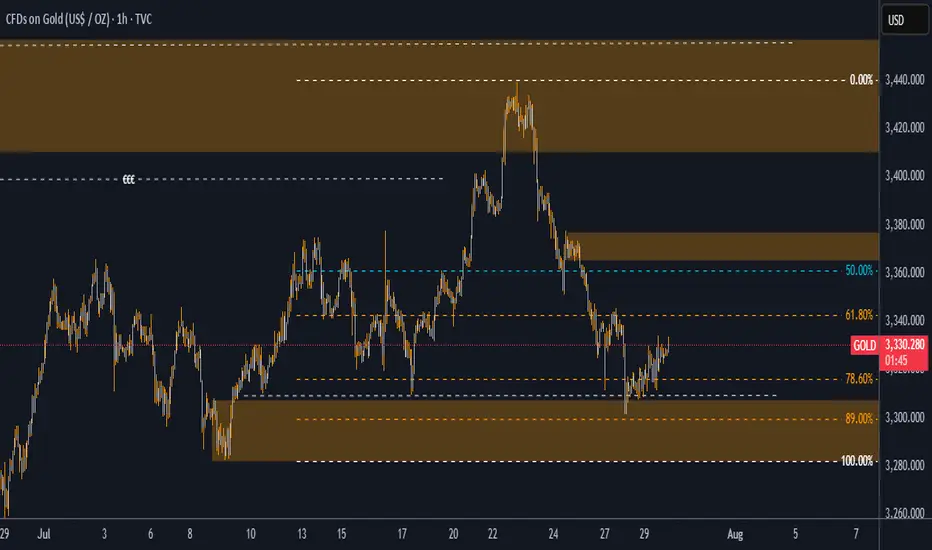
Gold (XAU/USD) – Technical UpdateDate: July 30, 2025
✅ Market Reaction Confirms the Forecast
In our previous analysis, we highlighted the $3,308–$3,315 region as a high-probability demand zone, reinforced by a deep retracement into the 89% Fibonacci level. We also pointed to a liquidity grab beneath $3,308 and projected a potential bullish reversal toward $3,345 and $3,398.
Today, price action has validated this view with precision.
✅ Price swept liquidity below $3,308 as expected, triggering a sharp rejection from our zone.
✅ A clear bounce followed, pushing price upward and confirming that large buyers stepped in—exactly where we anticipated.
✅ The structure is now shifting bullish, with price currently trading above $3,331, heading confidently toward our first target at $3,345.
📊 Why This Matters
This reaction was not random—it followed the logic laid out in the prior analysis:
-The demand zone was respected.
-The discounted pricing at 89% retracement offered maximum risk-reward.
-The internal imbalance between $3,345–$3,398 continues to act as a magnet, just as we outlined.
This is a textbook move where price hunted stops, tapped into demand, and began its upward drive—exactly as described in advance.
🎯 Targets Remain Valid
Target 1: $3,345 → Currently in progress. Price is gravitating toward this level, which also aligns with the 50% Fib retracement and minor supply.
Target 2: $3,398 → The final destination of this bullish move, completing the fill of the inefficiency left behind by the last drop.
🧠 Final Word
This is a strong confirmation of the original idea. The technical story has unfolded step by step as predicted, proving the reliability of the analysis. For traders following along, this not only reinforces confidence in the setup—but also showcases the power of disciplined, structure-based trading.
🔥 The move is unfolding exactly as projected. Patience, precision, and planning are now paying off.
consider like and follow so you don't miss any next analysis or update of the chart
you can ask me in the comment section
Crude oil starts to rise, are you ready?
💡Message Strategy
Oil prices continued their upward trend amid rising geopolitical risks. US President Trump recently issued a tough statement, demanding Russia end the conflict with Ukraine within 10 to 12 days or face secondary sanctions.
Fears that Russian crude oil exports might be disrupted pushed Brent crude oil prices close to $70 per barrel, marking their largest single-day gain in two weeks at 2.3%. Meanwhile, US West Texas Intermediate (WTI) crude oil prices also remained stable around $67.
The intertwined uncertainties of geopolitics and trade policy have complicated market sentiment. Besides the situation between Russia and Ukraine, investors are closely watching the August 1st trade policy deadline set by the United States and the upcoming OPEC+ meeting in early August, which will determine its September crude oil production increase plan.
The industry generally expects that despite tight crude oil inventories in some parts of the world and strong peak season consumption in the Northern Hemisphere, if OPEC+ continues to increase production, oversupply pressure will gradually emerge by the end of the year.
📊Technical aspects
From a technical perspective, the daily chart of US crude oil (WTI) shows a modest upward trend. The current price is trading steadily above its 100-day moving average, indicating continued bullish momentum.
The Relative Strength Index (RSI) remains between 55 and 60, remaining within overbought territory, suggesting further upside potential. A successful break above the key resistance level of $68.50 would open up opportunities towards $70.
💰Strategy Package
Long Position:66.50-67.00,SL:65.50,Target:68.50-69.00

Potential transitionThe S&P 500 daily chart has gotten down to levels that buyers have entered this market previously. This means be cautious on the short side and be aware of the fundamentals that will be released on Wednesday.

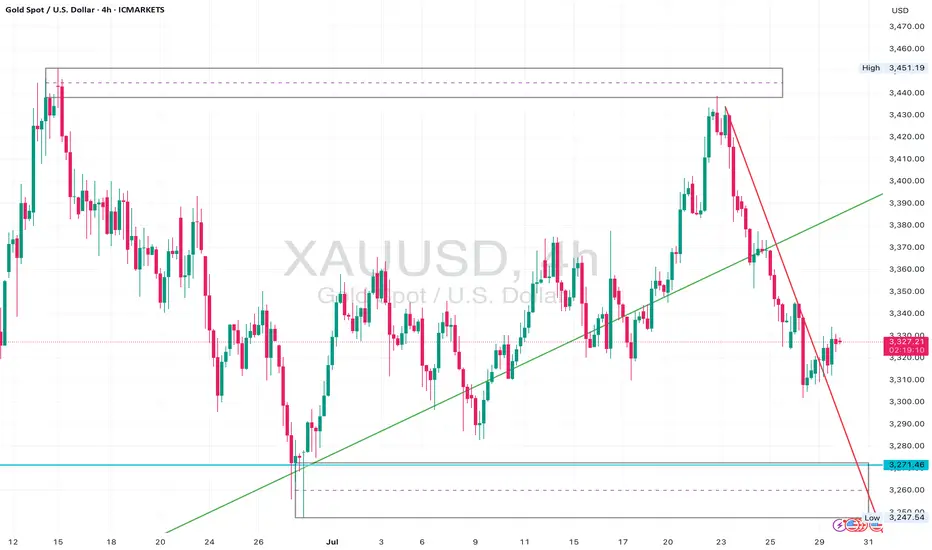
Gold Bear Flag Forming After Trendline Break – Short Setup BelowGold (XAUUSD) recently broke a major ascending trendline that had held since late June, leading to an aggressive sell-off from the $3,440s down to the $3,270 zone.
Following that, price is now consolidating just beneath the previous support trendline, forming what appears to be a bear flag or rising channel inside a corrective structure.
The $3,330–$3,340 zone is now acting as resistance, and price is struggling to close above this level.
The current structure suggests continuation to the downside, with clean space to revisit the $3,271 liquidity pool and potentially even sweep that low.
Watch for bearish confirmation below the current flag – especially if price prints a rejection wick or engulfing candle at the upper edge of the box.
⸻
Key Levels:
• Resistance: $3,330 – $3,340 (flag top + previous support turned resistance)
• Support: $3,271 zone, followed by $3,248 sweep potential
⸻
Trigger Criteria:
• Bearish rejection inside the flag (e.g. pin bar or engulfing)
• Break and retest of the flag bottom or horizontal support
⸻
Risk Note:
A clean break back above $3,350 and reclaim of the previous trendline would invalidate this idea short term and shift bias back to neutral/bullish.
GOLD GOLDEN XauUsd is now still respecting the trend and will keep holding expecting an even stronger push to the up side

GOLD this snicky GuyTruth be told, im not a big fan of this scenario, its going up mssy but it still looking Bulish, i I have to make a call I will be tking the sell from 3370 and yeah mayb the buy with really, really small risk, but its is up to you
Levels labeled in the chart
GG
Stock Index Matrix: ES, NQ, YM Weekly BiasES: $6,323.25
NQ: $23,171.50
YM: $44,504
Bearish for all markets mentioned

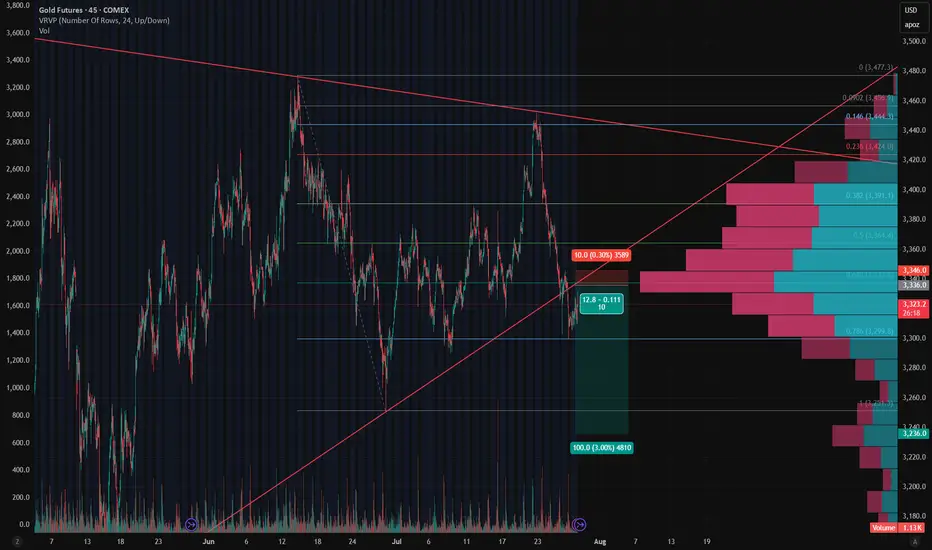
Gold - Short Setup Off Major Trendline Rejection📉 Gold - Short Setup Off Major Trendline Rejection
Gold has broken down through the rising trendline and is now retesting it — the moment of truth! 🧐
🔻 Short Entry: 3,336
🎯 Target: 3,236 (Fib 1.0 + HVN gap fill)
🛑 Stop: 3,346 (Above trendline retest)
⚖️ Risk/Reward: ~1:10
📊 Bonus: High volume node above adds resistance. Bearish volume profile structure confirms the breakdown bias.
Watching for volume to pick up on the move down. Let's see if GC bleeds into August. 🩸📆
XAGUSD | Silver Rebounds from 37.50 After 39.50 RejectionSilver pulled back sharply after failing at the 39.50 resistance zone. Price is currently consolidating just above the 37.50 support area, which has held firm on the initial retest.
Support at: 37.50 / 37.00 🔽
Resistance at: 39.50 🔼
🔎 Bias:
🔼 Bullish: A clean breakout above 39.50 could resume the uptrend.
🔽 Bearish: A break below 37.50 opens room toward 37.00 and 36.00.
📛 Disclaimer: This is not financial advice. Trade at your own risk.

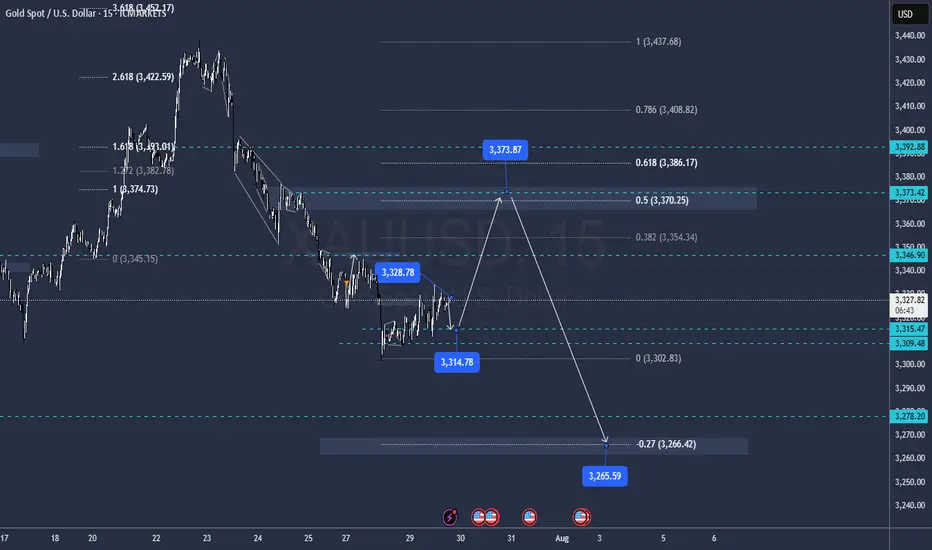
XauUsdThere are two analyses.
As you can see, the overall trend is bullish and long positions have more chances, the important market points are drawn accurately and have high validity.
The red arrow has a 60% chance of occurring and the blue arrow has a 40% chance.
Important market points:
Resistance:
3340
3369
3390
3422
Support:
3303
3280

Gold Intraday Trading Plan 7/30/2025Gold is trapped within the channel as shown in the chart since yesterday. It enters a consolidation period. I am still bearish in gold. The consolidation is, in my opinion, gaining power for bears.
Therefore, I am waiting for the breaking of the channel. Once it's broken, I will look for retesting for selling orders.
First target for today is 3300.
Ultimate target 3280.

7/30: Watch for Sell Opportunities in the 3352–3363 ZoneGood morning, everyone!
After a period of consolidation and decline, gold has found preliminary support near the 3300 level, and early signs of a bottom formation are emerging. The key technical level now lies around the 3332–3337 resistance zone. Based on current price structure, a breakout is likely, with major resistance seen at 3352–3358, while 3323–3316 serves as the primary support range.
However, caution is warranted as today’s ADP employment data may significantly influence short-term price action. Whether gold can hold above the 3337–3343 level depends on the data's impact.
From a broader perspective:
On the weekly chart, the 20-period moving average (MA20) has climbed to around 3276, yet the overall structure remains bearish for bulls
On the daily chart, gold is still trading below the MA60, facing notable resistance
This week's key events — ADP (Wednesday), jobless claims, and NFP (Thursday and Friday) — will likely shape gold’s medium-term trend
Trading Strategy for Today:
Focus on the 3313–3353 trading range, and be highly responsive to data-driven volatility.
Important note: If gold rises to 3343–3358 before the ADP release, then regardless of whether the data is bullish or bearish, the preferred approach is to sell into strength, as a post-data pullback is a likely scenario.

GOLD BEARISH BIAS|SHORT|
✅GOLD broke the rising
Support line which is now
A resistance and the price
Is retesting the line now so
We are locally bearish biased
And we will be expecting a
Local move down
SHORT🔥
✅Like and subscribe to never miss a new idea!✅
Disclosure: I am part of Trade Nation's Influencer program and receive a monthly fee for using their TradingView charts in my analysis.

XAUUSD 5M SUPPLY SETUPDuring the Asia-to-London session, price was in a clear uptrend, printing higher highs. However, in the pre-New York session, momentum shifted , price failed to break the recent high and instead formed a new low, eventually breaking structure with a lower low and confirming a trend reversal. This move left a clean supply zone behind. Price later retraced to that supply zone and showed strong rejection with a clear wick reaction, signaling potential selling pressure. I waited for the candle break and entered short, placing stops above the highest wick within the zone. Targeted a 1:2 R:R. Price consolidated briefly but eventually hit target, securing profits and wrapping up the session with discipline and precision.

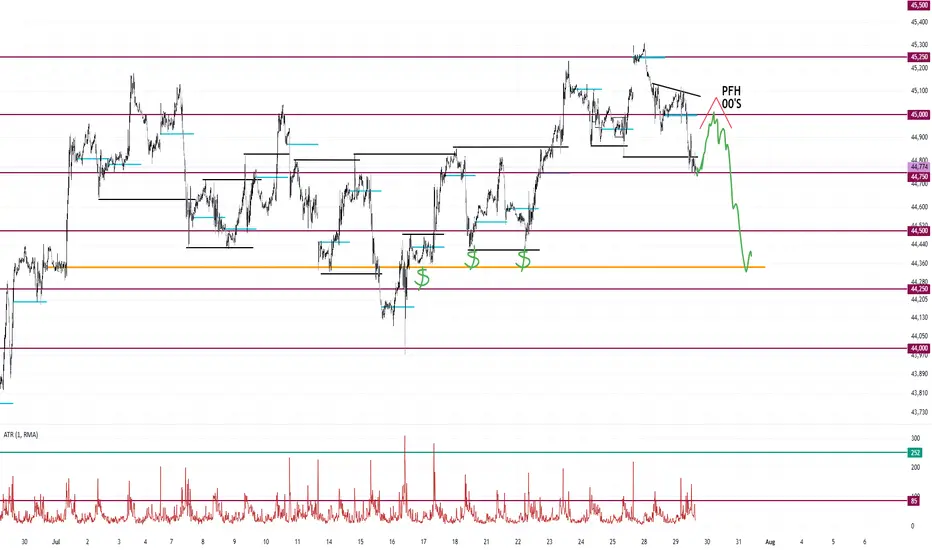
Peak Formation High Into Double Zero's Dump to Monthly OpenLooking for a peak formation high to form under the double zeros.
The market is most likely targeting the liquidity sitting around the monthly open.
I don't see any support until the market takes out some of these lows. Maybe at 44,250.
Highlighted in red brush is every peak formation high formed this month.
XAUUSD BUYS PROJECTION Hey everyone wow is been long since I posted here I can say for sure trading has never been so tougher for me cuz am tryna refine my edge and I miss posting and sharing my ideas here so this is my analysis on Gold after seeing Gold rejected a strong resistance zone and price keeps pushing down tho I missed the sells but market is always full of opportunity and here are my zones to take buys from,mind you these zone are very strong support zones that mostly buyers get in the market so I will be waiting for price to get to the first zone which is the green and the second is for scaling in after placing the first on breakeven and yes I will update you guys…..

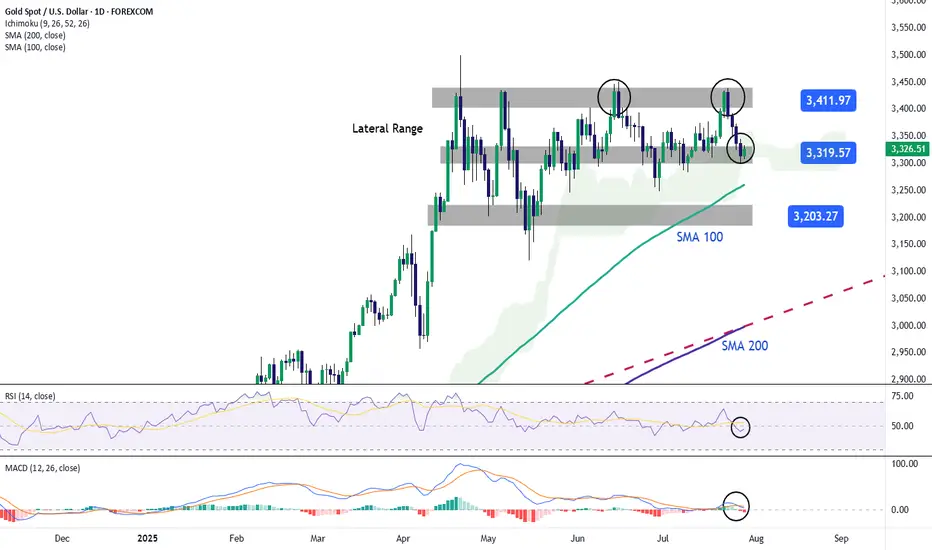
GOLD Falls Back Toward the $3,300 ZoneOver the past four trading sessions, gold has depreciated more than 3.5%, showing a renewed and steady bearish bias around this major safe-haven asset in the short term. Selling pressure has remained strong recently, as confidence in financial markets has gradually improved. Investors have responded positively to the latest trade agreement developments, which have temporarily reduced concerns surrounding the trade war. As a result, demand for safe-haven assets has declined, directly impacting gold, one of the most important hedging instruments currently in the market.
Sideways Range Remains Active
Since late April, gold has been unable to establish a clear directional bias, and has remained trapped within a sideways range, with resistance around $3,400 per ounce and support at $3,300 per ounce. So far, price action has not been strong enough to break out of this structure. However, gold is now testing important support levels, where sellers could begin to face stronger barriers as the price attempts to break through the bottom of the established range.
RSI: The RSI line has consistently crossed below the neutral 50 level, indicating that selling momentum is becoming more dominant. If this trend continues in the short term, it could reinforce the presence of bearish pressure in upcoming sessions.
MACD: The MACD histogram has started to move below the zero line, suggesting that the momentum of the moving averages has shifted firmly to the downside. This reflects a strong bearish tone, and if this continues, selling pressure could become more relevant in the short term.
Key Levels:
$3,400 per ounce – Major Resistance: This level marks the recent all-time high for gold. If buying momentum pushes the price back above this zone, it could trigger a renewed bullish bias and set the stage for a sustained upward trend in the sessions ahead.
$3,300 – Current Barrier: This level defines the lower bound of the short-term channel. A break below this support could confirm a dominant bearish bias, potentially lasting for several trading sessions.
$3,200 – Final Support: This marks the lowest price level reached by gold in recent months and lies below the 100-period simple moving average. If the price drops to this zone, it could trigger the start of a new short-term downtrend on the chart.
Written by Julian Pineda, CFA – Market Analyst
XAUUSD – TCB Strategy Setup✅ TCB Strategy Analysis
Trend Phase
HTF Bias: Recently shifted from bearish to potential bullish — clear breakout from descending channel.
Current Structure: Price has broken above channel and retested former structure resistance (~3325) as support.
Bias: Bullish continuation forming.
🚨 XAUUSD – TCB Strategy Setup (EP1 Active, EP2 Pending) 💥
Price just broke out of the descending channel and is now forming a solid base above the 3325 zone.
✅ EP1 (Pullback Buy) already triggered after price retested support.
📍 EP2 will activate on clean breakout + retest of 3330 zone.
🎯 Targets:
• TP1: 3348
• TP2: 3356–3360
If price loses 3325 structure, we reassess. For now, I’m bullish while structure holds.
This setup aligns 100% with the TCB Strategy:
Trend Phase: Bullish structure forming
Countertrend: Liquidity sweep + reclaim
Breakout Phase: Incoming on 3330 retest
🧠 Flow with structure, not emotion.
💬 Drop your comment if you're trading Gold too.
#TCBFlow #XAUUSD #GoldAnalysis #SmartMoney #BreakoutTrading #FlowWithTCB
