Gold Intraday Trading Plan 7/30/2025Gold is trapped within the channel as shown in the chart since yesterday. It enters a consolidation period. I am still bearish in gold. The consolidation is, in my opinion, gaining power for bears.
Therefore, I am waiting for the breaking of the channel. Once it's broken, I will look for retesting for selling orders.
First target for today is 3300.
Ultimate target 3280.
Futures market

7/30: Watch for Sell Opportunities in the 3352–3363 ZoneGood morning, everyone!
After a period of consolidation and decline, gold has found preliminary support near the 3300 level, and early signs of a bottom formation are emerging. The key technical level now lies around the 3332–3337 resistance zone. Based on current price structure, a breakout is likely, with major resistance seen at 3352–3358, while 3323–3316 serves as the primary support range.
However, caution is warranted as today’s ADP employment data may significantly influence short-term price action. Whether gold can hold above the 3337–3343 level depends on the data's impact.
From a broader perspective:
On the weekly chart, the 20-period moving average (MA20) has climbed to around 3276, yet the overall structure remains bearish for bulls
On the daily chart, gold is still trading below the MA60, facing notable resistance
This week's key events — ADP (Wednesday), jobless claims, and NFP (Thursday and Friday) — will likely shape gold’s medium-term trend
Trading Strategy for Today:
Focus on the 3313–3353 trading range, and be highly responsive to data-driven volatility.
Important note: If gold rises to 3343–3358 before the ADP release, then regardless of whether the data is bullish or bearish, the preferred approach is to sell into strength, as a post-data pullback is a likely scenario.

GOLD BEARISH BIAS|SHORT|
✅GOLD broke the rising
Support line which is now
A resistance and the price
Is retesting the line now so
We are locally bearish biased
And we will be expecting a
Local move down
SHORT🔥
✅Like and subscribe to never miss a new idea!✅
Disclosure: I am part of Trade Nation's Influencer program and receive a monthly fee for using their TradingView charts in my analysis.

XAUUSD 5M SUPPLY SETUPDuring the Asia-to-London session, price was in a clear uptrend, printing higher highs. However, in the pre-New York session, momentum shifted , price failed to break the recent high and instead formed a new low, eventually breaking structure with a lower low and confirming a trend reversal. This move left a clean supply zone behind. Price later retraced to that supply zone and showed strong rejection with a clear wick reaction, signaling potential selling pressure. I waited for the candle break and entered short, placing stops above the highest wick within the zone. Targeted a 1:2 R:R. Price consolidated briefly but eventually hit target, securing profits and wrapping up the session with discipline and precision.

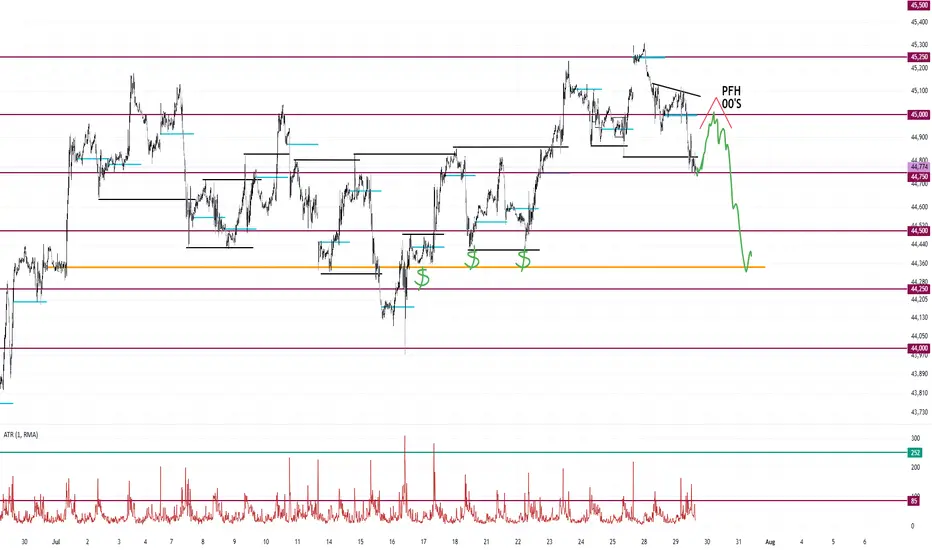
Peak Formation High Into Double Zero's Dump to Monthly OpenLooking for a peak formation high to form under the double zeros.
The market is most likely targeting the liquidity sitting around the monthly open.
I don't see any support until the market takes out some of these lows. Maybe at 44,250.
Highlighted in red brush is every peak formation high formed this month.
XAUUSD BUYS PROJECTION Hey everyone wow is been long since I posted here I can say for sure trading has never been so tougher for me cuz am tryna refine my edge and I miss posting and sharing my ideas here so this is my analysis on Gold after seeing Gold rejected a strong resistance zone and price keeps pushing down tho I missed the sells but market is always full of opportunity and here are my zones to take buys from,mind you these zone are very strong support zones that mostly buyers get in the market so I will be waiting for price to get to the first zone which is the green and the second is for scaling in after placing the first on breakeven and yes I will update you guys…..

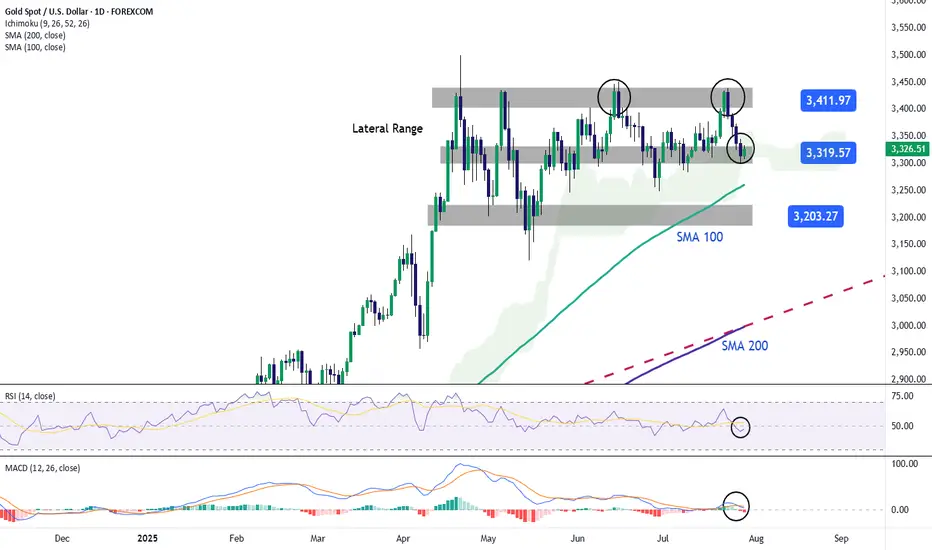
GOLD Falls Back Toward the $3,300 ZoneOver the past four trading sessions, gold has depreciated more than 3.5%, showing a renewed and steady bearish bias around this major safe-haven asset in the short term. Selling pressure has remained strong recently, as confidence in financial markets has gradually improved. Investors have responded positively to the latest trade agreement developments, which have temporarily reduced concerns surrounding the trade war. As a result, demand for safe-haven assets has declined, directly impacting gold, one of the most important hedging instruments currently in the market.
Sideways Range Remains Active
Since late April, gold has been unable to establish a clear directional bias, and has remained trapped within a sideways range, with resistance around $3,400 per ounce and support at $3,300 per ounce. So far, price action has not been strong enough to break out of this structure. However, gold is now testing important support levels, where sellers could begin to face stronger barriers as the price attempts to break through the bottom of the established range.
RSI: The RSI line has consistently crossed below the neutral 50 level, indicating that selling momentum is becoming more dominant. If this trend continues in the short term, it could reinforce the presence of bearish pressure in upcoming sessions.
MACD: The MACD histogram has started to move below the zero line, suggesting that the momentum of the moving averages has shifted firmly to the downside. This reflects a strong bearish tone, and if this continues, selling pressure could become more relevant in the short term.
Key Levels:
$3,400 per ounce – Major Resistance: This level marks the recent all-time high for gold. If buying momentum pushes the price back above this zone, it could trigger a renewed bullish bias and set the stage for a sustained upward trend in the sessions ahead.
$3,300 – Current Barrier: This level defines the lower bound of the short-term channel. A break below this support could confirm a dominant bearish bias, potentially lasting for several trading sessions.
$3,200 – Final Support: This marks the lowest price level reached by gold in recent months and lies below the 100-period simple moving average. If the price drops to this zone, it could trigger the start of a new short-term downtrend on the chart.
Written by Julian Pineda, CFA – Market Analyst
XAUUSD – TCB Strategy Setup✅ TCB Strategy Analysis
Trend Phase
HTF Bias: Recently shifted from bearish to potential bullish — clear breakout from descending channel.
Current Structure: Price has broken above channel and retested former structure resistance (~3325) as support.
Bias: Bullish continuation forming.
🚨 XAUUSD – TCB Strategy Setup (EP1 Active, EP2 Pending) 💥
Price just broke out of the descending channel and is now forming a solid base above the 3325 zone.
✅ EP1 (Pullback Buy) already triggered after price retested support.
📍 EP2 will activate on clean breakout + retest of 3330 zone.
🎯 Targets:
• TP1: 3348
• TP2: 3356–3360
If price loses 3325 structure, we reassess. For now, I’m bullish while structure holds.
This setup aligns 100% with the TCB Strategy:
Trend Phase: Bullish structure forming
Countertrend: Liquidity sweep + reclaim
Breakout Phase: Incoming on 3330 retest
🧠 Flow with structure, not emotion.
💬 Drop your comment if you're trading Gold too.
#TCBFlow #XAUUSD #GoldAnalysis #SmartMoney #BreakoutTrading #FlowWithTCB

Gold shortXau usd has been bullish all along for months if not years , however for every bullish run there's always a period of retracement when price fall a little sometimes 20 % to 50% of a bullish run .
Gold is creating a pullback , if you position well you can take advantage of this move before the bulls resumes again

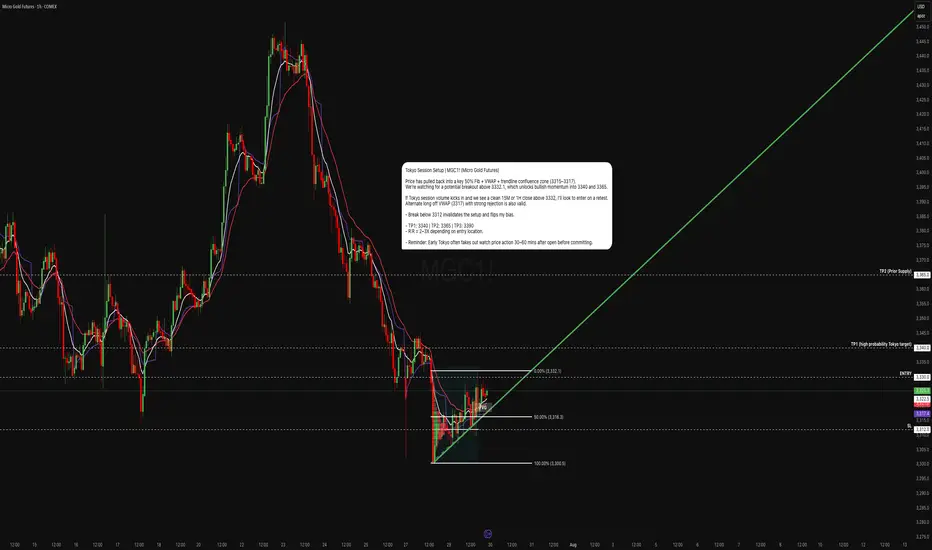
Gold’s in the Chop Shop. Tokyo’s Got the KeysGold has entered a key decision zone ahead of Tokyo. After a controlled retracement off the 3332 swing high, price has now compressed into a high-probability confluence pocket:
- 50% Fibonacci retracement (3316.3)
- VWAP acting as dynamic support (~3317)
- Trend line support holding from prior structure lows
- Compression below 3332.1 the breakout gate
If Tokyo volume engages, this could trigger a clean structural breakout into higher liquidity zones.
Primary Entry:
- Trigger: 15M or 1H candle close above 3332.1
- Entry Range: 3333.0 – 3334.5 on retest confirmation
- Stop Loss: 3312 (below trend line + VWAP)
Aggressive Entry (Mean Reversion):
- Bounce off VWAP/Fib zone (3316–3317.5) with bullish reaction
- Tighter SL: 3312–3314
- Lower R:R, but better pricing
Target Zones:
- TP1 3340 Minor resistance & round number
- TP2 3365 Prior breakdown zone / supply
- TP3 3390–3400 Extended Tokyo move + trend reversal territory
If I'm Wrong:
A breakdown below 3312 invalidates the bullish thesis. That would signal VWAP failure, trend line break, and potential reversion to 3300 or lower.
Technical Confluence Checklist:
- VWAP support holding - Complete
- 50% Fib bounce attempt - Complete
- EMAs compressing for potential crossover - Complete
- Clean trend line structure intact - Complete
- Low volume chop zone between 3312–3332 - Caution
Tokyo often fakes the initial move. Ideal trigger confirmation comes 30–60 mins after Tokyo open, once liquidity builds. Watch for manipulation wicks around VWAP before committing.
This is a classic quant compression setup, price is coiled into structure, and all major intraday tools align. If we see a clean move above 3332 with volume, the breakout could unfold fast. But lose VWAP and trend line, and the bias flips instantly.
Stay reactive, not predictive. Let price prove direction.
Lord Jesus Christ, Son of God, have mercy on us sinnersare you ready... ?
In the name of the Father, and of the Son, and of the Holy Spirit. Amen.
Glory to Thee, our God, glory to Thee.
O Heavenly King, O Comforter, the Spirit of Truth, who art in all places and fillest all things; Treasury of good things and Giver of life, come and dwell in us and cleanse us from every stain, and save our souls, O gracious Lord.
Holy God, Holy Mighty, Holy Immortal, have mercy on us.
Glory to the Father, and to the Son, and to the Holy Spirit: now and ever and unto ages of ages. Amen.
All-holy Trinity, have mercy on us. Lord, cleanse us from our sins. Master, pardon our iniquities. Holy God, visit and heal our infirmities for Thy name's sake.
Lord, have mercy.
Glory to the Father, and to the Son, and to the Holy Spirit: now and ever and unto ages of ages. Amen.
Our Father, who art in the heavens, hallowed be Thy name: Thy kingdom come; Thy will be done on earth, as it is in heaven. Give us this day our daily bread; and forgive us our trespasses, as we forgive those who trespass against us; and lead us not into temptation, but deliver us from the evil one.
For Thine is the kingdom, and the power, and the glory, of the Father, and of the Son, and of the Holy Spirit: now and ever and unto ages of ages. Amen.
In one, holy, catholic, and apostolic Church

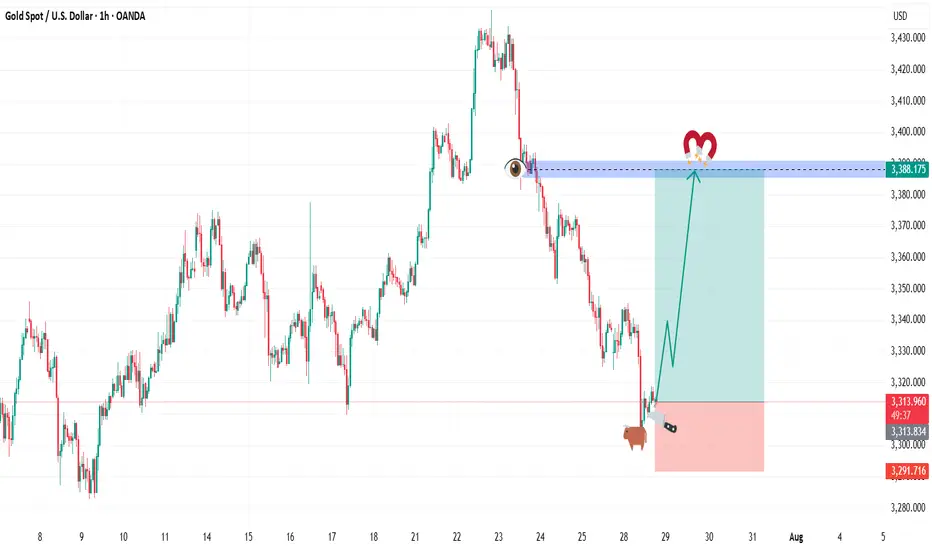
BUY GOLDIn todays session we are monitoring GOLD for buy opportunities. We have out entry at 3313.600 and stops below 3291 our target is at 3388.175 and higher. Use proper risk management. Cheers to you all.
Sell Analysis – 30M Smart Money Concept Sell Analysis – 30M Smart Money Concept
📊 Chart Context:
Timeframe: 30M
Market: Gold (XAUUSD)
Bias: Bearish – Scalp Sell
---
🔍 Key Observations:
Premium Zone Rejection:
Price tapped into a premium supply zone formed after a clear break of structure (BoS) to the downside. This confirms seller dominance at higher pricing levels.
FVG (Fair Value Gap) Fill:
The price filled a previous FVG imbalance and showed rejection without closing above the origin of the impulse. This shows liquidity grab behavior typical in smart money moves.
Bearish Order Block Confirmation:
A bearish OB was respected and reacted to. The latest candle shows strong rejection with a long upper wick and volume tapering — an early confirmation of potential entry trigger for scalp short.
---
🧨 Entry Strategy (Scalp Sell):
Entry Zone:
Inside the reaction to the OB and FVG (just below the premium zone)
✅ 3325 ~3330
Stop Loss:
Just above the last high or FVG origin
✅ 3340
Take Profit:
TP1: Towards the equilibrium of the recent impulse leg
✅ 3300
TP2: Below the discount zone, targeting liquidity under recent lows
✅ 3280
---
⚠️ Risk Note:
This is a scalping setup, not a swing trade. Higher timeframes still show mixed signals, so risk management is key. Avoid over-leveraging.
---
🏁 Summary:
> A high-probability scalp sell setup confirmed by smart money concepts: BOS → FVG Fill → OB Rejection → Liquidity Grab → Bearish Continuation.

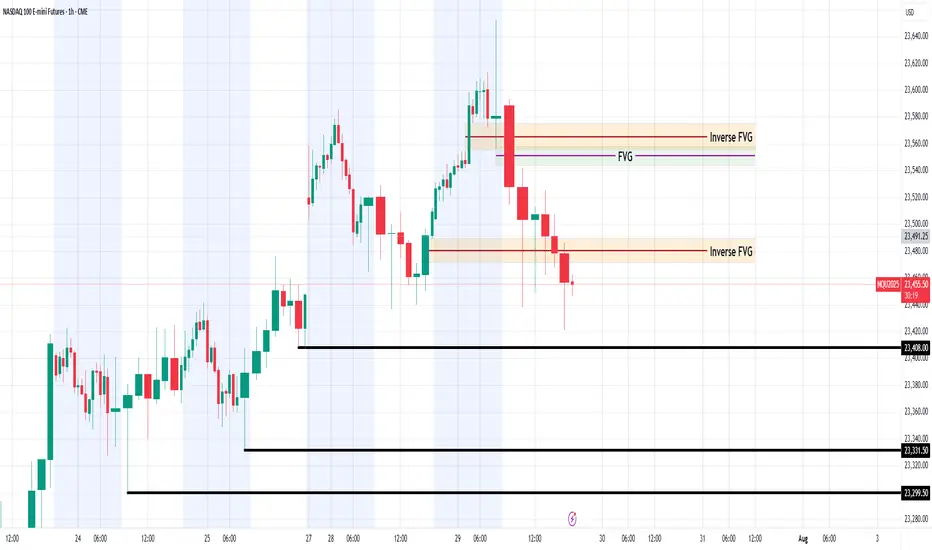
#Nasdaq - #/NQ - #ICT Model AnalysisBased on my analysis, #NQ is likely to raid one of the liquidity lines below before initiating a rally toward one of the FVGs or inverse FVGs above. This move may serve as an accumulation before a potential sell-off begins.
Do your diligence and study more; technical analysis is just the probabilities overview.
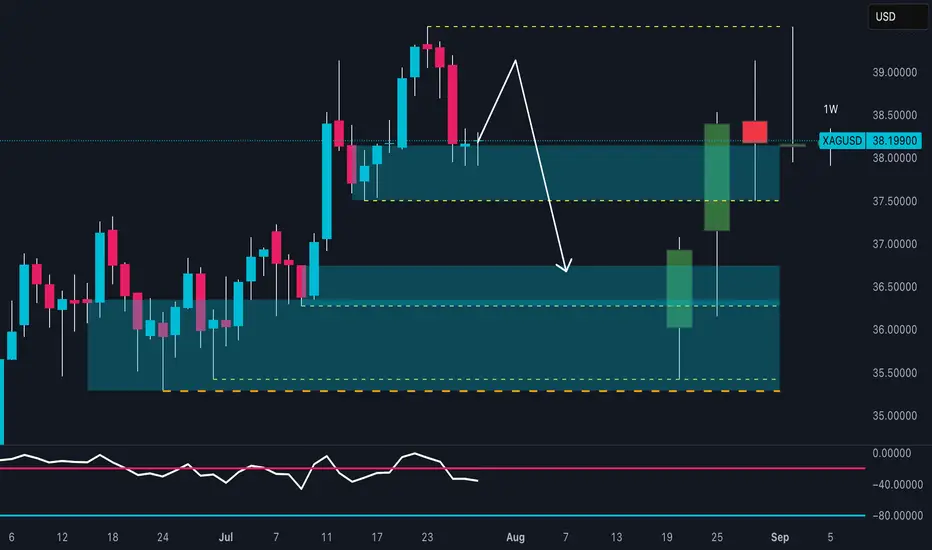
SILVER Is About to Collapse? Watch This Critical Supply Zone!Price recently tapped a high near 39.20 before sharply rejecting from the 38.80–39.20 supply zone, confirming strong selling pressure. The current structure shows:
- Supply zone tested and rejected
- Likely return to the previous demand zone (36.50–36.00)
- RSI is turning down, confirming loss of momentum
A pullback toward 38.30–38.50, followed by a bearish continuation toward the 36.50 area, which acts as a key structural and institutional support.
🗓️ Seasonality
Historically, July is bullish for silver:
Last 5Y average: +0.89%
Last 2Y average: +2.18%
However, August–September are bearish months:
August: mildly positive, but weak
September: consistently negative across all time frames (-0.86% to -1.10%)
This increases the probability of a downward move starting in early August, in line with current price action rejection.
🪙 Commitment of Traders (COT) – July 22
Non-Commercials (speculators):
Longs: +656
Shorts: -516
Commercials (hedging):
Longs: +1,337
Shorts: +916
➡️ Commercials are increasing both long and short exposure, while non-commercials remain net long — a sign of moderate optimism.
However, long positioning is slowing down compared to previous weeks. A potential exhaustion in bullish momentum is forming.
📉 Sentiment
52% short vs 48% long
Volume: more lots on the short side (492 vs 454)
Sentiment remains neutral to slightly contrarian bullish, but not extreme. This may allow for a fake breakout before a deeper move down.
🧩 Operational Summary
Main bias: Bearish short to mid-term (starting August), supported by:
- Technical rejection at supply
- Negative seasonal tendencies ahead
- RSI showing momentum loss
- COT showing stabilization, not accumulation
XAUUSD Monthly Technical OutlookMarket Structure Overview:
• The chart reveals consistent Breaks of Structure (BOS) to the upside, confirming a strong bullish market trend.
• Price has successfully reclaimed and retested the strong resistance zone (~3390–3400), which now acts as new support.
• A series of higher highs and higher lows show clear bullish intent, supported by sustained bullish momentum after each correction.
⸻
📈 Volume & Price Action:
• The Volume Profile (VRVP) on the left shows strong historical accumulation near the current breakout zone.
• After the breakout from resistance, the price retested this zone—validating it as support—and is expected to continue its bullish leg toward $3,500, the next psychological and technical target.
⸻
📍 Key Levels:
• Support Zone: $3,375 – $3,390 (previous resistance turned support)
• Immediate Resistance: $3,425
• Target Level: $3,500 (Monthly High Projection)
⸻
📘 Educational Note:
• This setup aligns with classic market structure theory: BOS + Retest + Continuation.
• The pullback into the breakout zone is a textbook bullish continuation signal often used in institutional trading strategies.
• Traders watching this pattern should combine it with confirmation entries such as bullish engulfing candles, FVGs, or order block rejections for safer entries.
⸻
🎯 Projection:
• As long as the price holds above $3,375, the bullish scenario toward $3,500 remains valid.
• Expect possible consolidation or minor pullbacks before continuation.
⸻
📌 Disclaimer:
This analysis is for educational purposes only and does not constitute financial advice. Always do your own research before entering the market.

07/29/25 Trade Journal, and ES_F Stock Market analysis EOD accountability report: +734
Sleep: 5 hours
Overall health: Been struggling with sleep due to heat waves
VX Algo System Signals from (9:30am to 2pm)
— 8:00 AM Market Structure flipped bearish✅
— 9:30 AM VXAlgo NQ X3 Buy Signal✅
— 9:36 AM Market Structure flipped bullish on VX Algo X3! ❌
— 11:49 AM VXAlgo ES X1 Buy signal✅
— 11:59 AM VXAlgo NQ X1 Buy Signal❌
What’s are some news or takeaway from today? and What major news or event impacted the market today?
Today was one of the few short the resistance day and refreshing to see after we been grinding ATH (all time highs)
News
— 1:30 PM
🇺🇸🇨🇳 *CHINA SAYS IT AGREES WITH US TO EXTEND TARIFF TRUCE
What are the critical support levels to watch?
--> Above 6395= Bullish, Under 6374= Bearish

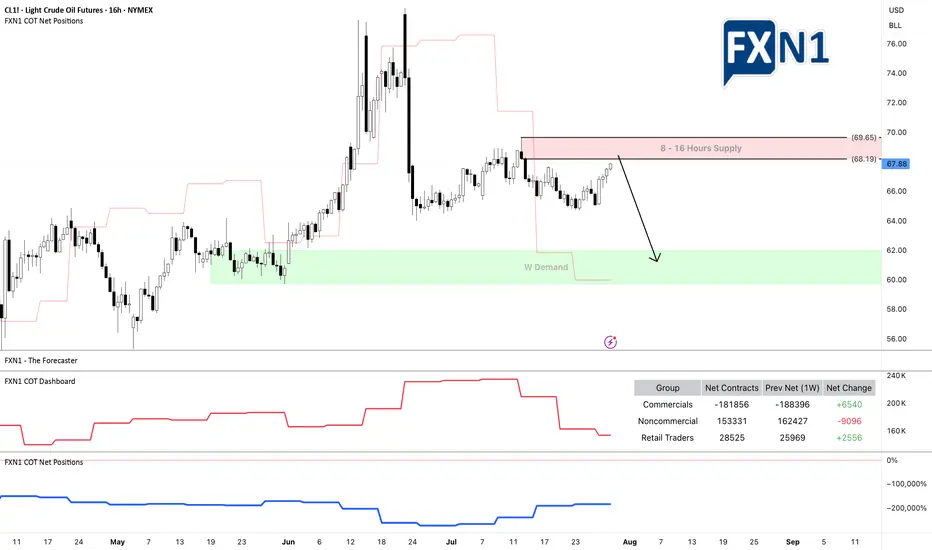
Oil Market Sentiment Shifts After Trump’s Urgent Warning, but...On June 23, 2025, at 9:35 AM, President Donald J. Trump issued a stark warning via social media:
"EVERYONE, KEEP OIL PRICES DOWN. I’M WATCHING! YOU’RE PLAYING RIGHT INTO THE HANDS OF THE ENEMY. DON’T DO IT!"
Since his post, oil prices experienced a notable bullish impulse. From both fundamental and technical perspectives, the market is now approaching a 16-hour supply zone, which could serve as a potential resistance area.
Additionally, I’ve observed a divergence in trader positioning: non-commercial traders increased their short positions significantly last week, while retail traders remain long. This divergence between price action and non-commercial positions suggests a possible shift in momentum, and I am currently eyeing a short setup.
As always, I encourage traders to conduct their own analysis. The trader featured below operates on the D1 timeframe and focuses on scalping, which can be useful for short-term entries.
Stay cautious and keep an eye on how the market reacts near the identified supply zone.
✅ Please share your thoughts about CL1! in the comments section below and HIT LIKE if you appreciate my analysis. Don't forget to FOLLOW ME; you will help us a lot with this small contribution.
XAUUSD Technical Analysis – Strong Bullish Move Expected XAUUSD Technical Analysis – Strong Bullish Move Expected from Support Zone
Date: July 29, 2025
Chart Type: Price Action | Smart Money Concept (SMC) | Volume Profile
🧠 Educational Breakdown:
1. Strong Support Zone (Demand Area):
Price has entered a clearly marked strong support zone around $3,270 - $3,292.
This zone has previously acted as a major demand level, where buyers stepped in to reverse bearish pressure.
High volume node from the Volume Profile on the left confirms significant historical interest in this price region.
2. BOS – Break of Structure:
Multiple Break of Structures (BOS) throughout the uptrend confirm bullish market intent.
The recent decline appears corrective, not impulsive, suggesting a potential bullish continuation.
3. Bullish Fair Value Gap (FVG):
A Bullish FVG is visible just above current price, acting as a magnet for price action.
This imbalance is often targeted before further market movement, supporting the idea of an upcoming bullish move.
4. Liquidity Grab Setup:
Price dipped into the support area likely to sweep liquidity (stop losses) before a reversal.
This is a common Smart Money trap, where institutional players grab liquidity before moving the market in the intended direction.
5. Target Zone:
A clear target is set around $3,418, aligning with previous highs and potential Buy-Side Liquidity.
The projected move represents a clean higher high, following the higher low formed at the support zone.
Confirmation: Wait for bullish engulfing or displacement candle on lower timeframe (M15-H1).
Volume Support: Look for rising volume during the reversal to confirm smart money participation.
📘 Conclusion:
Gold (XAUUSD) is showing a textbook bullish reversal setup from a high-demand zone. With strong structural support, fair value gap targeting, and buy-side liquidity above, the setup favors bullish continuation toward $3,418.

XAUUSD Short1. Market Structure Overview
The overall market structure on this 15-minute chart is bearish. A clear Break of Structure (BOS) occurred at $3,307.765, confirming that previous support failed and sellers are in control. After the BOS, price formed a lower high near $3,328, maintaining bearish momentum and setting the stage for potential continuation downward.
2. Supply & Demand Zones
The chart reveals two notable supply zones where sellers have been active. The first is a minor zone just above the current price, which has already triggered a rejection and shows signs of short-term bearish control. The second, positioned higher, marks the origin of a strong sell-off and represents a significant resistance level. On the demand side, the closest support zone lies just beneath the current price, but it appears weak due to prior tests. A stronger demand zone is located further down, where price previously saw an aggressive bullish reaction, indicating solid buyer interest. If bearish momentum continues, price may drop even lower into a deeper liquidity pocket—an area likely to attract strong institutional buying.
3. Price Action within the Current Region
Price is currently hovering around $3,325, inside a narrow range between the minor supply and weak local demand. After rejecting the upper supply zone, price is showing bearish intent. If the market maintains this rejection pattern, a drop toward the $3,293–$3,301 demand area is likely. This zone is expected to offer a bounce or at least temporary reaction due to the strong response seen there previously.
4. Trade Bias & Plan
The active bias is bearish. Short opportunities are favored while price remains below $3,328. Ideal short entries are from the rejection of the minor supply zone, targeting $3,301 and possibly $3,293. A clear break and hold above $3,329 would invalidate the short bias and shift focus toward higher liquidity levels. Until then, structure supports downside continuation.
5. Momentum & Confirmation
Momentum is currently favoring sellers. The lower highs and strong rejections near supply reinforce the bearish bias. Confirmation for continuation comes from bearish engulfing candles and sharp rejections from supply zones. A clean break below the nearest demand zone would further validate the move toward deeper targets.

Xausd techinical analysis.Xausd techinical analysis next move posibale at h1 time frame not finchinal advice.

GOLD XAUUSD Gold moving as expected respecting our price and entries, will look for swinging opportunities ,and SL adjustments to BE

Gold Buy SetupHi everyone
Hope you all had a good trading week so far, this is our buy setup we looking to see for Wednesday
Let us know in the comments what you think.
