GOLD - One n Single Area, what's next??#GOLD... market just reached at his ultimate area as we discussed in our last week analysis and in Friday analysis as well.
The area is 3309-10
Keep close and don't be lazy here.
NOTE: we will go for cut n reverse below 3309 in confirmation.
Good luck
Trade wisley
Futures market
Please check how to trade later.Since the release of the trading strategy, I have been able to accurately predict market trends. I am also grateful to so many brothers for following me. My premium privileges are about to expire. I will put the subsequent trading content in the group. If any brothers are interested, they can find me through 🌐. As for how to deal with the future market, I have stated the extraordinary situation and will patiently wait for the rebound of gold. At the same time, I will pay attention to the impact of the Sino-US trade talks.
XAUUSD is still bearish Gold is currently below rising channel and holding the Range of 3320-3335,although yesterday implusive drop is incompleted without testing 3290-3280
What's possible scanarios we have?
▪️I'm still on bearish side till 3345 is invalidated and candle flips above. I open sell trades at 3332 again and holds it .
if H4 & H1 candle close above 3345 I will not hold or renter sell.
▪️Secondly if H4 candle closing above 3345 this down move will be invalid and Price-action will reached 3370.
technical analysis- (xau-usd) (H1)This chart highlights a large symmetrical triangle formation, with an internal WXYXZ corrective structure blended with impulsive Elliott Waves (1)-(5). The price action is marked by key structural shifts: CHoCH, BOS, and EOH, signaling trend reversals and liquidity grabs.
📌 Price recently bounced off the ascending trendline, forming a potential wave (2) low, suggesting a bullish move into a wave (3) impulse.
🔼 Short-term target points to a revisit of the strong resistance zone around 3,400–3,410.
📊 Key Setup:
• Pattern: Symmetrical Triangle
• Wave Count: Corrective WXYXZ + impulsive structure in progress
• Signals: Bullish CHoCH + BOS confirmation
🎯 Trade Idea:
• ✅ Direction: BUY
• 🎯 Take Profit (TP): 3,400 – 3,410
• 🔻 Stop Loss (SL): 3,296
🔁 Sideways range compression sets up ideal conditions for short-term swing or breakout scalps.


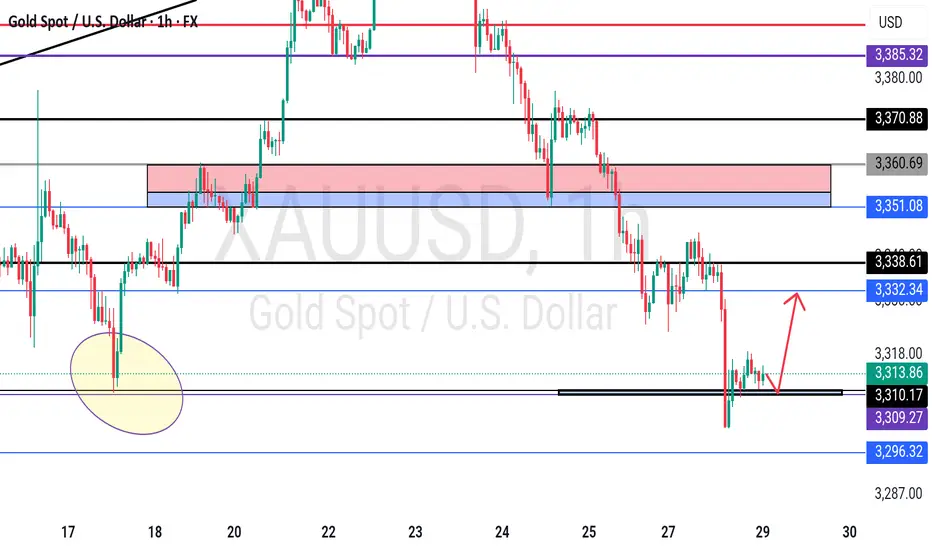
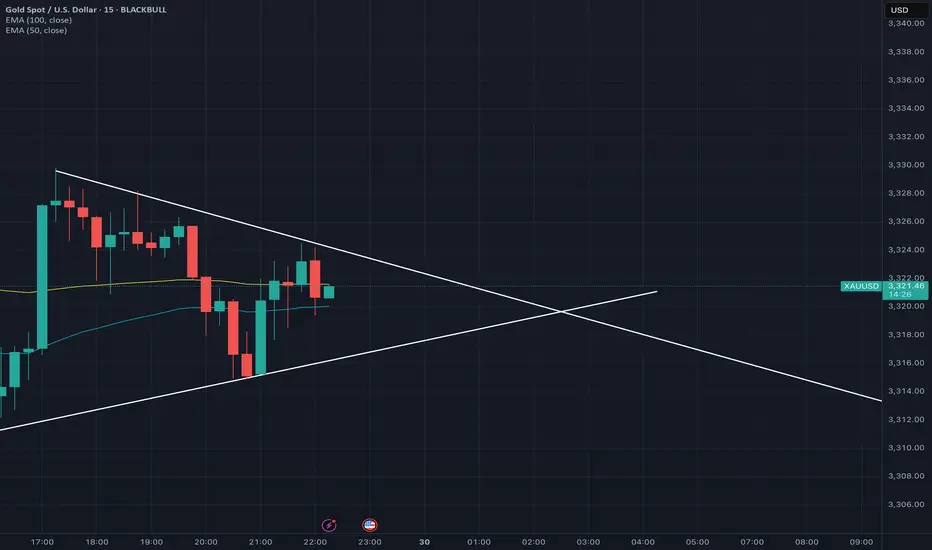
Bottoming out? Be wary of the market.After a sharp drop to around 3300 on Monday, gold rebounded, reaching a high of around 3330 so far.
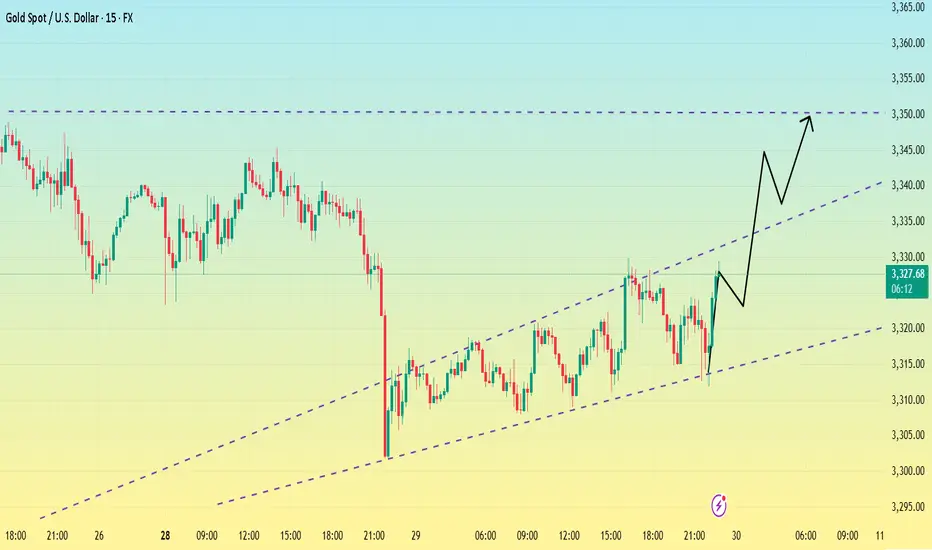
From the 1-hour chart,Gold has now broken out and stabilized within the hourly chart's downward trend channel. The key upward level is currently around 3330. If it breaks above 3330 again, caution is advised; it may test 3345-3350. Conversely, if it fails to break above 3330, gold may consolidate between 3300-3330 before the non-farm payrolls release.
From a short-term 15-minute perspective, the current 15-minute range has been broken out and stabilized. The current situation is unfavorable for bears. Based on the trend, a breakout above the 15-minute range would indicate a rebound. However, until 3330 holds, the 3320-3330 range is the only option. However, the current trend favors a bullish pullback, so I'm not too keen on shorting. Therefore, focus on support at 3320.
If it fails to break below 3320, enter a long position near 3320. The upper target is the top of the 3345-3350 range.
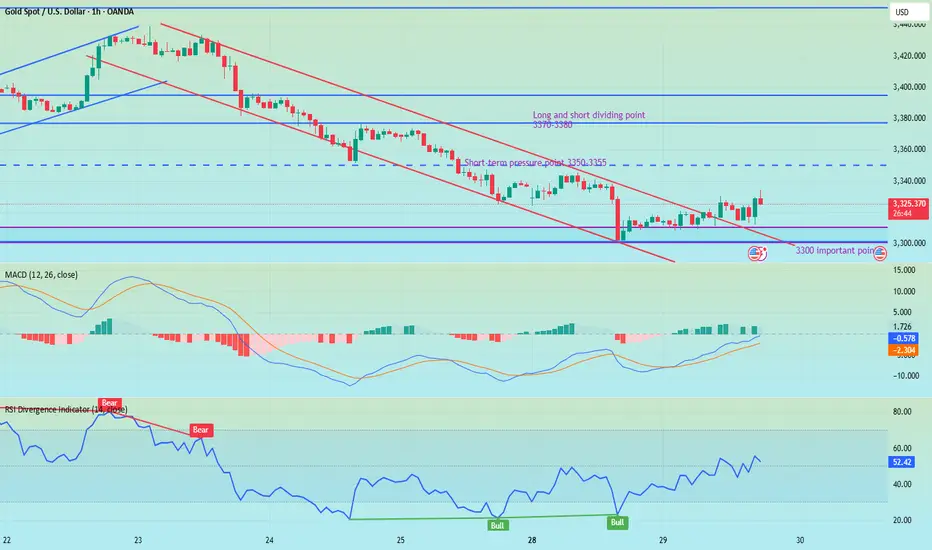
European session under pressure 3321 continue to shortI reminded everyone last night that if gold holds the 3300 mark, it will consolidate in the 3300-3345 range in the short term. The current gold price basically fluctuates narrowly between 3320-3310. Judging from the daily chart, the short-term upper pressure is at 3330. Only if the daily line stands firmly above 3330, there is a possibility of a rebound upward in the short term. Judging from the hourly chart, gold is still in a downward trend, and the hourly line is blocked near 3321. In the short term, if it cannot break through 3320-3330, gold will continue to fall. You can consider shorting, with the target at 3310-3300. If the European session is still volatile, maintain high shorts and low longs to participate in the cycle.
My premium privileges are about to expire, and subsequent trading strategies and analysis will be published in the group.

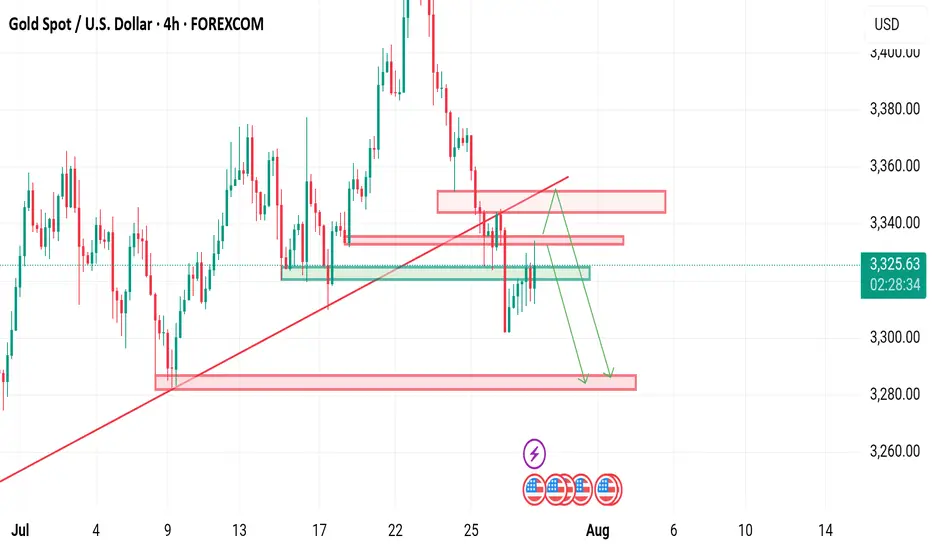
XAUUSD – Bears in Control, but Watch for a Rebound FirstYesterday, after a small bounce from the ascending trendline, Gold broke down and printed an intraday low around $3300.
Right now, the market appears bear-dominated, and further downside continuation is likely in the coming days.
________________________________________
📉 But there’s a catch:
From last week's top, Gold has dropped over 1400 pips without any meaningful correction.
That opens the door for a possible short-term rebound, which could be just a setup for new short entries.
________________________________________
📌 Key levels to watch:
• First resistance: $3350
• Major resistance: $3375 – Only a daily close above this level would shift control back to the bulls
🎯 Until then, any bounce is an opportunity to sell into strength.
A break below $3300 opens the path to $3280, with a likely extension toward $3250.
________________________________________
Conclusion:
The trend is bearish, but don’t chase.
Wait for a corrective rally, then look to sell the rip—unless bulls reclaim $3375, it’s still a bear market.
Let’s see if Gold gives us the setup. 🎯
Disclosure: I am part of TradeNation's Influencer program and receive a monthly fee for using their TradingView charts in my analyses and educational articles.

XAU / USD 1 Hour ChartHello traders. Taking a look at the hourly chart, it's kind of ugly. Smart trades would wait until we get out of all this cluster. Saying that, I have marked some potential scalp trade set ups for either buy or sells trades. This is just an idea, not trading advice. I am not trading as of now, I would rather wait for a better set up. For people who are more risk takers, there are plenty of trades out there, but for me, I am just monitoring for the best trade set up to ensure a good win. Big G gets my thanks. Let's see how the next 30 min. candle and hourly close. Be well an trade the trend. Happy Tuesday.

Analysis on the 10 Elite PairsYou can follow us for more Analysis(Images and Videos) with Precise definition of the Financial Market.ENJOY!!!

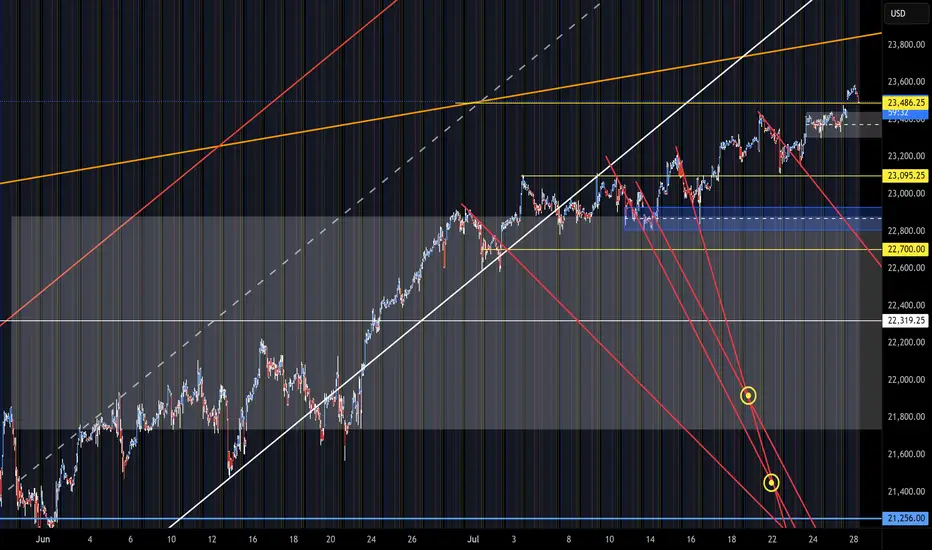
Analysis on S50 Futures: Still bullish but.. (cont.)Dear All
Now it reached 807 as the first target for fibo, you should be cautious already ,
the prob of going down increase after reaching the first target.
if i have to be biased, it is gonna keep pushing up to 840, 930 as next target.
As long as 773 holds, the long term view is upward and the targets are valid.
will keep you updated .
Trader PP

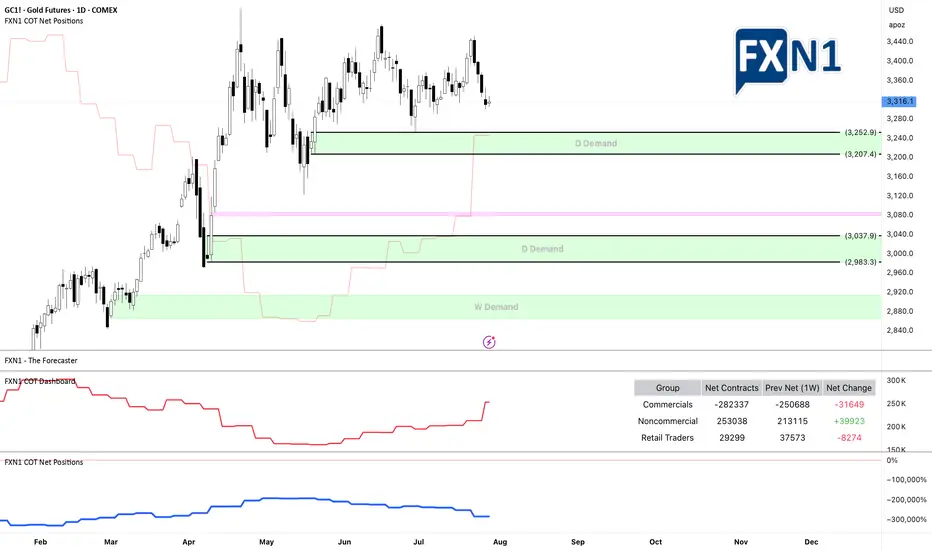
Gold Price Analysis (GC1! or XAU/USD): Challenges and OutlookSince reaching a historic high of $3,509 on April 22, 2025, gold has struggled to maintain its upward momentum. On the daily timeframe, the price experienced a sharp rejection spike after touching that peak, prompting a sideways range as the market seeks a clearer direction.
From a technical perspective, a stronger US dollar typically puts downward pressure on gold, making it a more expensive investment for holders. However, examining the chart of GC1! * alongside the DXY shows that even during periods of a robust dollar, gold has continued to rise. Additionally, recent years have seen seasonality effects on gold largely ignored, with the yellow metal persistently climbing. The underlying reasons are multifaceted, but a key factor is gold’s status as a safe-haven asset—investors prefer to hold gold during times of uncertainty and economic turmoil.
* GOLD and DXY correlation
Looking ahead, investors are awaiting the Federal Reserve’s upcoming monetary policy announcement scheduled for Wednesday. According to the CME FedWatch tool, the consensus is that the Fed will keep interest rates steady at 4.25%-4.50%, marking the fifth consecutive meeting with unchanged rates.
From both fundamental and technical viewpoints, recent data suggest a cautious outlook. Notably, non-commercial traders added nearly 40,000 long contracts last week, indicating bullish sentiment. Conversely, retail traders have reduced their positions, which could signal a potential shift in market dynamics.
The key question remains: where might be a strategic entry point if gold resumes its upward trend?
In the chart, I’ve highlighted two daily demand zones and a strong weekly demand area. There’s a possibility that the price may not revisit the weekly demand zone to accommodate new longs, instead triggering entry signals from one of the daily demand zones. I recommend adding these zones to your watchlist as potential entry points.
What are your thoughts? I look forward to your insights!
✅ Please share your thoughts about GC1! in the comments section below and HIT LIKE if you appreciate my analysis. Don't forget to FOLLOW ME; you will help us a lot with this small contribution.
Gold Market Outlook – 1H ChartGold (XAU/USD) continues to show bearish momentum with lower highs and consistent structural breakdowns. Price is currently consolidating just above a key support zone (~3315), forming a descending triangle pattern — often a bearish continuation signal.
If the support breaks, the next liquidity zones lie around 3270–3250, with a deeper target near 3225, as highlighted by the green demand areas. Fundamental catalysts ahead (as shown by US economic events) could act as triggers.

NQ Short (07-28-25)The F-M Long Rig is active with a Gap Up and Pump/Dump play. Just notice KL 486 and how/when the NAZ gets above. In O/N, the Reg Session and previous hits at 23,440 got rejected and is why you are seeing the move in the off session. The BTD/FOMO chase is active, Pump/Dump near Open today for next move.
Silver market's ambiguityFollowing up my last idea - you can see short term time frame (15m) shows alot of ambiguity in the direction it wants to go... Again, just watching for now - but a breakdown could mean low $37s briefly, imo.

Is Gold having Correction before dumping?It's a pretty hot topic at the moment where the Gold is moving toward and what it will eventually become... Side way wedge like this. what do you think?
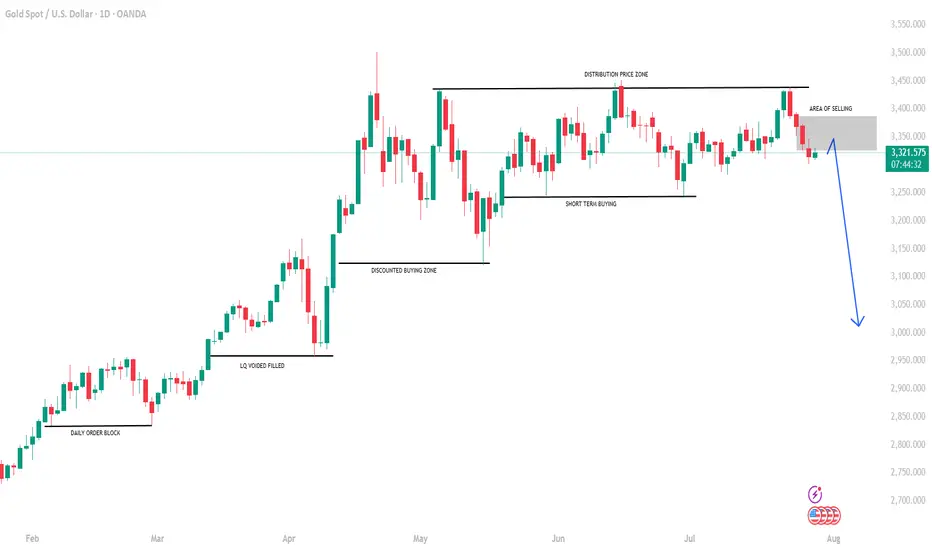
GOLD: Time for massive drop? +3000 pips move! Gold has failed to breakthrough the previous resistance indicating a strong sellers hold around $3440 region. Now since the price has stared dropping we can see it dropping around $2800 in long term. In order for this to happen we need strong confirmation, which will help us understand the possible volume.
Agree with our idea?
Like and comment!

XAUUSDDaily still on a uptrend.
Major player are on vacations ...
H4 its on a consolidation
Advice: Wait

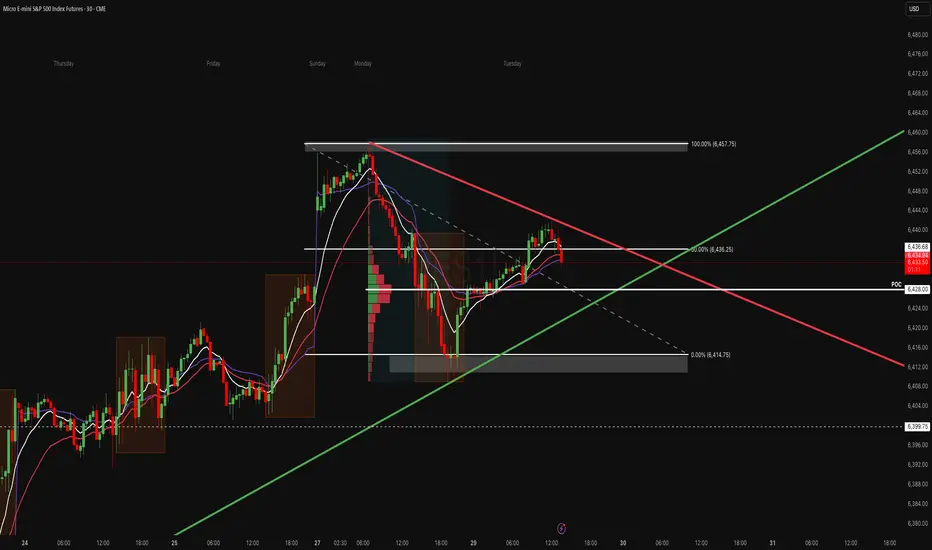
POC Pressure Cooker – MES Prepares for VolatilityWe’re heading into the NY session with MES balancing between key levels. The 50% retracement of the recent range (6436) is acting as a pivot, while the POC at 6428 is the immediate area of interest. The structure is tight here’s both sides of the play:
Key Levels to Watch:
- Upper Range: 6457–6460 (recent swing high)
- Mid-Range Pivot: 6436 (Fib 50%)
- POC & Support Zone: 6428 (volume shelf)
- Lower Range: 6415 → 6400
🟩 Bullish Scenario
A breakout and hold above 6440–6445 could lead to a retest of 6457–6460, with potential continuation to 6470+ if momentum accelerates.
- Confluence: Higher low structure above 6428, EMAs curling up, and price reacting positively to POC.
- Invalidation: Clean break and close below 6428.
🟥 Bearish Scenario
A failure to hold 6430 and a push through 6428 (POC) could see sellers target 6415, then possibly 6400.
- Confluence: Descending red trend line still capping price, and VWAP rejections could support a downside move.
- Invalidation: Break above 6457 with strong buyer aggression.
Staakd Notes:
This is a range-play environment. The real edge is in waiting for a break + retest of 6440 or 6428 to confirm direction. NY open volatility is likely to provide a fake out before the true move. Give it 30 mins from open.
Closing Line:
“Price is coiled between POC and the 50% mark. We’ll let NY open show its hand then react, not predict.”
gold in retracement gold in retracement and will find a strong resistance to continue its downtrend there after.

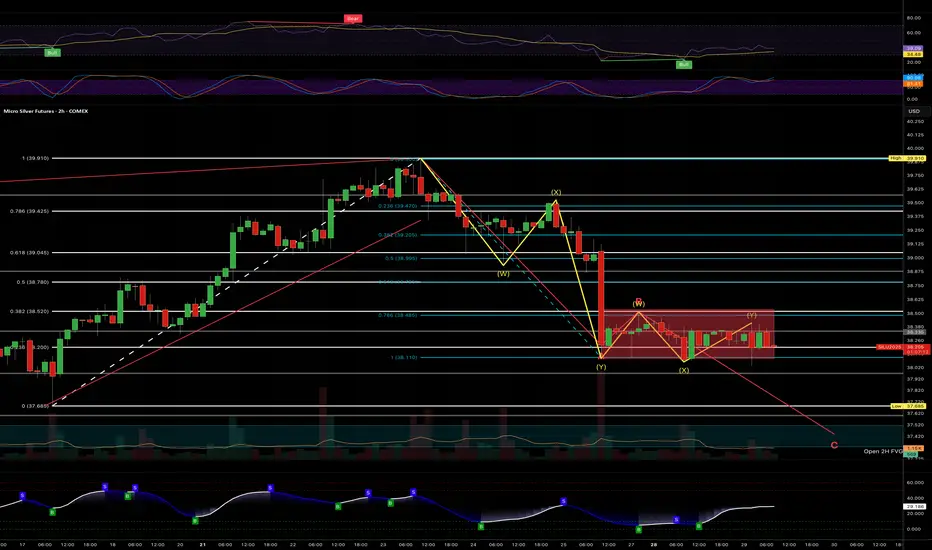
Silver - failure to break highs yesterday...This week is news packed... I was hoping to see Silver break above recently lower highs.
I am out of all positions - but I would not be surprised to see further breakdown in a second corrective leg, finding support at the FVG above next fib retracement.
Like I said, though, this week has alot of material news - so its all games... Will have to watch price action to make a determination of which direction I'll play.
I am very bullish on Silver over next 12 months - but next 12 days??? We'll see.
Today's Gold Price: Short at HighsToday's Gold Price: Short at Highs
As shown in the chart:
Rebound Short Strategy
Resistance: 3330-3350
Support: 3310
Technical Analysis:
1: As long as the gold price is below 3330, the market is bearish.
2: As long as the gold price is below 3350, the market is short.
3: As long as the gold price is above 3300, the long position is to buy on dips.
Specific Strategy:
Aggressive Strategy:
Sell: 3325-3330
Stop Loss: 3335
Target Price: 3310
Conservative Strategy:
Sell: 3340-3350
Stop Loss: 3355
Target Price: 3330-3310
Bottom Picking Strategy:
Buy: 3300-3310
Stop Loss: 3290
Target Price: 3350+/3400+
