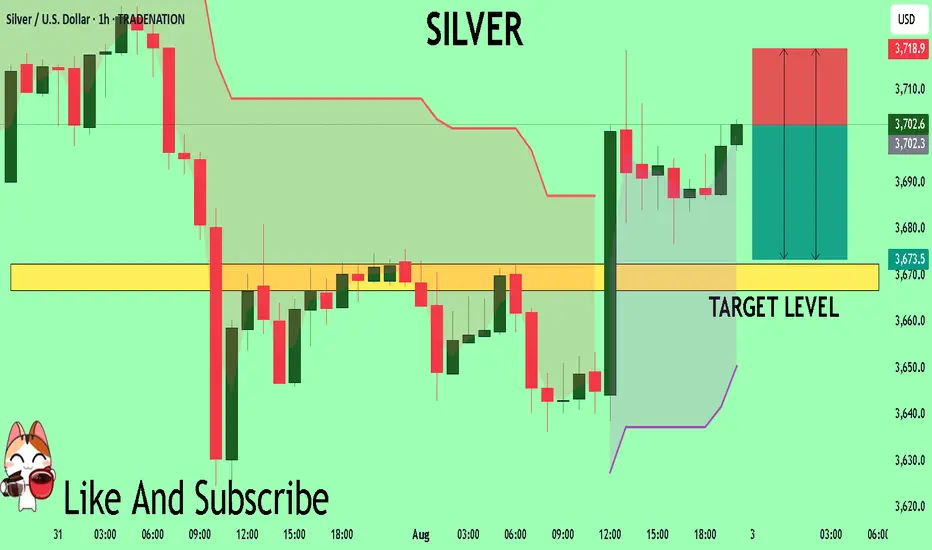
SILVER My Opinion! SELL!
My dear friends,
Please, find my technical outlook for SILVER below:
The price is coiling around a solid key level - 37.026
Bias - Bearish
Technical Indicators: Pivot Points Low anticipates a potential price reversal.
Super trend shows a clear sell, giving a perfect indicators' convergence.
Goal - 36.725
Safe Stop Loss - 37.189
About Used Indicators:
The pivot point itself is simply the average of the high, low and closing prices from the previous trading day.
Disclosure: I am part of Trade Nation's Influencer program and receive a monthly fee for using their TradingView charts in my analysis.
———————————
WISH YOU ALL LUCK
Futures market
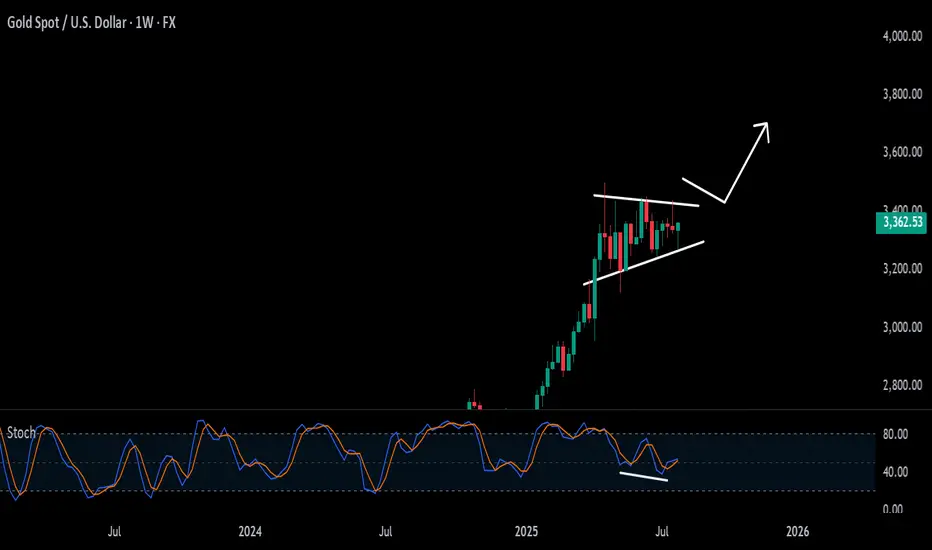
Gold ready to create new all time high!!!Buy: $3447.28
Set up: wait for a breakout and hidden bullish divergence on a weekly basis.
Sl: $3183.11
Final Plan with liquidities for Aug 4 onwardsAs after marking liquidities we can assume that Plan B will be more better for AUG 4 onwards trading.
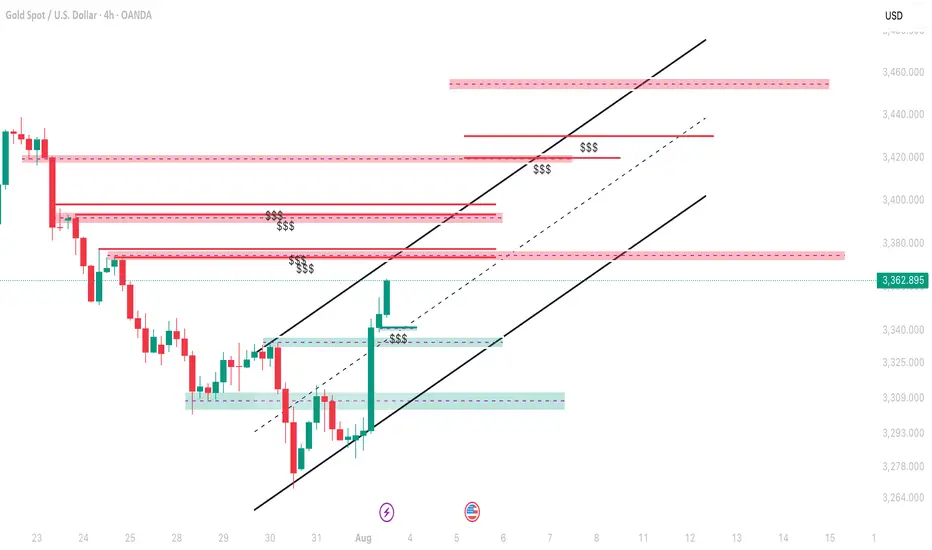
XAUUSD Weekly Outlook – August 4–8, 2025
The question isn’t whether gold is strong. The question is — will price expand, or rebalance?
🔸 Macro Overview
Gold begins the week consolidating just below its final HTF supply zone (3439), while USD weakens amid mixed macro data and growing speculation of future rate cuts. Markets await fresh catalysts, and gold’s recent impulsive rally is now facing the big test: break the wick, or pull back?
🔸 Weekly Structure & Bias
Element Observation
🔹 Trend Bullish continuation — clean structure
🔹 Last BOS March 2025 — impulsive, with imbalance below
🔹 Price Action Top wick rejection forming near 3439
🔹 Bias Still bullish, but entering exhaustion zone
🔹 RSI Above 70 — overheated
🔹 EMAs EMA5 > EMA21 > EMA50 > EMA100 — perfect trend
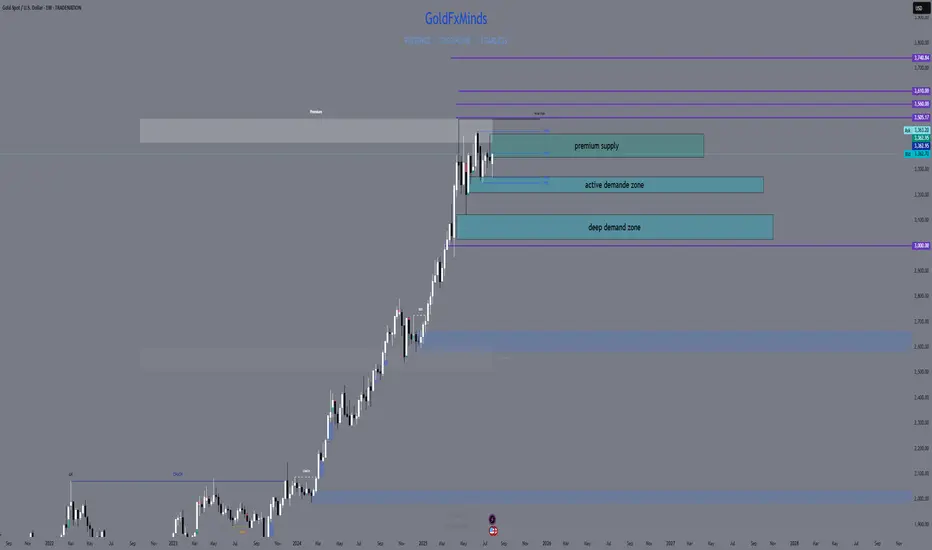
🔸 Key Weekly Levels (Zones + Confluences)
Zone Type Price Range Confluences
🔴 Supply 3350 – 3439 HTF wick supply + FVG + RSI 70+ + liquidity trap
🔵 Demand 3270 – 3215 Weekly OB + FVG + EMA21 support
🔵 Demand 3120 – 3070 Old BOS + deep FVG + psychological level
🟢 Support 3000 zone EMA50 + historical consolidation
🔸 Fibonacci Extensions (Above 3439)
Extension Level Price Target Confluences
1.0 (Swing Full) 3439 Supply wick high
1.272 3505 Next psychological milestone
1.414 3560 Mid-extension + liquidity
1.618 3610 Golden expansion target
2.0 3740 Full trend extension (max)
🔺 These levels serve as potential breakout targets ONLY if we get a confirmed weekly close above 3439 with clean BOS on LTF.
🔸 Weekly Scenarios
🟢 Scenario 1 – Break and Expand
If gold breaks 3439:
Expect clean continuation to 3505 → 3560 → 3610
Best entries come from new OBs on H4/D1 around 3350–3370
Follow momentum — but don’t chase without retrace confirmation
🔻 Scenario 2 – Rejection + Retracement
If price holds below:
Pullback toward 3270 – 3215 expected
EMA21 acts as dynamic support
If selloff gains strength, next demand = 3120 – 3070
🎯 This zone aligns with macro OB + re-entry for long-term bulls.
🔸 Conclusion & Gameplan
Gold is pressing against its final weekly ceiling.
Structure remains bullish, but every sniper knows — at the edge of premium, timing is everything.
✅ Above 3439 → expansion opens to 3505 → 3560 → 3610
🟦 Below 3439 → retracement into 3270 → 3215 → 3070
The best setups will be born from confirmation, not prediction. Let the market decide.
—
What would you do if 3439 rejects hard this week?
Comment your plan, tag your sniper level, and let’s stay ahead together 💬
—
With clarity, confidence, and perfect timing,
GoldFxMinds 💙
Disclosure: Analysis based on Trade Nation (TradingView) chart feed.
STRONG BUY | PALLADIUM Strategy: Impulse Correction
Direction: Bullish
Moving Average: Blue above Red
Fib Retracement: 38.2 reached
MACD > 0
Support : Finding additional confluence, as the weekly bounces off a massive support structure
1st Target = 1336
2nd Target = 1419
3rd Target = 1527
Lots: 0.2 (Plan to pyramid into this one)
RISK: Tariff Wars continue to hamper global growth as supply chains feel the brunt of the disruption.
Trade 4/20

Silver against many world M2 supplies.Here we see silver divided by many global m2 supplies...
We can see silver is JUST STARTING ITS MOVE to catch up to gold.
We corrected for the 1.4 quadrillion in M2, and see silver's targets all over $100!
This confirms silver is ready to move again, after gold's run, and perhaps make an explosive move higher!

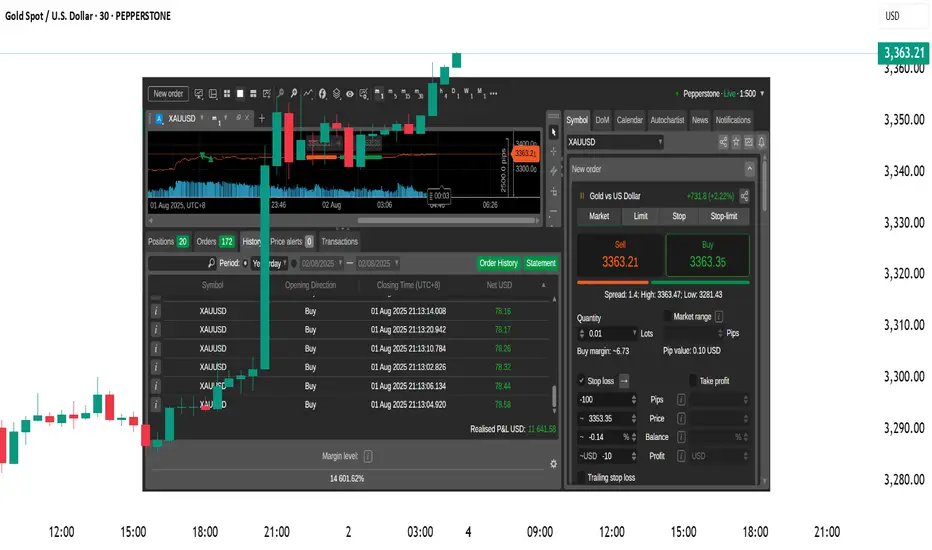
XAUUSD Live Trade with 11,641 USD ProfitsI managed to ride the momentum last night on XAUUSD and made over 11,641 usd profit on a live trading account. Gold usually create a range. It will create a top and a bottom then it will spend most of its time inside that range. That is pretty much how XAUUSD moves. If you can identify the top and the bottom then you can short it from the top and do a long trade on the bottom. The price will just travel from bottom to top and top to bottom. You can scalp your way to profits on this move if you can time it properly. Once in a while, a break from the top or the bottom happens. This is where you switch from trading the range to trading breakouts.
When you trade breakouts, you must trade it with the knowledge that less than 15 percent of breakouts are successful. Failed breakouts are very common. You need to have some form of stoploss below your breakout levels. You will know that the breakout fails once your stoploss is hit. If the breakout is successful then ride it. Do not put some TP (target price or take profit price) rather just trail your profits. Move your stops a few pips behind the price. Just enough distance to let the price breathe. If the price reverses then it will hit your stops. If the breakout is strong then you will ride it for a while until it reverses.
It will form another top and bottom again and move inside that range. Switch your approach again in trading long trades near the bottom and short trades near the top.
Just remember to always have some stoploss on every trade and never try to predict what the market will do or how the price will move. Let the market do its thing and just react to its movements.
Goodluck on your trades.
xauusdxauusd Focus on red line
From the price level of 3368 and above, gold is expected to pull back at least until the Stochastic on the M30–H1 timeframes reaches oversold levels.
After that, a bullish continuation is likely, pushing the price up to around 3400.
This area will be a critical decision point — determining whether the market will continue its uptrend or reverse into a downtrend.
If the H4 chart prints a reversal candlestick pattern, it would indicate the beginning of a bearish trend, which could potentially lead to a downward movement of up to 20,000 points.

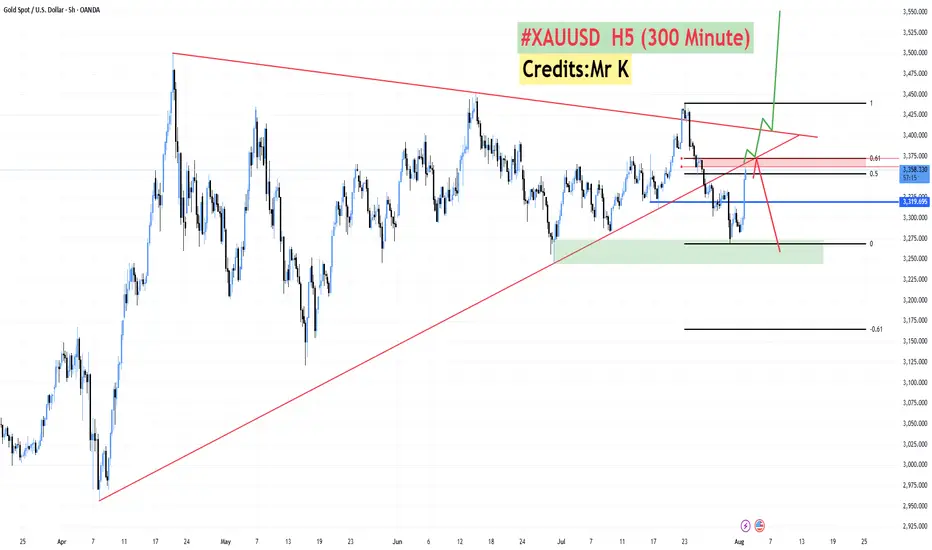
**#XAUUSD H5 Higher Timeframe Analysis**
📊 **#XAUUSD H5 Higher Timeframe Analysis**
What we witnessed today was a **tremendous recovery in Gold 🟡** after **3–4 consecutive bearish sessions 📉**.
📅 **Today’s candle** has **completely flipped the weekly structure**, turning a fully **bearish weekly candle into a bullish one 📈** — thanks to the **NFP data** that came in **favor of Gold and against the Dollar 💵❌**.
🔍 However, price is now approaching a **critical confluence zone**:
* 🧭 A **long-running trendline** (since April)
* 🔴 An **H4 Bearish Order Block**
* 📐 The **Fibonacci Golden Zone (0.50–0.618)** at **3362–3372**
📌 **From this level, we have two possible scenarios:**
1️⃣ **Sharp Rejection 🔻:**
Price may **reverse sharply** from the 3362–3372 zone and **resume the bearish trend**.
2️⃣ **Breakout & Trap Theory 🔺:**
If price **sustains above this zone**, it may signal that the recent **3–4 day drop was a fake breakdown**, designed to **trap sellers** and grab liquidity for a **further upside move**.
✅ **Confirmation will come if we get an H4–H6 bullish candle close above the trendline** and back inside the **buying zone of 3375–3390**.
🔓 **A breakout above the triangle pattern** will likely lead to a **strong bullish continuation 📈🚀**.
Natural Gas Rebounds from Key SupportNatural gas has bounced off its strong support level and is showing signs of upward movement, particularly evident on the hourly chart. Dips are being bought up, with the price quickly returning to previous levels.
Downsides: The downtrend is still in place (though it may potentially be broken), and there's a relatively long stop-loss below yesterday’s candle low at 2.98.
📝Trading Plan
Entry: buying gold at the current level
Stop Loss: 2.98
Target: 3.36, 3.62, and 4.20.

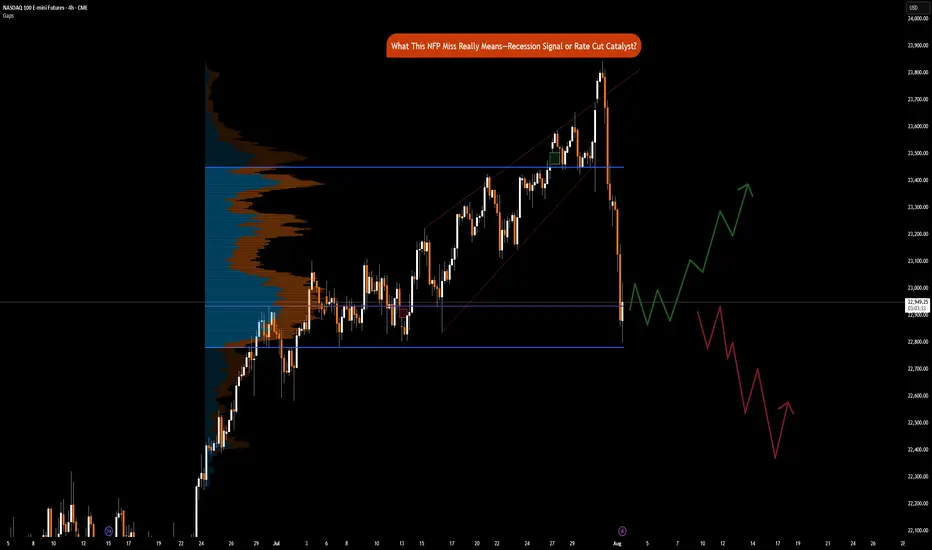
NFP Miss Implications: Recession Signal or Rate Cut CatalystCME_MINI:NQ1! CME_MINI:ES1! CME_MINI:MNQ1!
Happy Friday, folks!
Today is the first Friday of August, and that means the highly anticipated Non-Farm Payroll (NFP) numbers came in at 7.30 am CT.
US Non-Farm Payrolls (Jul) 73.0k vs. Exp. 110.0k (Prev. 147.0k, Rev. 14k); two-month net revisions: -258k (prev. +16k).
Other key labor market indicators were as follows:
• US Unemployment Rate (Jul) 4.2% vs. Exp. 4.2% (Prev. 4.1%)
• US Average Earnings MM (Jul) 0.3% vs. Exp. 0.3% (Prev. 0.2%)
• US Average Earnings YY (Jul) 3.9% vs. Exp. 3.8% (Prev. 3.7%, Rev. 3.8%)
• US Labor Force Particle (Jul) 62.2% (Prev. 62.3%)
Data and Key Events Recap:
What a year this week has been! It's been packed with high-impact economic data and pivotal central bank decisions, especially from the Federal Reserve. On top of that, trade and tariff announcements have dominated the headline.
U.S. economic data this week was broadly strong. Second-quarter GDP came in at 3.0%, beating expectations and signaling solid growth. The ADP employment report also surprised to the upside, printing 104K vs. the 77K forecast. Consumer confidence showed resilience as well, with the Conference Board’s reading rising to 97.2.
Inflation data was mixed but mostly in line. Core PCE for June rose 0.3% MoM, while the YoY reading ticked up to 2.8%, slightly above the expected 2.7%. The broader PCE Price Index also came in at 0.3% MoM, with a YoY print of 2.6%, slightly higher than forecast.
The Federal Open Market Committee (FOMC) voted to keep the federal funds rate target range unchanged at 4.25% – 4.50%. Notably, Governors Waller and Bowman dissented, favoring a 25-basis-point rate cut as expected, however, marking the first dual dissent by governors since 1993.
Changes to the FOMC Statement included a downgraded assessment of economic growth, reflecting slower real consumer spending. The Committee reiterated that uncertainty around the economic outlook remains elevated. It maintained its view of the labor market as "solid" and inflation as "somewhat elevated." Forward guidance remained unchanged, emphasizing the Fed’s readiness to adjust policy as necessary while continuing to monitor risks to both sides of its dual mandate.
Here’s a summary of key points from the FOMC press conference:
• On current policy stance:
“We decided to leave our policy rate where it’s been, which I would characterize as modestly restrictive. Inflation is running a bit above 2%... even excluding tariff effects. The labor market is solid, financial conditions are accommodative, and the economy is not performing as if restrictive policy is holding it back.”
Chair Powell commented on the need to see more data to help inform Fed’s assessment of the balance of risks and appropriate Fed Funds rate.
• On labor market risks:
“By many statistics, the labor market is still in balance... You do see a slowing in job creation, but also a slowing in the supply of workers. That’s why the unemployment rate has remained roughly stable.”
• On inflation and tariffs:
“It’s possible that tariff-related inflationary effects could be short-lived, but they may also prove persistent. We’re seeing substantial tariff revenue—around $30 billion a month—starting to show up in consumer prices. Companies intend to pass it on to consumers, but many may not be able to. We’ll need to watch and learn how this unfolds over time.”
Trade Headlines:
US President Trump announced tariffs on countries ranging from 10%-41%. Average US tariff rate now at 15.2% (prev. 13.3%; 2.3% pre-Trump), according to Bloomberg. US officials said that if the US has a surplus with a country, the tariff rate is 10% and small deficit nations have a 15% tariff, US officials said they are still working out technicalities of rules of origin terms for transshipment and will implement rules of origin details in the coming weeks. No details on Russian oil import penalty. Sectoral Tariffs White House said new reciprocal tariff rates take effect on Friday. Although Canada’s tariffs were increased to 35%, excluding USMCA goods, the effective rate is only 5%.
The economic data is showing strength, on the contrary, tariffs announcements for most countries have now been announced. Investors need to consider that tariffs are not just a tool to reduce trade deficit, it is also a geopolitical tool presently being used to shape alliances. The US wants to soften BRICS, China and Russian influence on the world stage.
Key to note is that these tariffs are substantially lower than what was announced on April 2nd, 2025.
The key question now remains, do participants buy the dip or ‘sell the fact’ is the current playbook?
Market Implications
Given the prior revisions in NFP data of -258K, July’s payroll came in at 73K, missing forecasts of 110K. What does this mean for markets? Markets are now pricing in 75% chance of a September rate cut. Prior revisions along with the current job market slowing down imply that risks to the downside are substantially increasing. Fed’s current policy is not just moderately restrictive but rather it may likely tip the US into a recession if Fed Funds rates remain elevated. The Chair asked to see more data, and here it is but I do wonder why they did not take this data into account for the July meeting. Surely, it would have been available to them.
Another question to ask would be, is it due to defiance of rate cut calls by the US administration? Is the Fed already behind the curve?
Fed’s dual mandate targets inflation and maximum employment. While inflation is sticky, the Fed may need to abandon their 2% mandate in favor of average inflation of 2.5% to 3%. A less restrictive policy will provide needed stimulus along with the fiscal stimulus provided via the BBB bill.
This drastically changes, in our analysis, how investors position themselves heading into the remainder of the year.
Markets (equities) may retrace slightly but the dip in our opinion will still be the play given weaker labor market data and increased rate cut bets. The bad news here means that the Fed has the data it wants to see to start cutting. Market pricing in 2 cuts seems to be the way forward for now.
Gold you now totaly buy trend for next 3 to 5 days Gold you now totaly buy trend for next 3 to 5 days
If you want learn more fell free contrect me .

GOLD OUTLOOKMy view on Gold ..
More likely to retrace to the bearish PRZ from where i'll be looking for Sell setup on the lower time frames

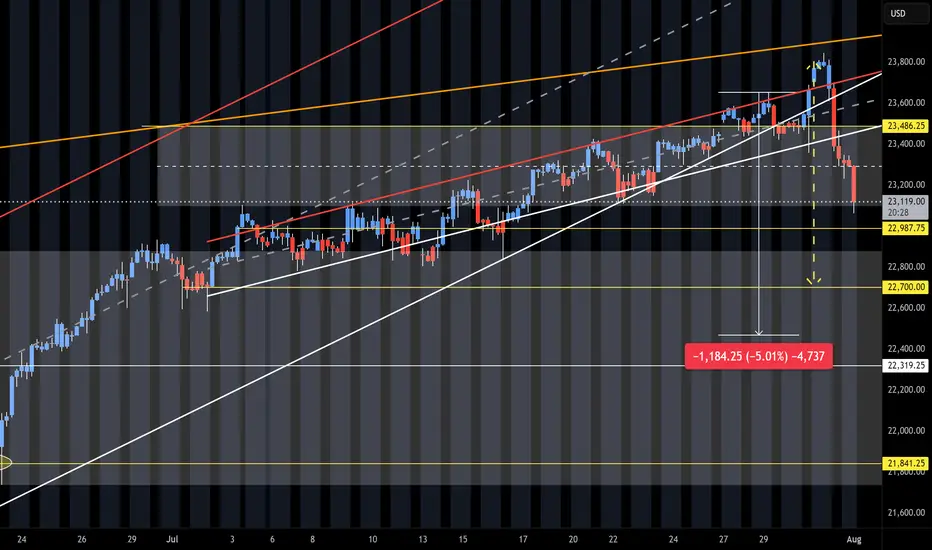
NQ Short (08-01-25)The 5% pull back is playing out. We had the heavy selling after the O/N Pump/Dump into the selling of the Reg Session and Outside Day Reversal. Up for weeks and down in hours. Next break down will have to be the failure of the long standing Friday into Monday Long Play. We did get the reg session selling and now O/N selling. Looking for the trifecta and failed F-M move. Long Trap is active. Just watch the timely Tweets and Tricks at KL's.
XAUUSD H4 Update – The Battle Has Moved to 3350
“From deep demand to key supply. The next move is decisive.”
🔸 Sunday Plan Recap
Price was falling aggressively into the HTF demand zone (3265–3240).
The plan anticipated a bounce only if that deep zone held.
Above price, major zones included:
3314 – mid-structure
3330–3345 – supply zone
3368–3380 – final retracement targets
🔸 What Changed?
✅ The deep demand zone worked — H4 CHoCH bullish was confirmed.
✅ Price climbed through 3285 and 3314, confirming a retracement leg.
🔥 Now, price sits at 3349.57, testing the same supply zone marked in Sunday’s plan (3330–3345).
🔸 Current H4 Structure
🔼 Short-term bias = bullish retracement
📍 Price = inside HTF premium zone
📈 EMAs aligned bullish (5/21/50), confirming short-term momentum
💡 RSI = approaching overbought
⚔️ Liquidity above 3355, trapped shorts below 3314
🧠 Today’s Battle Plan (August 1)
🔴 Sell Zone (live) – 3345 to 3355
Price just entered the key H4 supply zone. Watch for rejection signs:
Bearish confirmation needed (e.g. M15/M30 CHoCH or engulfing)
If confirmed → downside targets: 3314 → 3285 → 3265
High RR short only if structure confirms
🔵 Breakout Bullish Case
If 3355 breaks with a clean body + HL at 3340 → bullish continuation active
Next upside target: 3368 → 3380
🧭 Final Thoughts
We’ve reached the exact decision zone from Sunday’s plan.
The market will now reveal: retracement over... or breakout coming?
Patience is key — this is a high RR zone, but only if structure reacts.
💬 Did you catch the move from deep demand? Or waiting for confirmation here at supply?
📈 Share your thoughts in the comments and let’s break it down together.
🔔 Follow for real-time market insights, sniper plans, and structured trading logic you can trust.
❤️ Like if you enjoy clean, actionable updates🚀🚀🚀
🔁 Share with traders who love structure over noise
📉 Price data from Trade Nation feed

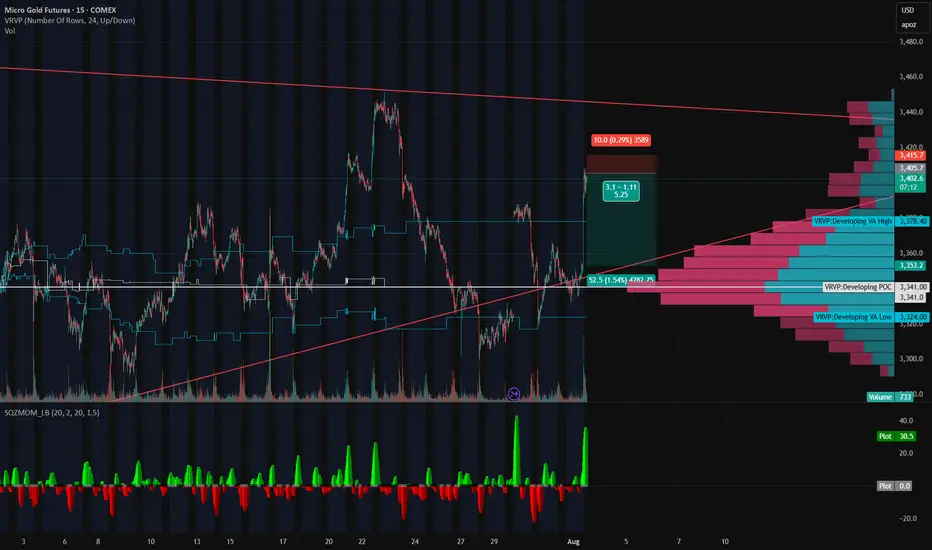
Gold’s on a Roller Coaster — and We’re Riding It Down🎢 Gold’s on a Roller Coaster — and We’re Riding It Down 🎢
Gold just snapped up like it saw Trump tweet “TARIFFS ARE BACK” — but the move smells like a knee-jerk algo pump, not real conviction. We just rejected right into a thin-volume imbalance zone and tagged the underside of a long-standing trendline.
📉 Short Setup Locked In:
💥 Entry: 3405
🛑 Stop: 3415
🎯 Target: 3353
💰 R:R ≈ 5:1
🔍 Why I'm In This Trade:
That rip? Total headline panic, not structural strength.
Low volume shelf above, with a massive POC magnet below at 3353.
We tapped the Developing VAH (3414) and got rejected — classic trap setup.
SQZMOM showing the energy is already fizzling. Green flash, no follow-through.
🧠 The Narrative:
Gold’s trying to price in volatility from every angle — Trump talk, tariffs, macro chaos — but under the hood, this pop looks unsustainable. If this is just a liquidity grab, we could see a flush back into the meat of value fast.
Grab your helmets — this roller coaster might just be heading downhill 🎢📉
Silver XAGUSD is forming a bullish IB pattern The market of silver XAGUSD is in Up trend
it formed a correction wave
near the previous levels of multi bullish price action between 36 and 36,30
this market is forming an IB pattern
buy stop order must be place at the HH of the MB at the price 37.35
SL 36
TP 39

NASDAQ Futures (/NQ) Outlook – Weekly Chart As of August 1,2025NASDAQ Futures (/NQ) Outlook – Weekly Chart
As of August 1, 2025
Current Price: 22,915.75
RSI (14): 61.34 – momentum remains bullish, but cooling off
🧭 Short-Term Outlook:
The recent weekly candle shows strong rejection and a -2.16% drop, suggesting a possible correction phase.
Price is now heading toward the 0.236 Fib retracement zone (~22,120) — a logical short-term support.
If this level doesn't hold, the next major support sits around the 0.382 zone (~21,045), aligning with your second expected zone (~21,000).
🛑 Support Levels to Watch:
~22,120 – Fibonacci 23.6%, prior structure zone
~21,000–21,045 – Confluence with 38.2% Fib + former resistance
~20,175 – 50% retracement, deeper retest if sentiment shifts
Mid-Term Bias (Q4 2025 Outlook):
After this pullback phase, your projected path implies:
A bullish resumption from the support levels (likely from 21k–22k zone)
Consolidation into Q4
A breakout continuation toward new highs above 24,000 into 2026
This outlook remains valid as long as 20,000 holds — a clean invalidation point for medium-term bulls.
Also, whenever the daily Candle closes above high of thid week which is the ~23845 points , this outlook become invalid too.

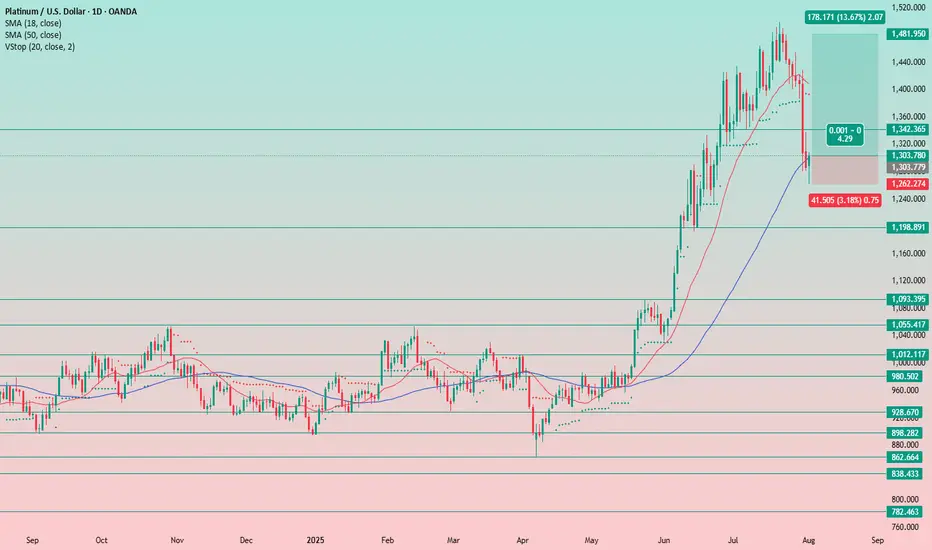
Platinum Still Has Room to RunJust like with silver, the potential for further growth in gold remains, despite the setbacks of recent days.
It seems the precious metals market didn’t mourn the Fed’s decision and subsequent press release for long.
The uptrend remains intact, and the previously supportive factors are still in play.
Even amid the negative news, there was no sharp sell-off — everything stayed within the trend. This clearly signals that rate cuts are on the horizon, and metals are likely to continue their upward move.
I’m in favor of continued upside.
Stop-loss is placed below yesterday’s low — now we wait for higher levels.
Silver Remains a Buy on DipsIt seems the precious metals market didn’t mourn the Fed’s decision and subsequent press release for long.
The uptrend remains intact, and the previously supportive factors are still in play.
Even amid the negative news, there was no sharp sell-off — everything stayed within the trend. This clearly signals that rate cuts are on the horizon, and metals are likely to continue their upward move.
We only trade from the long side — nothing has changed.
At the moment, we've seen a pullback, and it feels strange not to take advantage of it and add more silver to the portfolio.
Stop-loss is set below yesterday’s candle low at 36.15.
We’ll see how the position develops. For now, the idea is to hold as long as the stop-loss holds. The long-term target is 48. Obviously, we won't reach it quickly, so I’ll trail the stop as the trade progresses — first to breakeven, and eventually into profit.

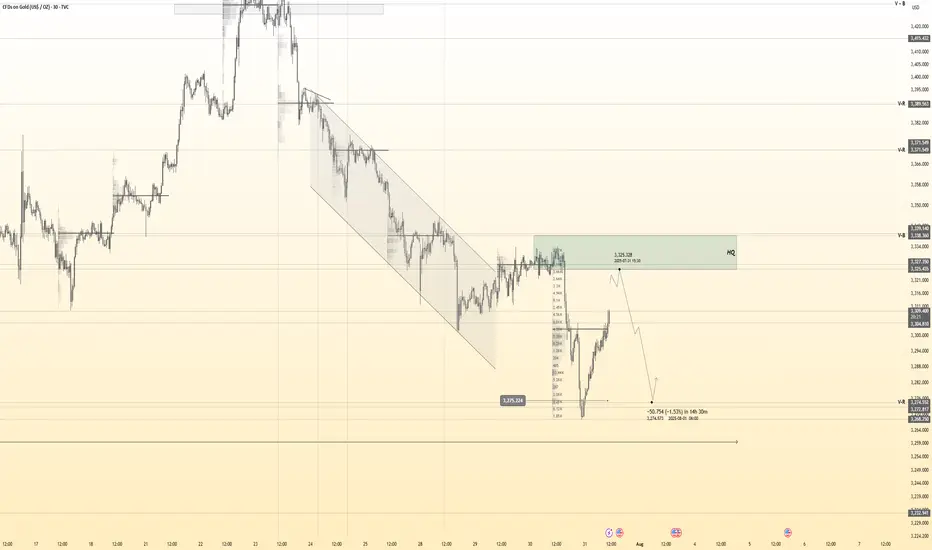
Gold 30Min Engaged ( Bearish Reversal Entry Detected )Time Frame: 30-Minute Warfare
Entry Protocol: Only after volume-verified breakout
🩸Bearish Reversal - 3325
➗ Hanzo Protocol: Volume-Tiered Entry Authority
➕ Zone Activated: Dynamic market pressure detected.
The level isn’t just price — it’s a memory of where they moved size.
Volume is rising beneath the surface — not noise, but preparation.
🔥 Tactical Note:
We wait for the energy signature — when volume betrays intention.
The trap gets set. The weak follow. We execute.

**"Gold Price Rebounding from Support:Potential Move Toward 3436This chart shows the **price movement of Gold (XAU/USD)** on a **daily timeframe**.
### Key Points:
* **Support Zone** : Around **\$3,266**, this is the area where price has bounced up multiple times, meaning buyers step in here.
* **Resistance Line**: Around **\$3,436**, this is the level where price has been rejected before, meaning sellers are strong here.
* **Current Price**: Around **\$3,293**.
### What the Chart Suggests:
* Price is near the **support** zone again.
* If the support holds, the green arrow shows a possible move **upward**.
* Price may first move up slightly, pull back, and then try to **break above resistance** at \$3,436.
Gold is in a sideways range. It's near a strong support level and might go up from here toward the resistance level, as shown by the green line.
