gold on sideways#XAUUSD price await double breakout above 3328.6 for bullish to take place. But now we await for any breakout to take trade.
Below 3314 holds sell continuation, target 3296, stop loss 3324.
Above 3328.6 on 2 times breakout will start bullish till 3340.
Futures market

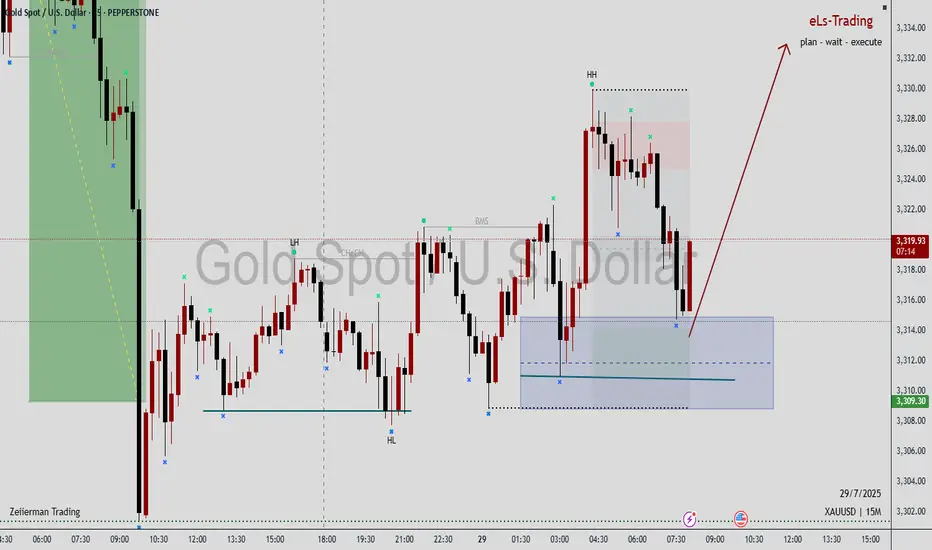
29 july 2025Possible short on ES. NY took out the previous day's high while ES did not, thus forming an SMT. There is a 4 hour poor low from the previous week's wednesday and relative equal lows on friday.
As we are approaching the end of the month there could very well be a sell off to put in the month's wick before continuing higher next week.

XAUAUSD ideaWe are waiting for our asset to reach our action zone, and based on the reaction, we’ll decide on our next moves.ALWAYS WAIT FOR A CONFIRMATION TO SEE IF THE PRICE VALIDATES THE ZONE.and you what is your vision of the EURUSD its interests me! i wait you in the commentary
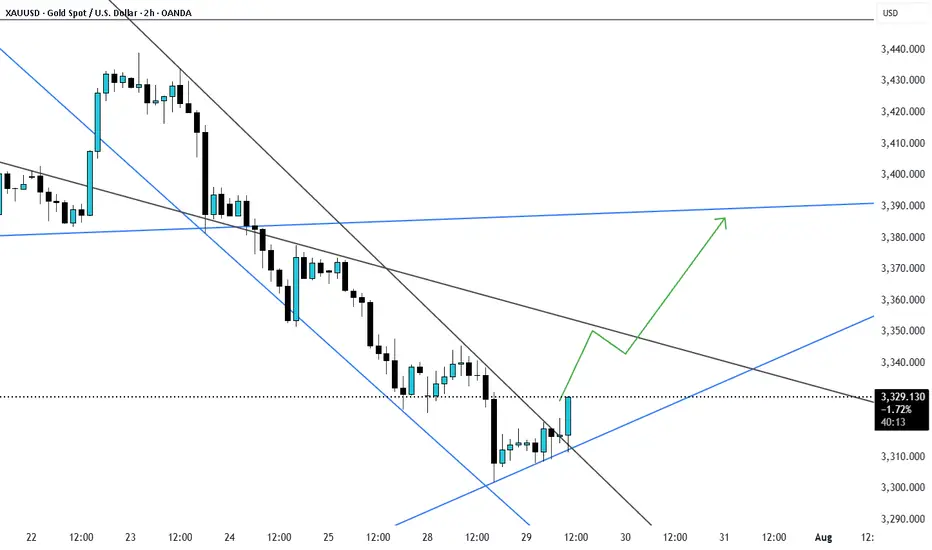
Gold Break of channel resistance next target is 3360-3375Gold was trending in down trend but now it has broken the resistance and is likely to go up.
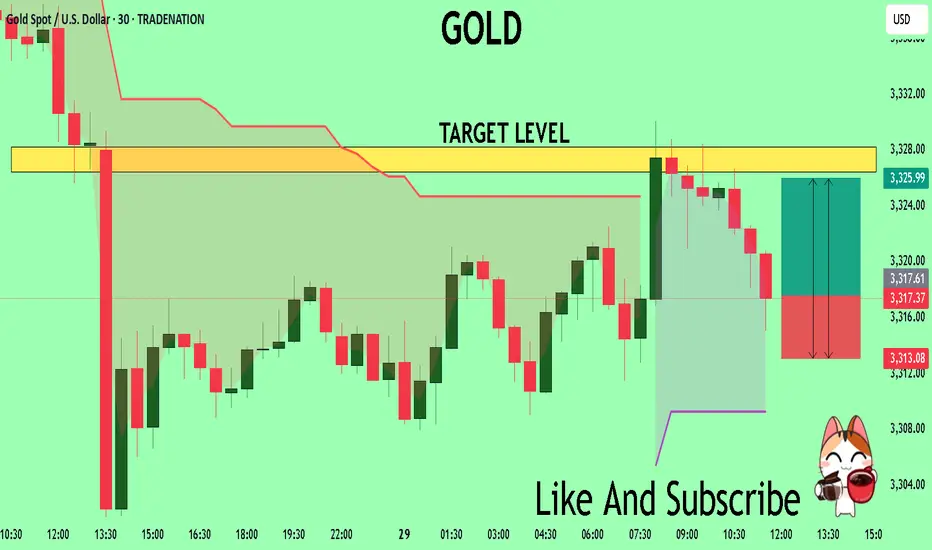
GOLD The Target Is UP! BUY!
My dear subscribers,
This is my opinion on the GOLD next move:
The instrument tests an important psychological level 3317.7
Bias - Bullish
Technical Indicators: Supper Trend gives a precise Bullish signal, while Pivot Point HL predicts price changes and potential reversals in the market.
Target - 3326.4
My Stop Loss - 3313.0
About Used Indicators:
On the subsequent day, trading above the pivot point is thought to indicate ongoing bullish sentiment, while trading below the pivot point indicates bearish sentiment.
Disclosure: I am part of Trade Nation's Influencer program and receive a monthly fee for using their TradingView charts in my analysis.
———————————
WISH YOU ALL LUCK
GOLD trades in narrow range after 4 sessions of sharp declineOn Tuesday (July 29), in the Asian market, the spot OANDA:XAUUSD traded in a narrow range after yesterday's sharp decline, and the current gold price is around 3,315 USD/ounce.
The OANDA:XAUUSD fell to its lowest level in nearly 3 weeks on Monday, mainly due to the trade agreement reached between the United States and the European Union over the weekend, which boosted the Dollar and risk sentiment.
The previous report released by the US Bureau of Labor Statistics showed that the number of US JOLTS jobs unexpectedly increased in May, reaching the highest level since November last year.
The number of JOLTS job vacancies in the US in May was 7.769 million, far exceeding the forecast of all economists surveyed.
Looking back at the data in April, the number of JOLTS job vacancies also showed an unexpected increase.
The JOLTS jobs report is a closely watched labor market data by the Federal Reserve.
In addition, the Conference Board of America's Consumer Confidence Index for July is scheduled to be released on the same day and is expected to be 95.8, compared to the previous value of 93.0.
The fundamental pressure that gold is under
OANDA:XAUUSD came under pressure yesterday and fell to a near three-week low, mainly due to the trade deal between the United States and the European Union (EU) over the weekend, which boosted the Dollar and risk sentiment. Moreover, US President Trump announced “global tariffs” of 15% to 20% on most countries, a change from his previous statement last week.
The deal reached by U.S. President Donald Trump and the European Union late last week will impose a 15% tariff on EU goods, half the rate Trump had threatened, easing fears of a wider trade war.
The U.S. and Japan also reached a deal last week, and U.S. and Chinese officials resumed talks in Stockholm, Sweden, this week with the goal of extending the tariff deadline by 90 days.
Technical Outlook Analysis OANDA:XAUUSD
Gold has been on a four-day losing streak, a decline that threatens bullish expectations as its current position gradually deprives it of any room for further upside.
Specifically, gold has recovered from the psychological level of $3,300 but the actual recovery is not significant, while it is under pressure from the EMA21 which is currently the closest resistance.
On the other hand, gold has fallen below both the long-term and short-term trend channels. If it continues to sell below the 0.382% Fibonacci retracement level, this will confirm a break below the psychological level of $3,300, then the downside target will be around $3,246 in the short term, rather than $3,228.
RSI is pointing down, below 50 and still far from the 20-0 area, also showing that in terms of momentum, gold is also under pressure and there is still a lot of room for decline ahead.
For gold to be eligible for an increase, it needs to at least bring price activity back above the EMA21, back inside the price channels. On the current daily chart, the technical conditions are more inclined towards the possibility of a decrease.
Notable positions will be listed as follows.
Support: 3,310 - 3,300 - 3,292 USD
Resistance: 3,340 - 3,350 - 3,371 USD
SELL XAUUSD PRICE 3355 - 3353⚡️
↠↠ Stop Loss 3359
→Take Profit 1 3347
↨
→Take Profit 2 3341
BUY XAUUSD PRICE 3285 - 3287⚡️
↠↠ Stop Loss 3281
→Take Profit 1 3293
↨
→Take Profit 2 3299
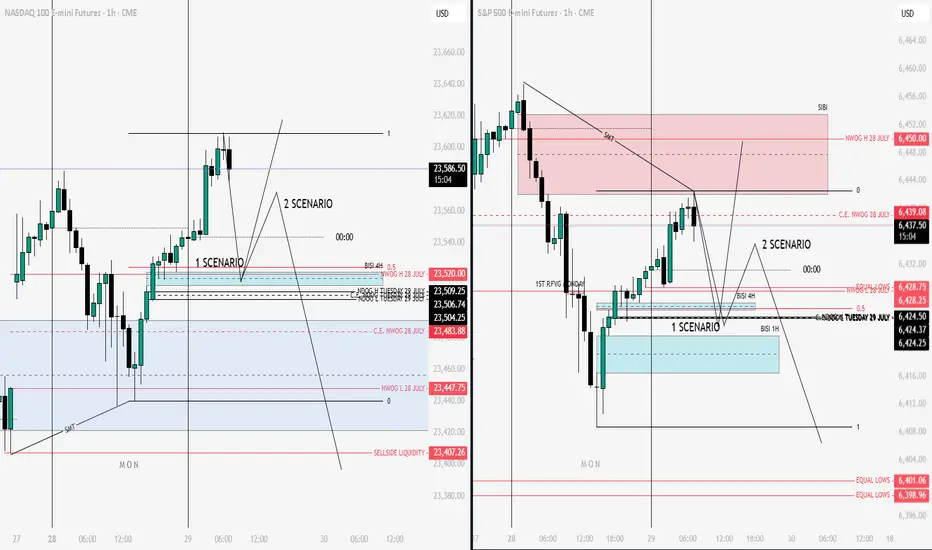
NQ & ES Key Levels 29-07-2025These are the most sensitive points today and only these two scenarios can exist. Take advantage of these key levels for short term trades, scalps or swing trades
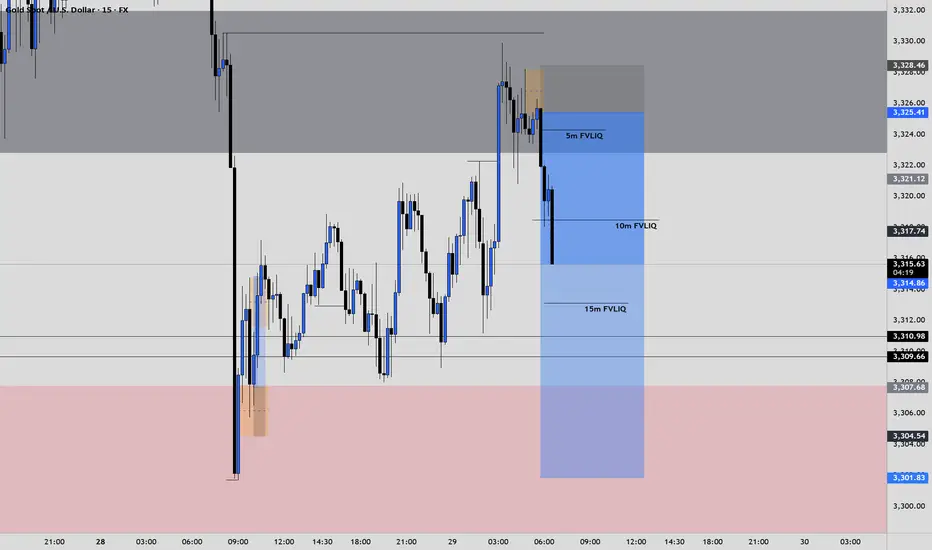
XAUUSD ShortElite Analysis
Noticed price came to structural liquidity
Obtain confirmations to short
Executed from 3m OB
Targeting Lower liquidity pools, main target London low
GOLD: Strong Growth Ahead! Long!
My dear friends,
Today we will analyse GOLD together☺️
The market is at an inflection zone and price has now reached an area around 3,321.22 where previous reversals or breakouts have occurred.And a price reaction that we are seeing on multiple timeframes here could signal the next move up so we can enter on confirmation, and target the next key level of 3,329.97.Stop-loss is recommended beyond the inflection zone.
❤️Sending you lots of Love and Hugs❤️
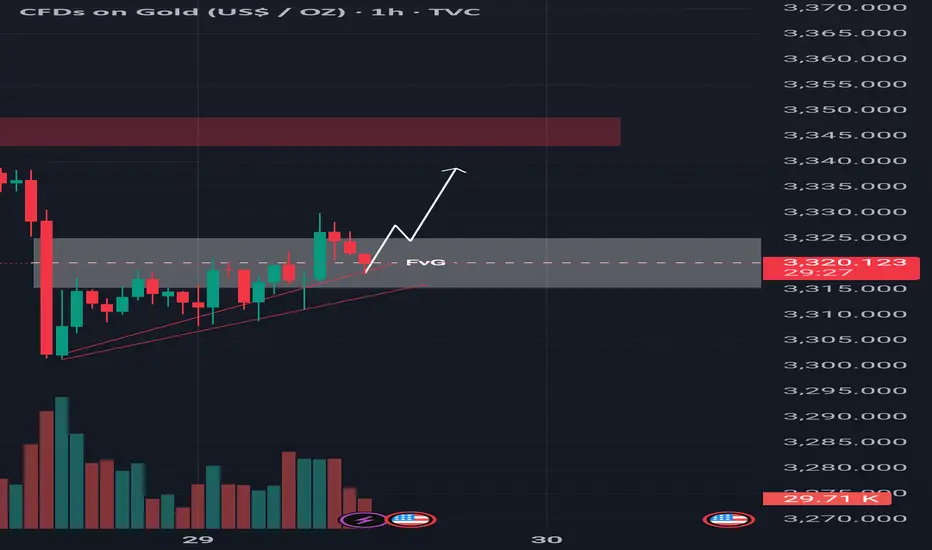
Technical Shift FVG Break and Retest Hints at Further Upside!Gold is currently showing strength after taking support from the trendline, indicating buyers are stepping in around that level. Moreover the price has successfully broken above the 4-hour bearish Fair Value Gap (FVG), which suggests a shift in market sentiment. This FVG zone has now transitioned into an inversion level meaning what was once a resistance area could now act as support. At the moment, the market is pulling back, likely to retest this newly flipped zone. If buyers defend this area on the retest, it could provide the base for a potential bullish continuation. From this zone, we may witness a strong upward move, with the next target likely being the liquidity resting above key resistance levels. As always, it’s important to conduct your own analysis and manage risk accordingly (DYOR).
GOLD / XAUUSD TodaySSM Struckture is bearish
I have two scenario to sell setup
Now I open first if hit Sl and still rules to entry I will open next one

Dollar Index - Expecting Bullish Continuation In The Short TermH4 - Strong bullish momentum followed by a pullback.
No opposite signs.
Until the two Fibonacci support zones hold I expect the price to move higher further.
If you enjoy this idea, don’t forget to LIKE 👍, FOLLOW ✅, SHARE 🙌, and COMMENT ✍! Drop your thoughts and charts below to keep the discussion going. Your support helps keep this content free and reach more people! 🚀
--------------------------------------------------------------------------------------------------------------------

XAGUSD LONG SETUP Silver price is still in a falling wedge pattern after creating the minor Ascending wedge and couldn't breakout further, so still consolidating in the wedge, so will see to which side proce decides to break.


XAU USD LONG SETUPAfter the breakout of the narrow falling Wedge pattern, price held at the strong support order block with selling pressure dropping, and formed a wedge pattern indicating signs of some demand coming into play, will see how price continues to play out.

Gold Analysis and Trading Strategy | July 29✅ Fundamental Analysis
🔹 U.S. Dollar Index Surges Strongly: On Monday, the U.S. Dollar Index jumped over 1%, closing at 98.6, marking a new short-term high. This rally was primarily driven by the U.S.-EU trade agreement, which reduced tariffs to 15%, easing concerns of a trade war escalation. As a result, risk assets gained appeal, while gold's safe-haven demand was suppressed.
🔹 U.S.-China Talks Resume with Limited Expectations: The U.S. and China resumed trade negotiations in Stockholm, aiming to extend the 90-day tariff truce. However, the U.S. side made it clear that "no major breakthroughs are expected," leaving room for uncertainty, which provides some support for gold.
🔹 Geopolitical Risks Remain Elevated: President Trump has set a 10–12 day deadline regarding the Russia-Ukraine issue, warning of stronger measures if no progress is made. Meanwhile, tensions in the Middle East continue. Any escalation in conflicts could trigger renewed safe-haven buying in gold.
✅ Technical Analysis
🔸 Gold closed lower again on Monday, marking the fourth consecutive daily loss. The price rebounded to the 3345 level during the day but encountered strong resistance. During the European session, gold broke down swiftly, reaching a low of around 3301, showing a typical one-sided sell-off with strong bearish momentum.
🔸 On the 4-hour chart, gold broke below the key support level at 3320 and continued trading below the MA system. If the price fails to reclaim the 3330–3340 zone, the outlook remains bearish. However, if the European or U.S. session can push the price firmly above 3330, a potential bottom formation could be underway.
🔴 Resistance Levels: 3330 / 3345–3350
🟢 Support Levels: 3300 / 3285–3280
✅ Trading Strategy Reference:
🔻 Short Position Strategy:
🔰Consider entering short positions in batches if gold rebounds to the 3340-3345 area. Target: 3320-3310;If support breaks, the move may extend to 3300.
🔺 Long Position Strategy:
🔰Consider entering long positions in batches if gold pulls back to the 3300-3305 area. Target: 3325-3335;If resistance breaks, the move may extend to 3345.
🔥Trading Reminder: Trading strategies are time-sensitive, and market conditions can change rapidly. Please adjust your trading plan based on real-time market conditions. If you have any questions or need one-on-one guidance, feel free to contact me🤝

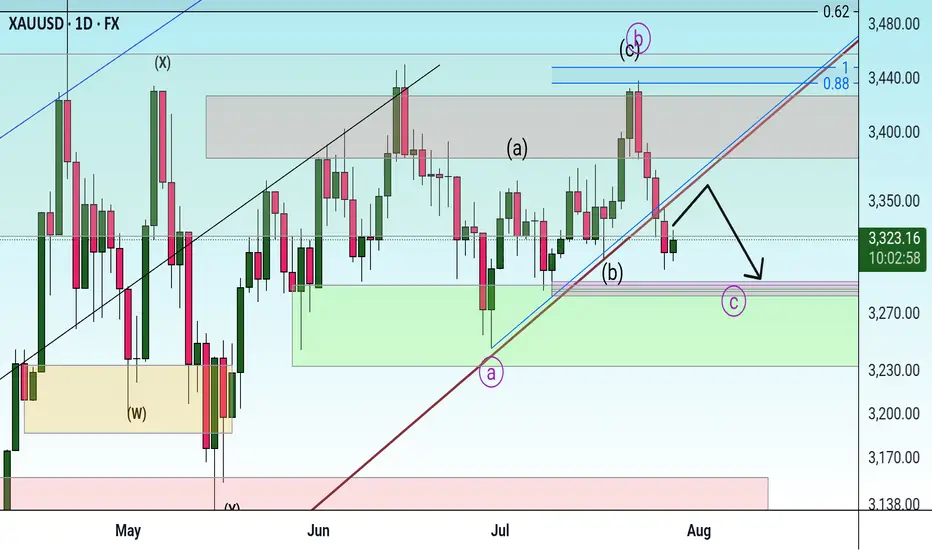
Correction It is expected that the price will consolidate below the trend line and continue the downtrend to the specified support levels. In this case, a three-wave pattern will form.
SILVER: The Market Is Looking Down! Short!
My dear friends,
Today we will analyse SILVER together☺️
The recent price action suggests a shift in mid-term momentum. A break below the current local range around 38.167 will confirm the new direction downwards with the target being the next key level of 37.976 .and a reconvened placement of a stop-loss beyond the range.
❤️Sending you lots of Love and Hugs❤️

Xausd techinical analysis.Xausd techinical analysis next move posibale at h1 time frame not finchinal advice.

Gold Trade Plan 29/07/2025Dear Traders,
it time to recover Gold after Deep Correction ,
i expect price will be continue upward movement
with Target 1 : 3339
Target 2 : 3351
Target 3 : 3370
Regards,
Alireza!

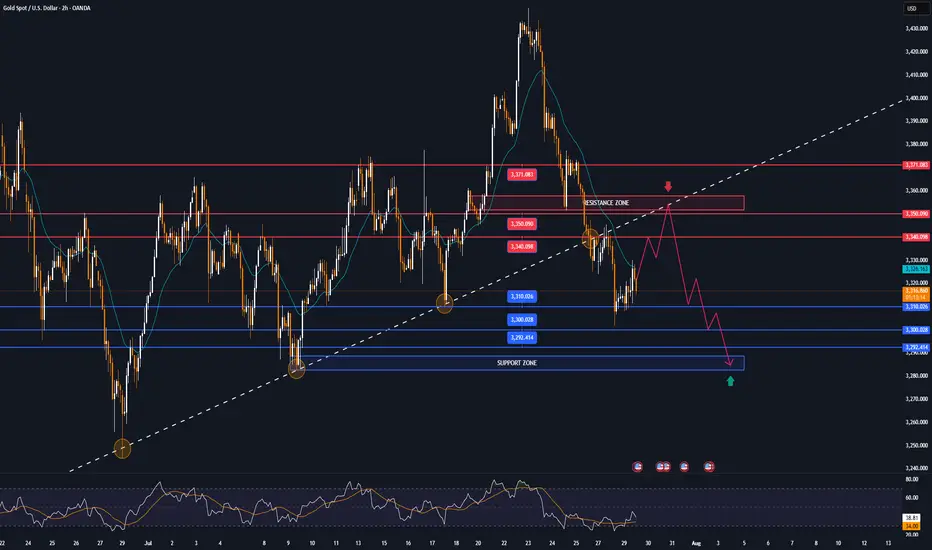
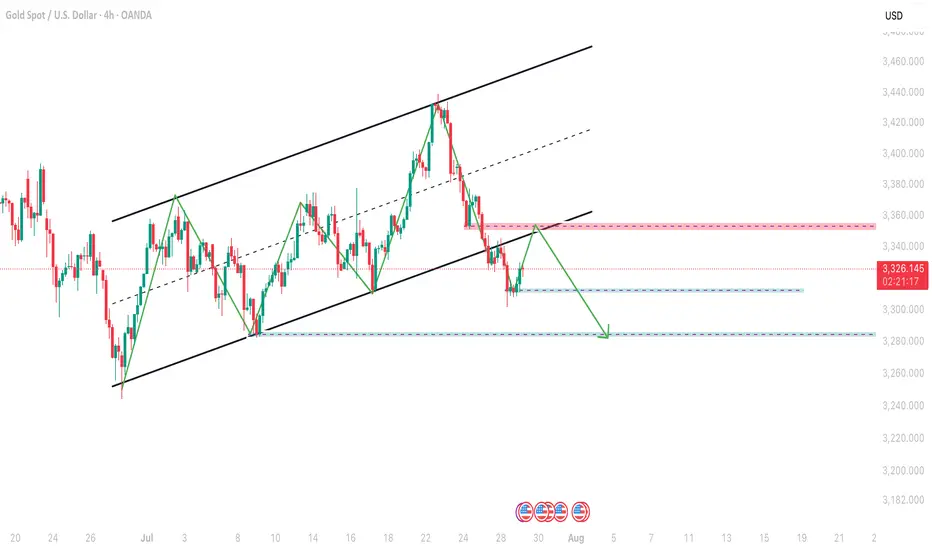
Gold 4H OverviewAs you can see Gold was running in a channel from last so many days which alreadh broke out 28 july 2025 so this is the time for retest of channel and then downtrend continuation.
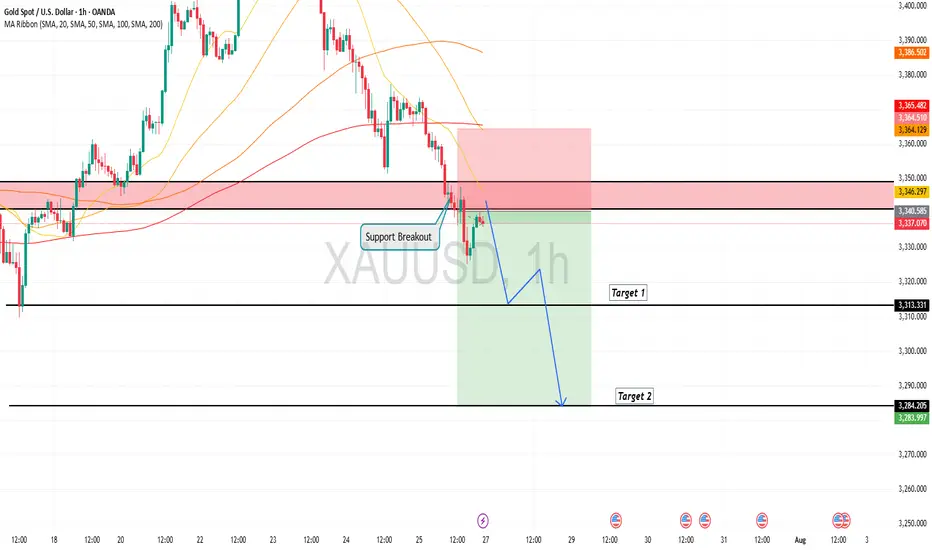
Gold is in the Bearish Direction after Breaking SupportHello Traders
In This Chart GOLD HOURLY Forex Forecast By FOREX PLANET
today Gold analysis 👆
🟢This Chart includes_ (GOLD market update)
🟢What is The Next Opportunity on GOLD Market
🟢how to Enter to the Valid Entry With Assurance Profit
This CHART is For Trader's that Want to Improve Their Technical Analysis Skills and Their Trading By Understanding How To Analyze The Market Using Multiple Timeframes and Understanding The Bigger Picture on the Charts
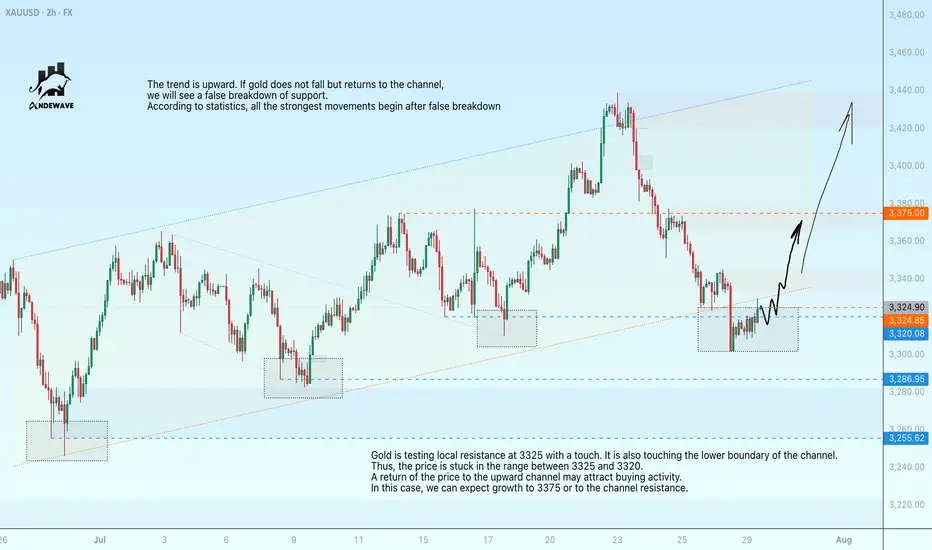
Gold may paint a false breakdown of supportGold is testing local resistance at 3325 with a touch. It is also touching the lower boundary of the channel. Thus, the price is stuck in the range between 3325 and 3320. A return of the price to the upward channel may attract buying activity. In this case, we can expect growth to 3375 or to the channel resistance.
The trend is upward. If gold does not fall but returns to the channel, we will see a false breakdown of support. According to statistics, all the strongest movements begin after false breakdown