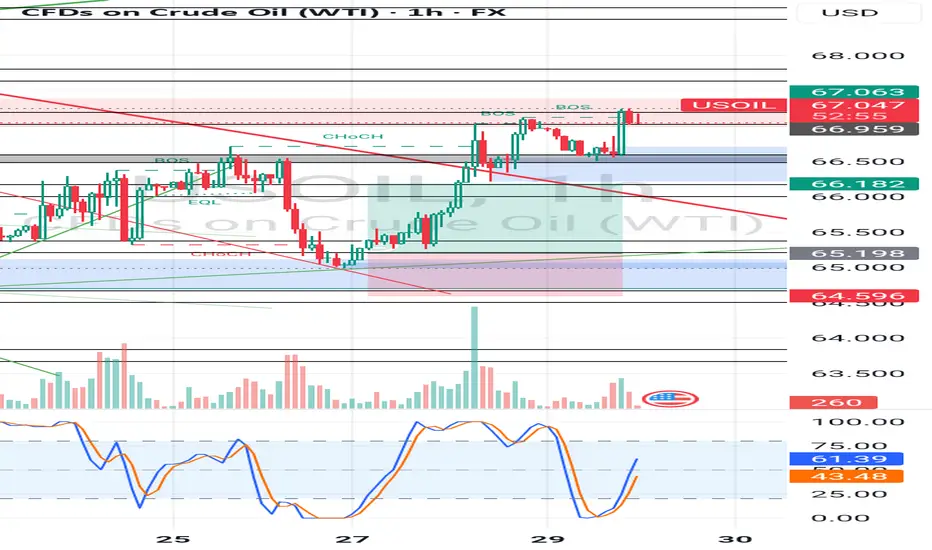
US OIL LONG SETUPPrice had created a good Demand Zone , Also Price is in an overall uptrend and pullback to the demand order block from which I took the entry, expected a minor retractment to pick my entry.
But it is what it is. Good Trade overall.
Potential Next setup Coming 🔥
_THE_KLASSIC_TRADER_.
Futures market
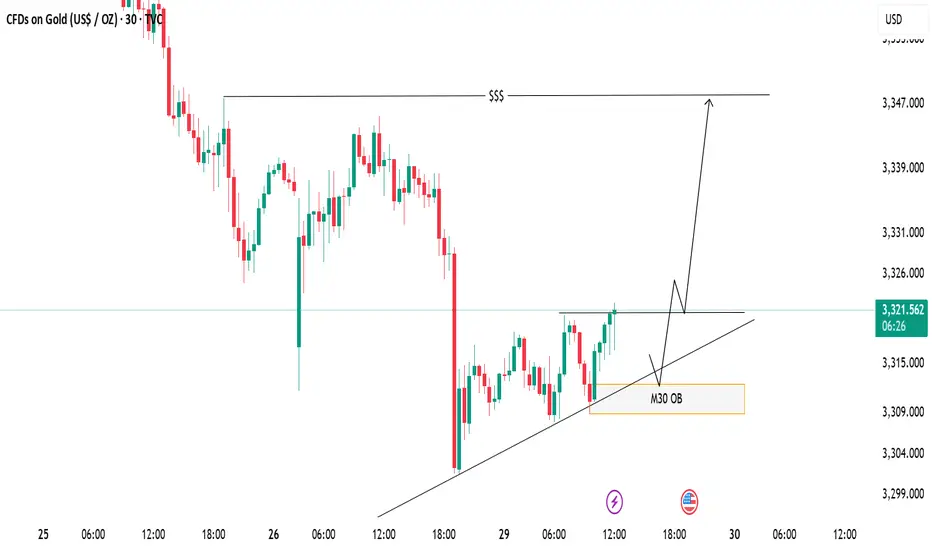
XAUUSD Eyeing Liquidity Grab – M30 OB Zone in PlayPrice is respecting the ascending trendline and consolidating near a key resistance level. A bullish breakout is expected, with a potential retest of the trendline and the M30 Order Block (OB) zone acting as a key demand area.
📈 Trade Plan:
Wait for a minor pullback into the OB and trendline confluence
Look for bullish confirmation to go long
Target the liquidity zone above (around 3347)
📌 A clean structure and bullish order flow hint at a continuation to the upside.

Euro Futures Idea.From HTF direction to LTF direction, this is my Trade Idea for the week of 28 July - 1 Aug.
Key Things in this trade idea, HTF PDAs, Liquidity of news high and daily swing and MMSM going on.

SILVER Will Grow! Buy!
Please, check our technical outlook for SILVER.
Time Frame: 8h
Current Trend: Bullish
Sentiment: Oversold (based on 7-period RSI)
Forecast: Bullish
The market is approaching a significant support area 3,817.6.
The underlined horizontal cluster clearly indicates a highly probable bullish movement with target 3,930.1 level.
P.S
The term oversold refers to a condition where an asset has traded lower in price and has the potential for a price bounce.
Overbought refers to market scenarios where the instrument is traded considerably higher than its fair value. Overvaluation is caused by market sentiments when there is positive news.
Disclosure: I am part of Trade Nation's Influencer program and receive a monthly fee for using their TradingView charts in my analysis.
Like and subscribe and comment my ideas if you enjoy them!

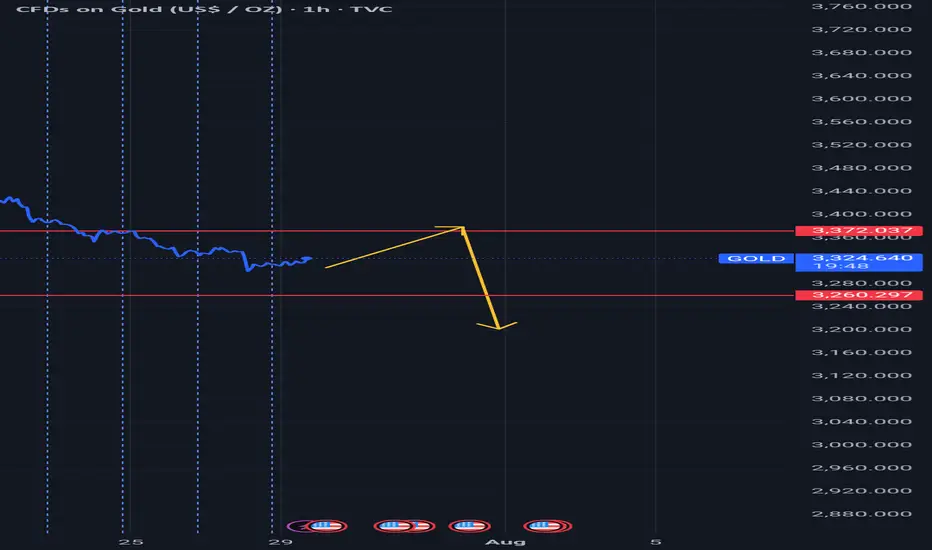
Gold (XAU/USD) Analysis:The short-term trend for gold remains bearish, with the price hovering near the $3,330 level.
1️⃣ If the price breaks below $3,310 and holds, it may lead to a further drop toward $3,290, followed by $3,280, and potentially $3,260.
2️⃣ On the other hand, if bullish momentum appears and the price breaks above $3,330, this opens the path toward $3,340.
🔼 A confirmed hold above that level could push the price to retest $3,370.
⚠️ Disclaimer:
This analysis is not financial advice. It is recommended to monitor the markets and carefully analyze the data before making any investment decisions.

maintain selling pressure around 3300, GOLD ⭐️GOLDEN INFORMATION:
Gold prices extended their slide for a fourth straight session, falling over 0.60%, as the U.S. and European Union reached a weekend trade agreement that halved proposed tariffs on EU goods—from 30% to 15%. XAU/USD is currently trading around $3,312, after earlier touching a high of $3,345.
The trade breakthrough lifted market sentiment, boosting risk appetite. Meanwhile, the U.S. Dollar is regaining strength, with the Dollar Index (DXY)—which measures the greenback against a basket of six major currencies—rising 0.99% to 98.64.
⭐️Personal comments NOVA:
Gold price maintains selling pressure around 3300, continuing the downtrend
⭐️SET UP GOLD PRICE:
🔥SELL GOLD zone: 3353- 3355 SL 3360
TP1: $3345
TP2: $3332
TP3: $3317
🔥BUY GOLD zone: $3287-$3285 SL $3280
TP1: $3295
TP2: $3307
TP3: $3320
⭐️Technical analysis:
Based on technical indicators EMA 34, EMA89 and support resistance areas to set up a reasonable SELL order.
⭐️NOTE:
Note: Nova wishes traders to manage their capital well
- take the number of lots that match your capital
- Takeprofit equal to 4-6% of capital account
- Stoplose equal to 2-3% of capital account

Golden View 20250729How should we view the current market conditions?
High-level shock, large triangle convergence and breakout, has been confirmed
Bearish expectations
Next, you can try to adopt a short strategy.
The question is, where to enter the short position?

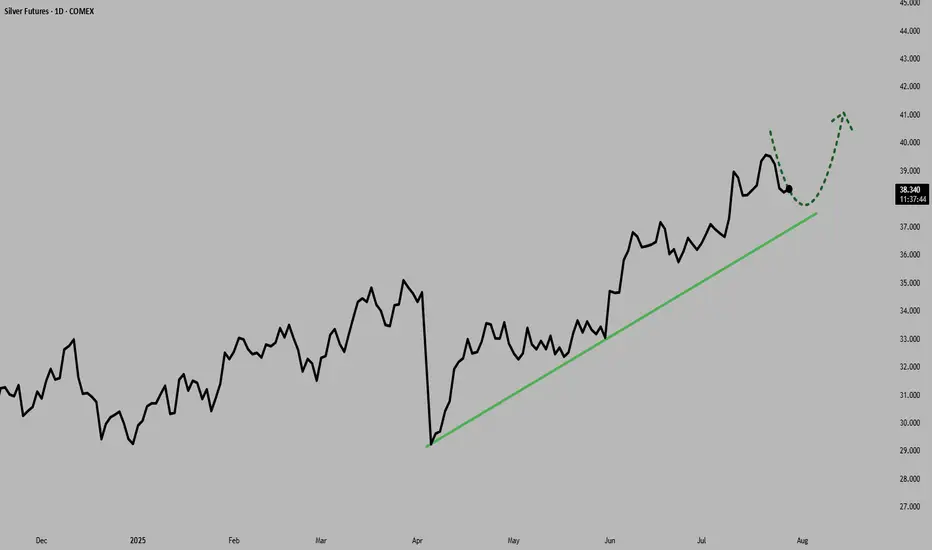
Silver Near $40: Deficits and Demand Fuel the RallySilver prices surged to multi-year highs in July 2025, driven by an extraordinary convergence of bullish factors, pushing prices above $39 per ounce, levels last seen in 2011.
Silver’s rally, supported by robust industrial demand and safe-haven inflows, aligns with traditional patterns as the U.S. dollar has weakened over 2.3% over the recent period.
Macroeconomic Drivers and the U.S. Dollar
Silver's rally is unfolding around shifting macro conditions. The Federal Reserve has kept interest rates at a restrictive 4.25-4.50% throughout 2025 due to persistently high inflation (2.7% YoY). However, expectations for more rate cuts are growing, with the CME FedWatch tool showing a 59.8% probability of a cut at the September meeting as of July 28.
Adding to the complexity, U.S. trade policies have triggered significant market volatility and raised concerns over a potential supply shock. The U.S. administration has imposed steep 30% tariffs on imports from Mexico, set to resume on August 1. This has heightened fears, as Mexico is the world’s largest silver producer and supplies over half of U.S. silver imports.
But macro drivers aren’t the full story. The real force behind silver’s rally lies in the physical market itself. A structural supply deficit, escalating industrial demand, and growing investor appetite from Asia and North America, are proving to be far more pivotal than shifting rates or a softer dollar.
Physical Market Dislocation and Industrial Demand
The year 2025 marks the fifth consecutive year of a structural deficit in the global silver market, and the imbalance between supply and demand shows no sign of easing.
With minimal new mining capacity expected to come online and lengthy lead times for project development, supply constraints are structural rather than temporary.
Since 2021, the cumulative shortfall has reached nearly 800 million ounces (25,000 tons), steadily drawing down available inventories and tightening the market.
Industrial demand remains the central pillar of silver’s bull market. Forecasts for 2025 project record consumption of roughly 700 million ounces, driven by rapid adoption in green technologies and digital infrastructure. The electrical and electronics sector, which includes solar photovoltaics (PV), consumer electronics, automotive electronics, power grids, and 5G networks, has increased its silver usage by 51% since 2016.
Solar PV alone consumed approximately 197.6 million ounces in 2024, a record largely driven by China’s 45% expansion in solar capacity. With global EV production expected to approach 20 million units in 2025, automotive silver demand alone could exceed 90 million ounces.
Together, persistent deficits, accelerating industrial consumption, and capital flowing into physically backed investment vehicles are creating a market where available silver is increasingly scarce, amplifying upside pressure on prices regardless of short-term macroeconomic shifts.
COMEX silver inventories peaked at 504.72 million ounces on May 11 but have since eased back to levels last seen on April 24, indicating a recovery in demand following the large accumulation in US inventories post-tariff shock.
Positioning and Ratios Favour Gains
With net inflows of 95 million ounces in the first half of 2025, silver ETP investment has already surpassed the total for all of last year. By June 30, global silver ETP holdings reached 1.13 billion ounces, just 7% below their highest level since the peak of 1.21 billion ounces in February 2021
Futures positioning has also surged , with long positions up 163% over six months. These factors have helped propel silver prices over 35% higher year-to-date, building on a 21% gain in 2024.
The iShares SLV ETF netted inflows of $1,467.5 million over the past 3 months.
Physical silver investment demand remains robust, with significant buying from Asian markets. India, the world’s leading silver importer, saw record purchases of physical bullion and silver-backed ETFs during the first six months of 2025.
The gold-to-silver ratio, currently in the late 80s, remains historically elevated, suggesting silver remains significantly undervalued compared to gold. This indicates substantial upside potential for silver, especially given persistent market deficits, rising industrial and investment demand, and gold rising at the same time.
Hypothetical Trade Set-up
The silver market’s bullish fundamentals appear increasingly robust. Investors may consider accumulating silver positions, viewing short-term consolidations as attractive buying opportunities amid the compelling long-term outlook.
Options open interest for the September contract shows a bullish bias with a put/call ratio of 0.82 and high call interest at the far out-of-the-money call strike of $45 per ounce.
To express a bullish view on silver, investors can deploy a long position in CME Silver futures expiring in September. A hypothetical trade setup for this view is described below.
● Entry: $38.00 per ounce
● Target 1: $40.00 per ounce
● Target 2 (extension): $42.00 per ounce (if Fed easing in September coincides with physical tightness)
● Stop Loss: $36.70 per ounce
● Profit at Target 1: $10,000
● Profit at Target 2: $20,000
● Loss at Stop: $6,500
● Reward-to-risk ratio: 1.54 (Target 1) and 3.08 (Target 2)
Alternatively, investors can exercise the same view using CME Micro Silver futures, which offer smaller notional positions and more flexibility. Each Micro contract is priced in USD per ounce and represents 1,000 ounces of silver, compared to 5,000 ounces for the standard contract.
MARKET DATA
CME Real-time Market Data helps identify trading set-ups and express market views better. If you have futures in your trading portfolio, you can check out on CME Group data plans available that suit your trading needs tradingview.com/cme .
DISCLAIMER
This case study is for educational purposes only and does not constitute investment recommendations or advice. Nor are they used to promote any specific products, or services.
Trading or investment ideas cited here are for illustration only, as an integral part of a case study to demonstrate the fundamental concepts in risk management or trading under the market scenarios being discussed. Please read the FULL DISCLAIMER the link to which is provided in our profile description.
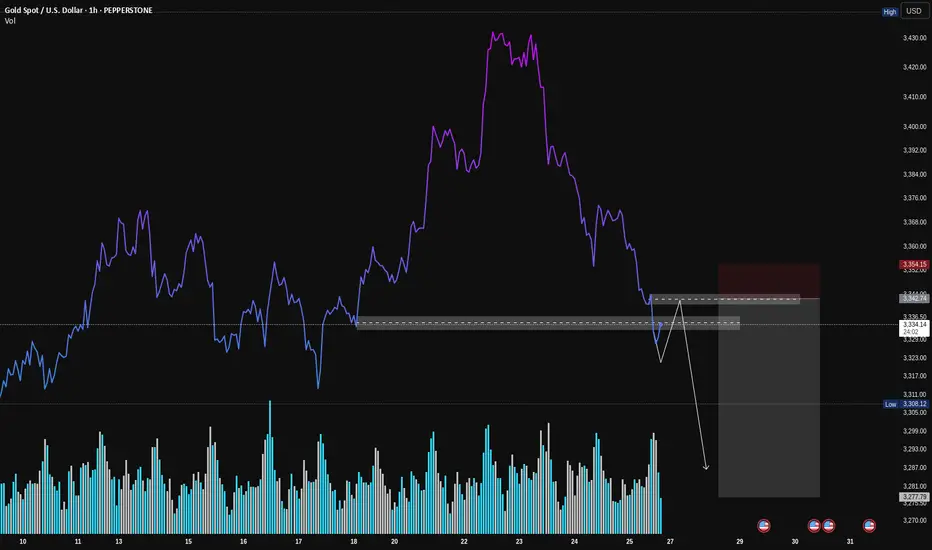
Gold (XAU/USD): A Classic VSA Short Setup in PlayHey Traders,
Following up on the general weakness we discussed in Gold, here's a closer look at a specific trade setup that's unfolding right now. This is a textbook example of a high-probability short setup according to Volume Spread Analysis (VSA).
Let's break down the story the volume is telling us.
1. The Breakdown: Sellers Show Their Hand
First, look at how the price broke down hard through that support level (the grey box). Notice the volume on that sharp drop? It was high. This is our clue that sellers are strong and in control. They had enough power to smash right through a level that was previously holding the price up.
2. The Retest: Buyers Don't Show Up
Now, the price is creeping back up to that same exact level. But here's the most important clue: look at the volume on this rally. It's much lower than the volume on the breakdown.
This is what VSA calls a "No Demand" rally. It’s like the market is trying to push a car uphill without any gas. It tells us that strong buyers (the "smart money") have no interest in buying at these prices.
3. The Setup: Selling into Weakness
This combination creates a classic short setup:
Logic: We are looking to sell at a level where old support has flipped into new resistance.
Confirmation: The low volume on the retest confirms the rally is weak and likely to fail.
How to Potentially Trade It
The grey box represents a high-probability entry zone. To time an entry, you could watch for a clear rejection signal right inside this zone. For example:
A "rejection candle" (like a pin bar) that pushes into the zone but gets slammed back down.
An up-bar with a tiny body and very low volume, showing buyers are completely exhausted.
Seeing one of these signs would be the final confirmation that sellers are about to take back control.
Conclusion:
This is a powerful setup because all the pieces line up: the background is weak, sellers have shown their strength, and buyers are now showing no interest at a key resistance level.
Disclaimer: This is my personal analysis using VSA and is for educational purposes only. It is not financial advice. Always do your own research and manage your risk. Good luck, traders!


XTIWith santions on Russia by EU and the projection of a saction by US which 50days ultimatum now reduced 12 days. This good fuel global demand having Russia as the 4th 3rd largest producer of crudeoil.

XAUUSD on Bearish values and volume Gold is currently below rising channel and holding the Range of 3320-3335,although yesterday implusive drop is incompleted without testing 3290-3280
Eyes on DXY
What's possible scanarios we have?
▪️I will wait next for my sell trades at 3338-3345 area but what we have to watch during that time H4 candle closing.if H4 & H1 candle close above I will not hold or renter sell also below 3320 we have implusive drop.
▪️Secondly if H4 candle closing above 3345 this down move will be invalid and Price-action will reached 3370.
#XAUUSD

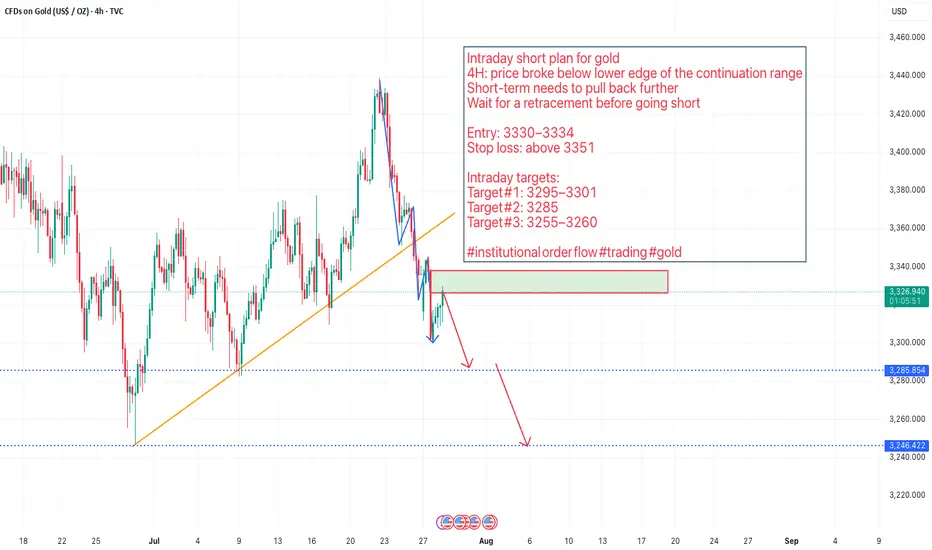
Short Gold! Intraday short plan for gold
4H: price broke below lower edge of the continuation range
Short‑term needs to pull back further
Wait for a retracement before going short
Entry: 3330–3334
Stop loss: above 3351
Intraday targets:
Target #1: 3295–3301
Target #2: 3285
Target #3: 3255–3260
#institutional order flow #trading #gold
US CRUDE OIL(WTI): Very Bullish Pattern📈USOIL has reached a significant horizontal demand zone on the daily chart, leading to price consolidation and the formation of a double bottom pattern with a higher low.
Yesterday, the market rebounded, creating a new local higher high that broke above the pattern's neckline.
This suggests a typical bullish reversal, and the oil price is expected to rise towards 64.40.

Head and shorder Head and shorder
Conformation on three time frame
Take sell on the second shorder formation
Target 1:3
DeGRAM | GOLD broke the rising channel📊 Technical Analysis
● XAU printed a false break above the 3 400 wedge roof, then sliced back through the rising mid-channel, closing under the wedge base at 3 309 - a classic bull-trap that flips that band into resistance.
● Momentum has rolled over, and the break of July’s micro up-trend opens room to the broad triangle floor/May trend-pivot near 3 246; successive lower-highs since 24 Jul confirm bearish control.
💡 Fundamental Analysis
● Hot US Q2-GDP and sticky core-PCE lifted 2-yr yields to one-month highs, reviving the dollar bid, while cautious ECB guidance tempers euro gold demand.
✨ Summary
Sell 3 309-3 335; hold below 3 309 targets 3 246 ▶ 3 200. Invalidate on an H4 close above 3 366.
-------------------
Share your opinion in the comments and support the idea with a like. Thanks for your support!

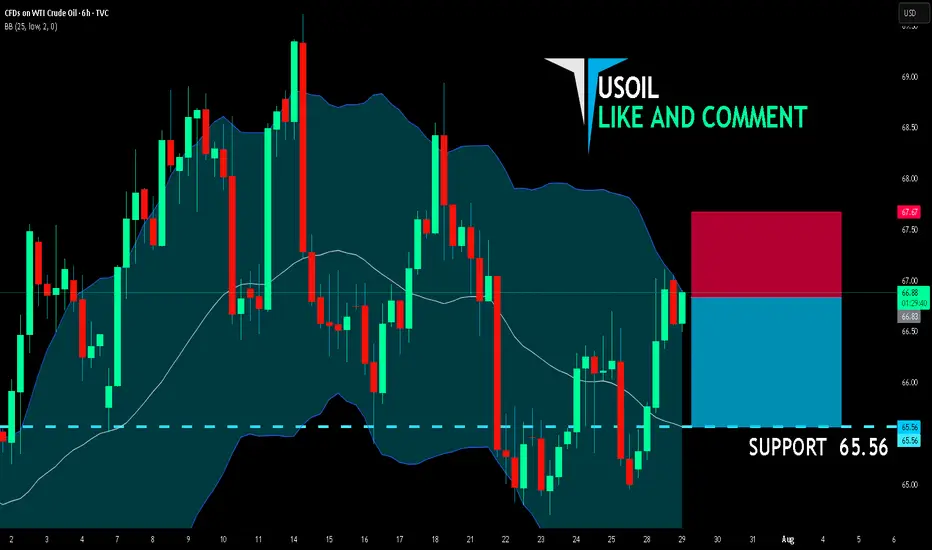
USOIL BEST PLACE TO SELL FROM|SHORT
USOIL SIGNAL
Trade Direction: short
Entry Level: 66.83
Target Level: 65.56
Stop Loss: 67.67
RISK PROFILE
Risk level: medium
Suggested risk: 1%
Timeframe: 6h
Disclosure: I am part of Trade Nation's Influencer program and receive a monthly fee for using their TradingView charts in my analysis.
✅LIKE AND COMMENT MY IDEAS✅
My plan for GoldShould we plan for a 600 pip profit on gold this week? I suggest you check the chart after withdrawing the liquidity shown.

XAUUSD under pressure – Is the downtrend just beginning?Hello everyone! What do you think about XAUUSD right now?
Yesterday, XAUUSD extended its decline and is currently trading around 3,315 USD.
The recent drop in gold prices was mainly triggered by a stronger US dollar, following a trade agreement between the US and the European Union (EU).
From a technical perspective, the short-term outlook shows the beginning of a new downtrend. Notably, we see a bearish crossover in the EMA 34 and 89, along with a break of the previous upward trendline—both reinforcing the current bearish momentum.
If there’s a pullback before the next leg down, the 0.5–0.618 Fibonacci retracement zone (which also aligns with resistance and the EMAs) will be a key area to watch. This could be an ideal level for potential trade setups.
Looking ahead, the next support target is around 3,300 USD. If that level breaks, gold might aim for the 32XX region.
Do you think XAUUSD will continue to fall? Drop your thoughts in the comments!
Wishing you successful and profitable trades!

XAUUSD: Demand Rejection or Breakdown? All Eyes on 3,300 ZoneChart Analysis Breakdown (30m TF – Gold/USD)
1. Market Structure Overview
Bearish Trend Dominance:
The price has shifted into a bearish structure after a Break of Structure (BOS) to the downside, indicating bearish control after failing to sustain higher highs.
Lower Highs & Lower Lows:
A consistent formation of LHs and LLs confirms bearish momentum.
2. Key Zones & Reactions
🟩 Demand Zone (~3,300–3,310):
Current price is reacting from a clearly defined demand zone.
Strong buying wick indicates interest and potential short-term bounce.
This zone has historical significance — previous reversal point.
🟥 Supply Zone (~3,420–3,445):
Price reversed sharply from here.
This is a key liquidity zone; expect heavy resistance if price retraces.
🔵 BOS Areas Marked:
Confirmed transitions in structure:
Bullish BOS followed by a bearish BOS — great illustration of shift in control.
🟨 Consolidation Blocks:
Highlighted ranging periods show distribution/accumulation phases before breakouts.
3. Trendlines & Channel Patterns
📉 Descending Trendline:
Acts as dynamic resistance.
If price retraces to this level (around 3,330–3,340), expect potential rejection unless broken cleanly.
📈 Previous Bullish Channel (Broken):
Price moved out of a bullish ascending channel, confirming bearish intent.
4. Ichimoku Cloud Context
Price is below the Kumo cloud, suggesting bearish bias remains intact.
Future cloud is bearish.
However, short-term pullback into cloud possible (especially if demand zone holds).
📊 Forecast & Trade Idea
Scenario 1: Bullish Rejection from Demand
Price may bounce towards 3,340 (previous S/R + trendline retest).
Watch for reaction at this level.
Scenario 2: Clean Break of Demand Zone
Opens path toward deeper downside (e.g., 3,280 or even lower).
Could trigger liquidity grab before reversal.

GOLD: Bottoming Out or Just the Calm Before the Storm? – GOLD: Bottoming Out or Just the Calm Before the Storm?
Gold has dropped nearly $50 over the last 4 sessions, showing clear bearish momentum. But is this just a liquidity grab before a reversal — or are we simply pausing before another leg down?
🔍 Market Context:
Recent US–EU defence and trade agreements may have weakened gold’s short-term appeal as a safe haven.
The US dollar and equities have both gained on strong macroeconomic data, redirecting capital flows away from metals.
Overall market sentiment has tilted risk-on, putting additional pressure on gold prices.
📊 Technical Overview (12H Chart):
Price has broken below the 3342 key support zone and rejected the retest — turning it into short-term resistance.
Current range sits between:
Sell-side liquidity zone: 3301–3292
Major demand/FVG zone: 3272–3270
Above price:
Resistance at 3342, and a broader sell zone at 3370–3388 (OB + FVG + Fib 0.5–0.618)
🔧 Trade Plan (Reaction-Based — Not Predictive):
🟢 Scenario 1 – Buy (Scalp Reaction)
Entry: 3292 – 3290
Stop Loss: 3285
Targets: 3296 → 3300 → 3305 → 3310 → 3315 → 3320 → 3325 → 3330
📍 Intraday bounce play from a high-liquidity zone
🟢 Scenario 2 – Buy (Deeper Reversal Swing)
Entry: 3272 – 3270
Stop Loss: 3265
Targets: 3276 → 3280 → 3284 → 3288 → 3292 → 3294 → 3300 → Trail
📍 Potential mid-term bottom setup if liquidity is fully swept
🔴 Scenario 3 – Sell (Short-Term Rejection)
Entry: 3340 – 3342
Stop Loss: 3346
Targets: 3335 → 3330 → 3325 → 3320 → 3310
📍 Clean rejection setup if price fails to reclaim key resistance
🔴 Scenario 4 – Sell (Higher Supply Zone)
Entry: 3370 – 3372
Stop Loss: 3376
Targets: 3365 → 3360 → 3355 → 3350 → 3345 → 3340 → 3330 → 3320
⚠️ Higher risk; only valid with strong confirmation
⚠️ Risk Notes:
Be mindful of fakeouts around London and NY opens, as liquidity sweeps are common.
Wait for price to enter your zone, then react — don’t anticipate.
Strict risk management is key in a volatile environment like this.
🧭 I’ll continue monitoring how price reacts around these zones.
If this kind of structured planning resonates with your approach,
feel free to stay connected — or share your perspective in the comments.
