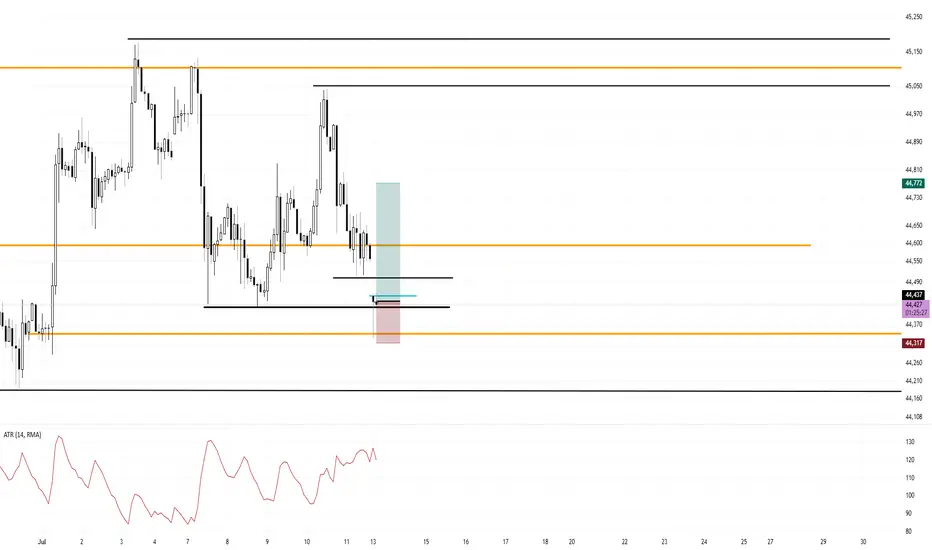
Range Bound Trade Trigger Long Dow FuturesI am Long now at 44,437
120 tick stop
335 tick target
Market gapped down, flushed the lows, tapped the monthly open by a hair and closed back inside. My stop is under the low and under the monthly open. My idea is that is will continue bullish back into the range.
Price is forming a range and mean reverting around March's Monthly Open.
February's Monthly Open was used as Resistance
I am giving this trade idea a go and if it doesn't work out, who cares. I don't know the order of my wins and losses and I must take every trade in my system.
Futures market
CL down sub $60 before moving up above $73Expected support or reversal zone based on last swing high for CL is at $60. This matches with 0.786 fib level of last move up, suggesting a standard SBS structure forming. Expecting a move up to at least $73 (fib 0.236), possibly also well beyond this.
Based on time fib of last swing high I expect the bottom to occur before July 20th.

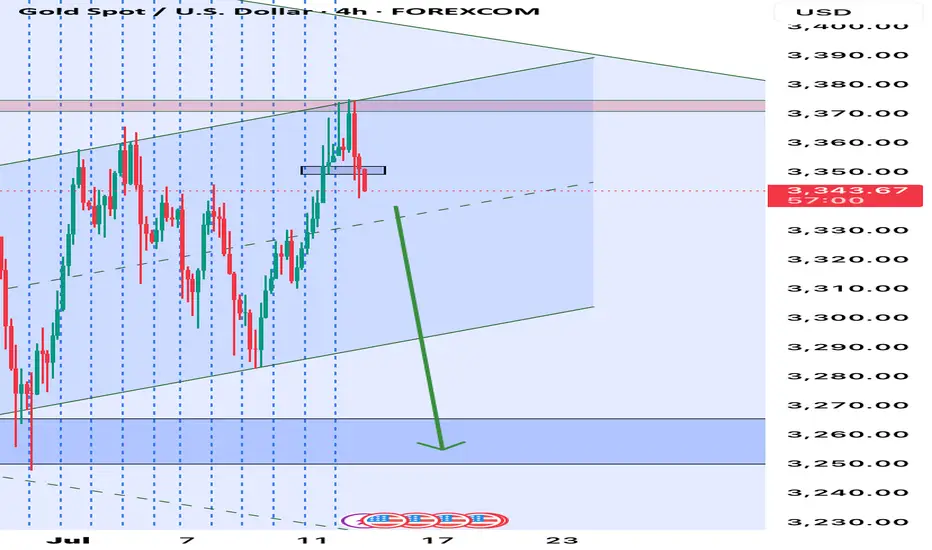
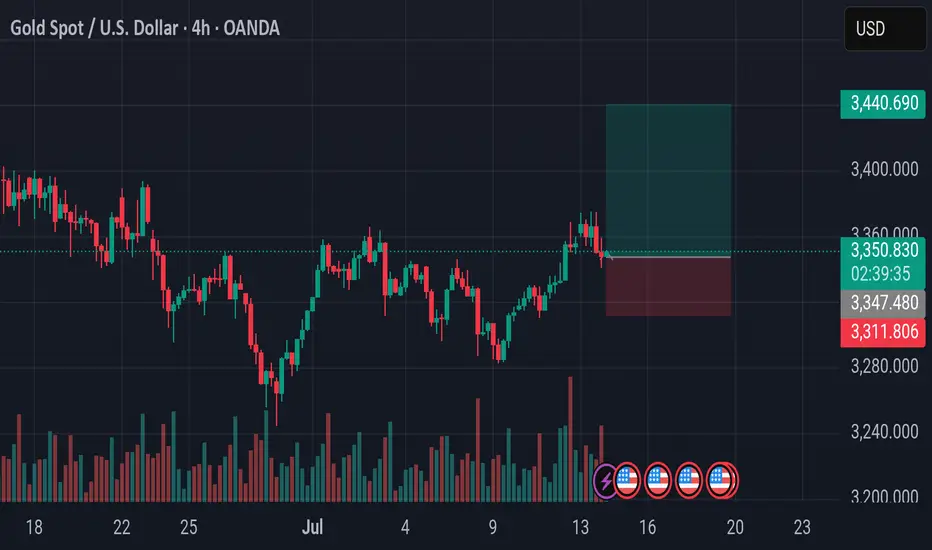
Xausd techinical analysis.This chart shows the Gold Spot price vs. the U.S. Dollar (XAU/USD) on a 1-hour timeframe, with some key technical analysis elements applied. Here's a breakdown of the key components:
---
🔍 Chart Analysis
1. Current Price:
The current market price is 3,344.875, down 0.32%.
2. Support Zones (Purple Rectangles at Bottom):
Around 3,335 – 3,340
Lower support around 3,325 – 3,330
3. Resistance Zone (Purple Rectangle at Top):
Around 3,370 – 3,375
4. **Trendline (Pink

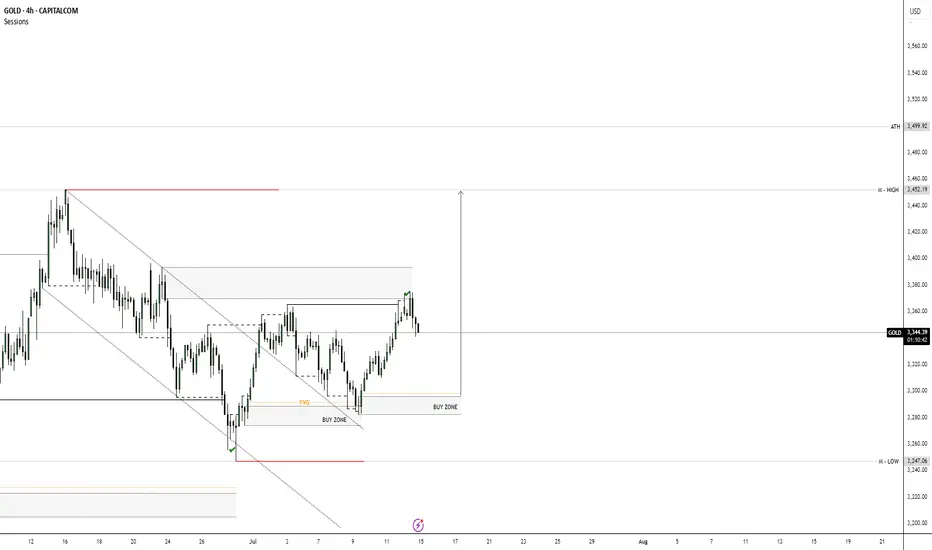
XAUUSD ANALYSYS 💸GOLD💸
Market Outlook: Bullish
• Price broke out of a downtrend channel and is now forming higher highs and higher lows — clear sign of a trend reversal.
• Current move is a pullback after a strong push up.
⸻
📍 Key Zones:
• Buy Zones and Fair Value Gaps (FVGs) are marked.
• These are areas where buyers may step in again.
• Price is pulling back into these zones — potential long entry area.
⸻
🎯 Target:
• The top red line marks a liquidity zone or resistance.
• Price is likely aiming to reach this area next.
⸻
📈 Trade Setup Idea:
• Buy on pullback to the FVG / Buy Zone.
• Stop Loss: Below the Buy Zone.
• Take Profit: At the previous high (resistance zone).
⸻
⚠️ Risk to Watch:
• If price breaks below the Buy Zone, bullish setup is invalidated — wait for new structure.
7 year gold bull run after ETF $GLD launches in 2004This begs the question, how many multi year bull run will bitcoin go for considering NASDAQ:IBIT is the most successful ETF of all time and that bitcoin is scarce.


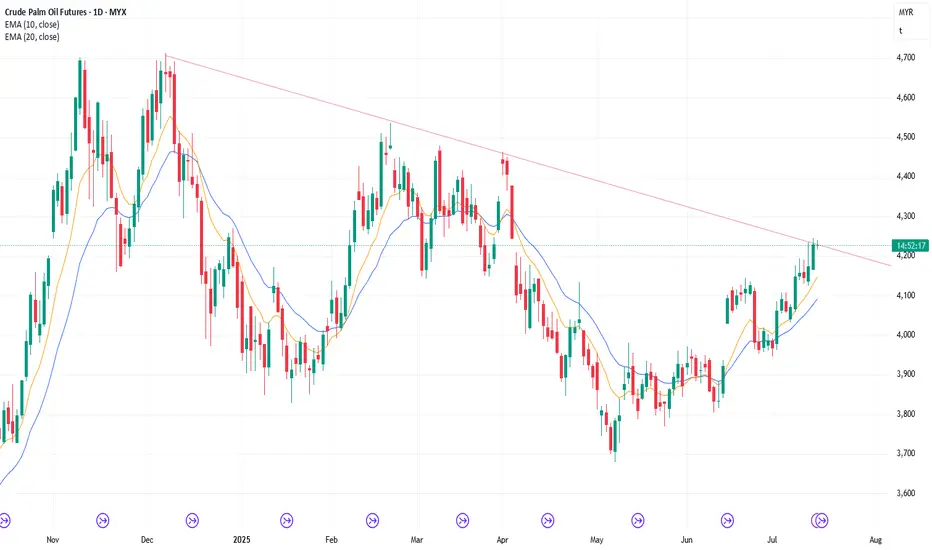
15/7/25 Bulls Need Strong FT Buying Above Bear Trendline
Monday’s candlestick (Jul 14) was a bull bar closing near its high around the bear trend line area.
In our last report, we said traders would see if the bulls could create a retest of the July 11 high or if the market would trade sideways and stall around the bear trend line area (4230-50) in the next few days instead.
The market traded higher to test the July 11 high, closing slightly below Friday's high.
The bulls got another leg up to form the wedge pattern (Jul 3, Jul 9, and Jul 14).
They want a measured move based on the first leg up (July 1 to July 3), which will take the market to around the 4260 area. The market tested the 4245 today.
The bulls need to create a strong breakout above the bear trend line with follow-through buying to increase the odds of a sustained move.
The bears want a higher high major trend reversal and a large wedge pattern (May 15, Jun 20, and Jul 14).
They want a major lower high vs the April high.
They hope the bear trend line will act as resistance. They must create strong bear bars to show they are back in control.
Production for July is expected to be around the same level as June or slightly higher.
Refineries' appetite to buy so far looks decent.
Export: The data is mixed, and the outcome remains to be seen—estimates down 6% in the first 15 days.
So far, the follow-through selling by the bears is still limited. The buying pressure is stronger.
For now, traders will see if the bulls can create more follow-through buying, or if the move will start to stall around the bear trend line area.
For tomorrow (Tuesday, Jul 15), traders will see if the bulls can create a strong breakout above the bear trend line.
Or will the market trade sideways and stall around the bear trend line area (4250-70) in the next few days instead?
Andrew
07/14 Nasdaq TradeThis time I had to wait for the red candle to create the wick for me to enter. I just needed that because we already had enough volume. Nasdaq is dangerous with this type of time frames. So review
Yellow Part: Variation
Blue Part: The wick that the red candle was creating for me to enter mroe confidently and using the wick as a stop loss.
Red Part: Execute the volume is on your side

It was good that you waited. Now here's a way to get involved. Over the weekend we took a look at Silver and predicted that we'd probably see an emotional reaction on the open where a lot of (casual traders) look to get involved (due to the headlines) and unfortunately, pay the price for being late.
Now that, that initial group has been shaken out of the market, I want to revisit the metal and show my preferred area for entry along with a conservative approach that you can use if you want to get in earlier.
Please leave any questions, comments, or your trading ideas below.
Give me a follow that way you don't miss my next trading idea.
Akil

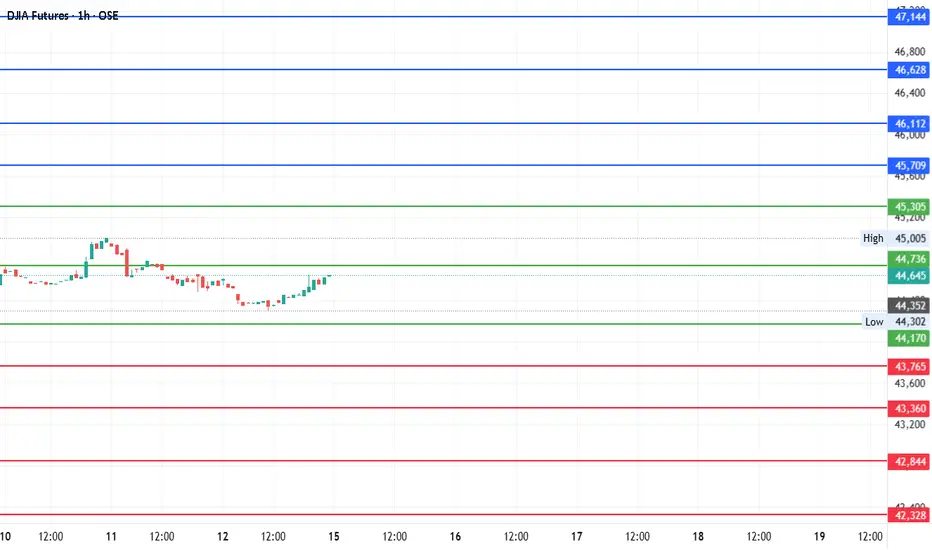
#DJI Futures Outlook: Key Levels to Watch Around Pivot 44,736Date: 14-07-2025
📊 Current Price: 44,645
📍 Pivot Point: 44,736.00
🔼 Upside / Bullish Scenario
If the price sustains above the pivot point (44,736), it could target the following resistance and bullish targets:
Immediate Resistance: 45,305.40
Target 1: 45,708.70
Target 2: 46,112.00
Target 3: 46,628.00
Target 4: 47,144.00
Bullish Bias Trigger: A break and hold above 45,305.40 increases confidence in these targets.
🔽 Downside / Bearish Scenario
If the price moves and holds below the pivot, the focus shifts to support levels and bearish targets:
Immediate Support: 44,170.04
Target 1: 43,765.02
Target 2: 43,360.00
Target 3: 42,844.00
Target 4: 42,328.00
Bearish Bias Trigger: A break below 44,170.04 opens the door to these downside levels.
#DowJones #TradingView #StockMarket #Investing #Trading #DJIFutures
#PivotPoints #DowJones #MarketOutlook #FuturesTrading

break above 6866.1 may push prices toward the second resistance break above 6866.1 may push prices toward the second resistance at 6911.3 (TP2).
Confirmation of bullish continuation would occur if price closes above 6981.0 on a 4H or daily chart.
Volume and momentum indicators should be monitored near 6866–6911 to assess breakout strength.
This trade setup offers a favorable risk-reward ratio with a tight SL at 6522 and layered targets.
Ideal buy entries can be placed between 6630–6660, as this range shows price stability and potential reversal signs.
Traders should stay alert for fundamental news (inventory reports, geopolitical events) that could accelerate momentum past resistance levels
is currently trading at 6648.3, positioning itself within an attractive short-term buy zone.
This level sits just above strong support at 6522, which acts as the logical stop-loss (SL) zone.
The price action suggests bullish potential as it forms a base near the support level.
Immediate resistance lies at 6866.1, which could be the first profit target (TP1).

Silver (XAG/USD) Bullish Trade Setup from Key Support ZoneXAG/USD (Silver) Trade Analysis – 2H Chart (July 2, 2025)
🔹 Trade Setup Overview:
Entry Point: 35.84299
Target (TP): 37.32540
Stop Loss (SL): 35.59483
Current Price: 36.36350
Risk/Reward Ratio: ~5.9:1 (Very favorable)
🔹 Technical Insights:
Support Zone:
Price recently tested and respected a strong demand zone between 35.60 – 35.84, which has now acted as a bounce level.
Multiple wicks and rejections at this zone highlight buyer interest.
Moving Averages:
50 EMA (red) is starting to flatten, possibly hinting at momentum reversal.
200 EMA (blue) held as dynamic support during the last dip — a bullish signal.
Breakout Potential:
Price has bounced off the entry zone and is approaching minor resistance near 36.40–36.60.
A clean break above this area can trigger momentum toward the 37.30s.
Volume & Momentum:
The latest candle shows strong bullish momentum, validating the bounce setup.
No sign of exhaustion yet.
🔹 Strategy Suggestion:
Entry has already occurred or is slightly above entry zone — ideal for aggressive traders to ride the momentum.
Conservative traders may wait for a pullback near 36.00–36.10 before entering.
SL is well-placed below previous lows and structure — reasonable protection.
🔹 Conclusion:
This setup reflects a bullish continuation trade from a strong support zone. Given the risk/reward profile and recent bullish action, this trade is technically sound as long as price stays above 35.84. A close below this level could invalidate the setup

Gold and DXY. Day before CPI 14.07.2025, MondayExplaining about the thoughts on CPI. Expect major movements on GOLD
