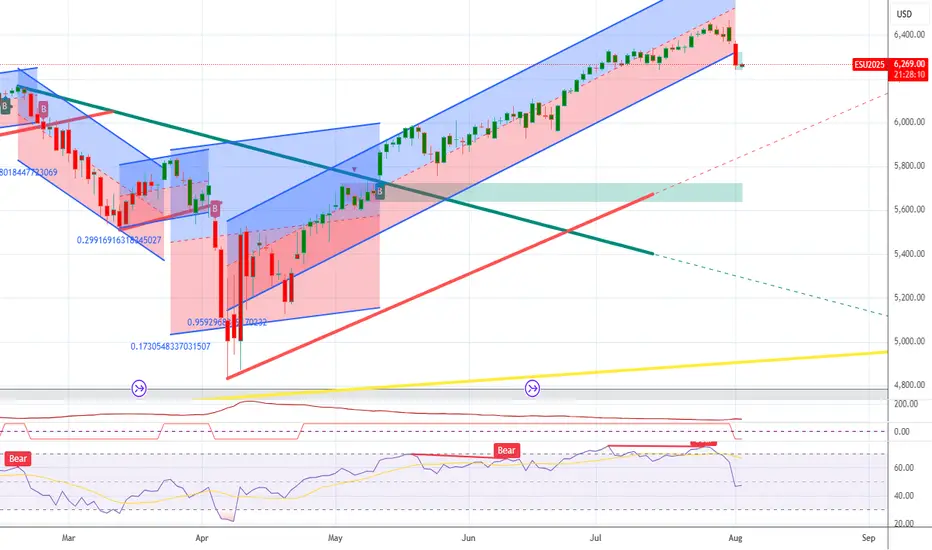
XAU / USD Daily ChartHello traders. We are at an area of interest for me which is marked on the chart. We can push down to fill that wick, or reject and move back up a bit to take out any existing short positions in profit. I will post a lower time frame chart shortly. We will see Pre NY volume starting in a little under 2 hours. 7:20 am est here in the US is when we someimes see a shift to sometimes partially correct the overnight session's move. Not saying that's what will happen, just explaining what I see happen a lot of the time. Let's see how things play out. Be well and trade the trend. Shout out to Big G.
Futures market

Gold Bulls Reloading at 3360 zone? I’ll Wait for the BounceOur last Gold setup played out beautifully — moved over 500 pips from signal to swing high.
Watching how price reacts around 3360 now
Price retesting a key demand zone around 3360 after a strong rally.
I’m patiently watching this level for signs of bullish continuation back toward 3400.

Gold Extends Gains as USD Weakens📊 Market Overview:
Gold prices are extending their gains during the Asian and European sessions today, as the US dollar weakens following weaker-than-expected US jobs data. Rising unemployment and a softer Non-Farm Payroll report boosted expectations that the Fed may cut interest rates in September. The US 10-year Treasury yield also dipped slightly, supporting gold's safe-haven appeal.
📉 Technical Analysis:
• Key Resistance: $3,385 – $3,390
• Nearest Support: $3,365 – $3,370
• EMA: Price is trading above the EMA 09, indicating a short-term bullish trend
• Candles / Volume / Momentum: H1 candles show steady buying pressure with stable volume, but we should monitor potential profit-taking if price nears the $3,390–$3,400 zone.
📌 Outlook:
Gold may continue to rise in the short term if USD weakness persists and bond yields stay low. However, failure to break above $3,390 could lead to a pullback toward support levels.
💡 Suggested Trading Strategy:
🔺 BUY XAU/USD: $3,365 – $3,368
🎯 TP: 40/80/200 pips
❌ SL: $3,362
🔻 SELL XAU/USD : $3,392 – $3,395 (if reversal signal appears)
🎯 TP: 40/80/200 pips
❌ SL: $3,398

Only look for BUY signal points in the current trend of Gold✏️The D1 candle closed with strong bullish force at the end of the day. The gold trend is still increasing wave 3 and there is no sign of correction. The reaction around 3385 in the Asian session this morning is being awaited to see if it is a recovery of Gold or not. The BUY strategy at important support zones is still maintained and pay attention to the price reaction of the candle.
📉 Key Levels
Support 3363-3346-3332
Resistance 3385 - 3407
Buy trigger: Confirmation of buying candle at support zones 3363-3346-3333
Target: 3400.00

GIFT NIFTY short setupGIFT NIFTY short setup
Entry - 24831
SL - 24865
Target - 24628.0
Risk Reward - Approx 1:6
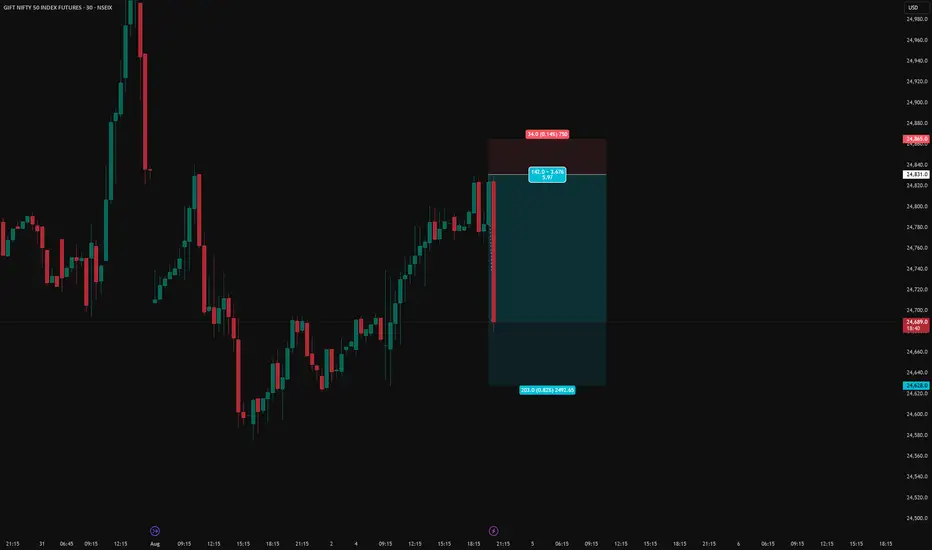
Chart Type:* XAUUSD (Gold) – 15 min chart Pattern:AscendingHere’s a simpler breakdown with highlights:
---
*🟡 Chart Type:* XAUUSD (Gold) – 15 min chart
*📊 Pattern:* *Ascending Bullish Triangle*
---
*🔹 Key Highlights:*
- *Orange Line:* Rising *support* (buyers pushing price up)
- *Purple Zone:* Strong *resistance* area (price keeps rejecting)
- *Blue Arrow:* Suggesting a *breakout* to the upside
- *White Path:* Expected *price movement* if breakout happens
---
*🎯 Target Zone (Green Area):*
Where price may go if breakout is successful
*🛑 Stop-Loss Zone (Red Area):*
Where to exit trade if breakout fails
---
📝 Simple Explanation:*
Price is going up slowly and getting squeezed. If it breaks above the purple line, a *strong bullish move* is expected.

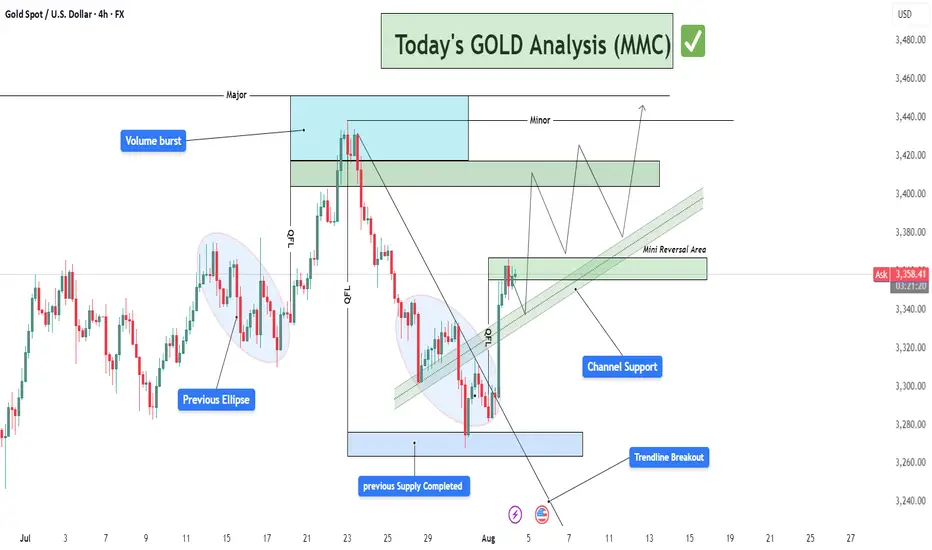
Today's GOLD Analysis : MMC Structural Analysis + Reversal ZoneThis analysis is rooted in MMC – Mirror Market Concepts, a framework designed to track institutional behavior through liquidity patterns, QFL (Quick Flip Levels), trendline shifts, and volume bursts. The current 4H Gold chart demonstrates a smart money footprint that provides actionable insight for intraday and swing traders.
🔍 Detailed Technical Breakdown:
🟦 1. Previous Supply Completed | Demand Zone Reversal
At the lower end of the chart, price entered a key blue zone around $3,250–$3,280, previously a supply zone now flipped into demand. This zone represents where institutional buyers absorbed liquidity, forming the base for a bullish impulse.
The strong reaction from this zone, marked by long-wick candles and immediate reversal, indicates exhaustion of selling pressure.
This reversal is confirmed by a QFL structure, meaning price created a fast liquidity sweep before flipping direction.
MMC recognizes this as a high-probability area of reversal, a point where smart money typically enters.
📈 2. Trendline Breakout & Structure Shift
A descending trendline, representing bearish market control, was decisively broken to the upside. This shift marks:
End of the corrective phase
Beginning of a bullish structural change
Buyers now control the short-term narrative
The breakout was not only clean but also supported by a volume burst, which is a classic MMC indicator that institutional traders are entering the market.
🔶 3. Volume Burst Confirmation
Volume behavior plays a critical role in MMC. We see a clear volume spike post-breakout. This suggests that:
The breakout is not false
Buyers were aggressively positioned
A sustainable move is in development
This supports the validity of the trendline breakout and confirms the idea that price is ready to test higher liquidity zones.
🟢 4. Current Price Structure: Bullish Channel
After the breakout, the market formed a bullish channel, where price is steadily climbing while respecting parallel boundaries.
The channel support line acts as a dynamic entry point for retracement buys
MMC strategy uses this structure to identify scaling entries at channel lows or after successful pullbacks into key reversal zones
🟩 5. Mini Reversal Area (Short-Term Resistance Zone)
Price is currently testing a minor supply zone or what MMC defines as a "Mini Reversal Area". This is a reaction zone before continuing toward the major target above.
There are two possible reactions:
Short-term rejection, leading to a pullback into the lower channel support zone
Minor consolidation, forming a base for a breakthrough toward major resistance
🟦 6. Major & Minor Supply Zones Above
Marked in light blue and green, these zones represent areas where previous selling volume and distribution occurred.
The major supply zone (approx. $3,440–$3,470) is the next institutional target
The minor zone sits between $3,400–$3,420 and may cause initial resistance or a base for another impulse
These levels are prime for partial profit-taking or scouting short-term reversal trades.
📊 Trade Management Insights:
🛒 Buy Opportunities (Long Bias):
On pullback into channel support near $3,340–$3,350
On bullish confirmation from mini reversal area
On break and retest above minor resistance at $3,420
🛑 Stop-Loss Suggestion:
Below the channel support or below the blue demand zone (approx. $3,245)
🎯 Profit Targets:
TP1: $3,400 (first resistance)
TP2: $3,420 (minor supply)
TP3: $3,450–$3,470 (major institutional level)
🧠 Mirror Market Concepts (MMC) Highlights:
QFL Structures = Institutional Reversal Points
Volume Burst = Confirmation of Breakout Validity
Trendline Breakout = Momentum Shift
Channel Structure = Controlled Climb Pattern
Mini Reversal Zone = Key Decision Point Before Continuation
🧭 TradingView Summary for Minds Community:
This GOLD chart beautifully aligns with the MMC method — spotting smart money involvement early and aligning with their flow. After confirming structural reversal via trendline and QFL, the setup now looks poised for continuation toward the $3,440–$3,470 zone, making it a perfect chart to watch for buy-the-dip setups.
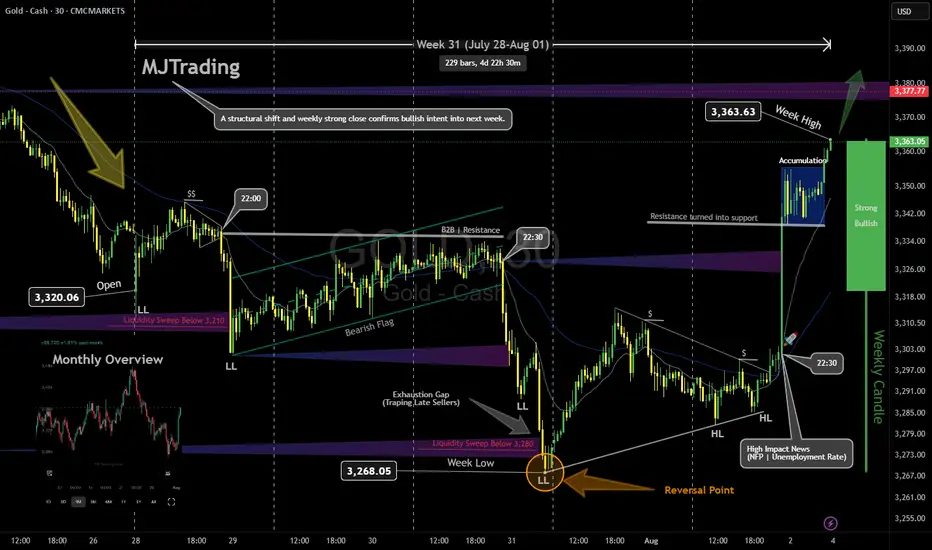
GOLD Weekly Recap & Outlook (Week 31 | July 28 – Aug 01)Note: Some elements may shift depending on your screen size. View the full snapshot in perfect layout:
📈 CAPITALCOM:GOLD
Timeframe: 30m | MJTrading View
⸻
🔹 Weekly Performance
• Open: 3,320.06
• High: 3,363.63
• Low: 3,268.05
• Close: 3,363.05
Gold delivered a classic Smart Money move this week: liquidity sweep, structural shift, and bullish expansion.
⸻
🔹 Price Action Breakdown
1️⃣ Early Week: Bearish Continuation
• Price opened around 3,320 with a gap and extended last week’s bearish leg.
• Formed lower lows (LL) and a bearish flag, signaling continuation.
2️⃣Midweek: Liquidity Grab, Reversal Point and
• Last Bearish leg marks the exhaustion gap and stop run.
• Market printed a liquidity sweep below 3,310 then 3,280 (weekly low), trapping late sellers.
• Smart Money likely absorbed sell-side liquidity before initiating the reversal leg.
• This aligns perfectly with SMC principles: sweep → accumulation → expansion.
3️⃣ Late Week Rally
• Following NFP & Unemployment Rate news, price broke 3,333 and rallied strongly to 3,363.63 confirming a Bullish Market Structure Shift (MSS).
• Resistance turned into support, validating the accumulation phase.
• Price rallied strongly to 3,363.63,.
• The weekly candle flipped bullish, closing near the high, with Smart Money leaving a clear footprint of accumulation and expansion.
⸻
🎯 Key Levels & Outlook
• Support: 3,355 → 3,333 - 3,340
• Resistance: 3,377 → 3,380+
• Bias: Bullish above 3,333.
• Watch for liquidity sweeps of intraday lows to catch new long entries, targeting 3420-3440.
⸻
💡 MJTrading View:
A structural shift and weekly strong close confirms bullish intent into next week.
As long as 3,333 holds, dips are buying opportunities.
⸻
Please share your opinions...
#MJTrading #GoldAnalysis #SmartMoney #LiquiditySweep #PriceAction #MarketStructure #Forex #TradingView #ChartDesigner #BullishMarket
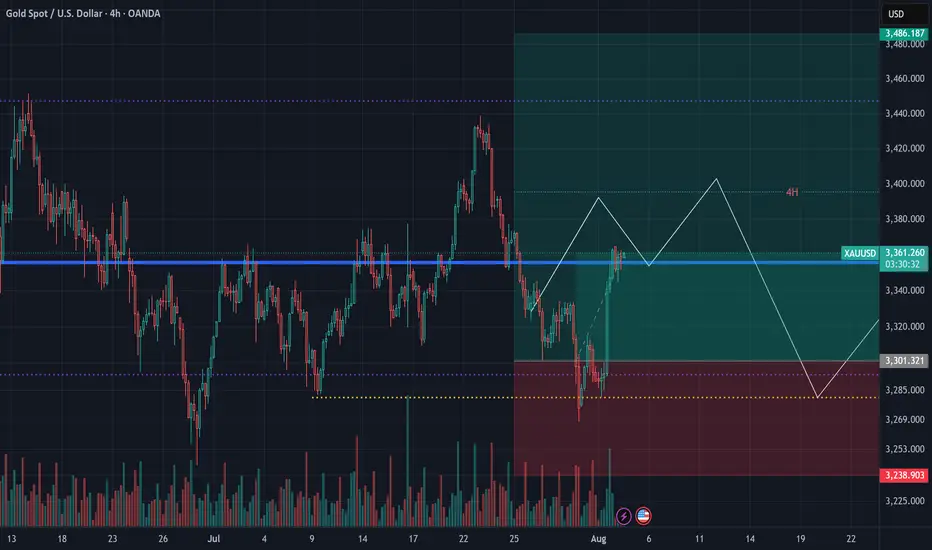
Fortnight Overview:
Psychology Always Matters:
XAUUSD Technical Outlook – August 4, 2025Last week, prior to Powell’s speech, we expected a move down to the $3280 area.
While we anticipated a brief pullback to lighten liquidity around $3400 first,
price instead dropped straight down without a bounce.
✅ The reaction at our level was spot-on,
culminating in a weekly close above $3360 — very bullish.
With liquidity around $3370 already cleared,
we don’t expect strong resistance ahead.
📈 The preferred strategy for this week: Buy gold.
🎯 A solid entry zone lies between $3320–$3330.
⚠️ For those insisting on counter-trend trades,
we strongly advise keeping targets small.
XAUUSD Technical Analysis – Bullish Continuation SetupXAUUSD Technical Analysis – Bullish Continuation Setup
📊 Market Structure Overview:
The chart shows a clear bullish structure shift, marked by multiple Break of Structure (BOS) events that validate strength from buyers. After forming equal lows and a liquidity sweep at the strong support zone, price has aggressively moved higher, breaking through minor resistance levels and showing clear bullish intent.
🧱 Key Technical Elements:
🔹 1. Strong Support Zone (Demand Rejection)
Price respected the strong demand zone between $3,260 – $3,280, where aggressive buying was seen after forming a bullish engulfing breakout. This zone aligns with previous demand and a major BOS, confirming institutional buying interest.
🔹 2. Bullish Order Flow & Break of Structure (BOS)
Multiple BOS levels across July and early August highlight a sequence of higher highs and higher lows, indicating trend continuation.
The most recent BOS after July 30 shows an impulsive break, confirming bullish dominance and clean order flow.
🔹 3. Fair Value Gaps (FVGs)
Bullish FVG (Mid-July): Price respected and bounced from this zone, showing previous imbalance was filled and used as a base for continuation.
New FVG (Above $3,420): The current upside target lies within this area, acting as a magnet for price due to unfilled orders.
🔹 4. Buy-Side Liquidity & Target Zone
The market is approaching a buy-side liquidity zone around $3,385, a key short-term target where previous highs and stop orders are likely pooled.
If liquidity above $3,385 is taken efficiently, price may expand into the FVG zone between $3,420 – $3,460.
🔹 5. Bullish Confirmation & Momentum
The candle structure shows a clean bullish impulsive move, followed by minor consolidation—likely a bullish flag/pennant indicating potential for further continuation.
Momentum is favoring buyers, and short-term consolidation above $3,340 is healthy for continuation.
🔐 Liquidity & Institutional Narrative
Equal Lows (EQL) and FVG fills suggest prior liquidity was swept and used to fuel institutional long positions.
The recent BOS confirmed that smart money has shifted bias toward longs, and price is now targeting remaining inefficiencies to the upside.
The clear alignment of BOS, liquidity sweep, and bullish FVGs reinforces a strong institutional footprint on this move.
🔍 Key Levels to Watch:
Level Type Price Zone (USD)
🔺 Resistance / FVG 3,420 – 3,460
🎯 Immediate Target 3,385
📉 Short-Term Support 3,340 – 3,320
🛡️ Major Demand Zone 3,260 – 3,280
📌 Conclusion & Outlook:
XAUUSD has initiated a strong bullish leg from the demand zone, confirming accumulation and structural reversal. Price is now moving toward the buy-side liquidity target of $3,385, with potential continuation toward the FVG resistance zone of $3,420–$3,460.
As long as price remains above the $3,320 structure support, the bullish bias remains intact. Any pullbacks should be seen as buying opportunities, especially on lower timeframe confirmations.

WTI Crude Oil (USOIL) Technical Analysis:WTI is currently trading near the $65.90 support zone after a strong break below $67.00, indicating increased downside risk if no buying interest appears.
🔹 Bearish Scenario:
If the price breaks below $65.00 and holds, the next support target may be around $62.00.
🔹 Bullish Scenario:
If the price recovers and breaks above $67.00, it could move to retest $69.50, and if bullish momentum continues, potentially extend to $70.50.
⚠️ Disclaimer:
This analysis is not financial advice. It is recommended to monitor the markets and carefully analyze the data before making any investment decisions.

GOLD Key Levels to Watch After Bullish Break Gold is showing strength after last week’s breakout above key levels.
In this short video, I highlight the zones I’m monitoring for potential reaction or continuation.
I also publish a free weekly market outlook blog every Sunday covering setups on Gold, EUR/USD, GBP/USD and more.
📰 Find the blog link on my TradingView profile no signup required.
Let’s stay sharp this week. Trade safe!

SP500 ShortSP500 is now net short on the regression break.
I am short the Russell2000 from last week and I am considering this trade into Summer.
Gold Technical Analysis - Bullish Momentum or Pullback Ahead?Gold (XAU/USD) is trading around $3,371, showing a bullish bias within an ascending channel. Price is consolidating below key resistance at $3,384, and a breakout above this level could lead to a rally toward $3,400–$3,429. On the downside, support lies at $3,340 and $3,312; a break below these could trigger a deeper pullback toward $3,268. The trend remains bullish above $3,340, with buy interest expected on dips, while a confirmed breakdown below $3,268 would shift momentum in favor of bears.
🔑 Key Levels to Watch:
- Resistance: $3,384 → $3,396 → $3,429
- Support: $3,360 → $3,340 → $3,320
📈 Potential Scenarios:
- Bullish: If gold holds above $3,340 and breaks above $3,384, it may rally toward $3,400–$3,429, with potential to reach $3,450+. This keeps the uptrend intact.
- Bearish: If rejected from $3,384, gold could dip to $3,340–$3,312 for a healthy correction before possibly bouncing again. Trend remains bullish unless lower supports break.
📊 Trend Outlook:
- Short-Term Trend: Bullish while inside or above the rising channel
- Medium-Term Trend: Neutral to Bullish; watch for breakout confirmation above $3,384
- Momentum: Consolidating, with potential for a breakout after current sideways structure
Note
Please risk management in trading is a Key so use your money accordingly. If you like the idea then please like and boost. Thank you and Good Luck!

Gold is fluctuating at a high level. Latest analysis.On Monday, gold surged to around 3370 in the morning before retreating slightly. It fell back to support near $3345 in the European session. The dividing line between bulls and bears lies below 3340, which also marks the support level and the top-bottom reversal before the close of last Friday's non-farm payroll report.
Quaid planned to go long near 3340 on Monday, but the price rebounded to 3345, halting its decline and then fluctuating sideways, preventing an entry opportunity. However, a short opportunity near 3385 was successfully implemented with a slight pullback. Although it did not reach the expected target, a small profit was achieved after the pullback to 3370.
Monday showed an overall upward trend, with the closing price fluctuating at a high level, reaching a high around 3385 before retracing to confirm 3370. The overall market trend remains upward, with a temporary potential for a move to around $3400. Quaid recommends a buy-on-low strategy today. Currently, the 1-hour moving average is trending flat, and the trend of prices continuing to fluctuate at high levels cannot be ruled out.
Support for Tuesday's pullback lies near 3370. The key to a renewed rally lies at 3360, also the level of resistance before Monday's US market opening. As long as this level remains intact, the overall strategy remains unchanged. Alternatively, watch for a re-break of 3385, with upside targets at 3385-3390-3400.
Strategy:
Long at 3360-3365, stop-loss at 3355, profit range at 3380-3400;
Short at 3395-3400, stop-loss at 3410, profit range at 3370-3350;
Key Points:
First Support Level: 3370, Second Support Level: 3360, Third Support Level: 3350
First Resistance Level: 3385, Second Resistance Level: 3395, Third Resistance Level: 3405.

8/5: Watch for Short Opportunities Near 3400Good morning, everyone!
On Wednesday, gold held above the key support area at 3343–3337, and subsequently broke through the 3372–3378 resistance zone, leading to a strong bullish move and solid long-side gains.
Today, attention should shift to the major resistance around 3400. If bullish momentum continues, price may approach the secondary resistance near 3420. However, from a technical perspective, signs of bearish divergence have begun to emerge. Should price continue rising while momentum weakens, the risk of a short-term correction increases accordingly.
Key levels to monitor:
Primary resistance zone: 3404–3416
Intermediate supply area: around 3398
Crucial support zone: 3372–3363 (a hold here could support further upside)
⚠️ Cautionary Note:
The US PMI data release during the New York session could introduce volatility. Be sure to maintain strict risk management and stop-loss discipline during periods of increased uncertainty.
🔁 Trading Bias for Today:
Prefer selling into strength near resistance, while cautiously considering buying on dips near support.
The 3343–3337 area continues to serve as the primary support zone, and price action around this level will be critical in determining the next directional move

180 Pips Secured on GOLD! | Sniper Strategy in Action📈 Tired of Gold Trades Going Against You? This Sniper Strategy Just Bagged +180 Pips!
Hello Traders,
Struggling with XAUUSD’s volatility?
Taking small wins but suffering big losses?
You’re not alone — and we’ve built something just for you.
🔥 Introducing GOLD SNIPER — a high-probability strategy engineered for serious Gold traders.
With a consistent 1:2 risk-reward and precision entry logic, it’s designed to help you ride big moves and avoid common traps in XAUUSD.
🚀 Today’s Live Trade Recap:
Signal 1
🟢 Buy @ 3355.91
🔴 SL @ 3349.91
🟢 TP @ 3367.91
✅ Result: +120 Pips
Signal 2
🟢 Buy @ 3368.32
🔴 SL @ 3362.32
🟢 TP @ 3380.32
❌ Result: -60 Pips
Signal 3
🟢 Buy @ 3373.29
🔴 SL @ 3367.29
🟢 TP @ 3385.29
✅ Result: +120 Pips
📊 Total Profit Today: +180 Pips
✅ What Makes Gold Sniper So Effective?
✔️ Catches real momentum, not noise
✔️ Keeps entries & exits disciplined and mechanical
✔️ Aims for high-reward trades, not scalp scraps
🎯 Want better entries and more consistent wins on XAUUSD?
📩 DM us now to get instant access and start using Gold Sniper on your TradingView chart.
If this helped you, like the idea and drop a comment — let’s grow together!
Happy Trading,
InvestPro India

GOLD: Next Move Is Down! Short!
My dear friends,
Today we will analyse GOLD together☺️
The price is near a wide key level
and the pair is approaching a significant decision level of 3,372.04 Therefore, a strong bearish reaction here could determine the next move down.We will watch for a confirmation candle, and then target the next key level of 3,363.00..Recommend Stop-loss is beyond the current level.
❤️Sending you lots of Love and Hugs❤️


XAUUSD (Gold) Intraday/Swing Trading Plan – Tuesday, 5th August Timeframe: M30 (30-Minute)
Strategy Type: Structured Buy-the-Dip with Staggered Take Profits
Market Bias: Bullish
Risk Profile: Moderate Risk, Medium Holding Duration
Trade Style: Intraday Momentum + Short Swing
🧠 Market Structure & Context
Gold continues to show a strong upward momentum in early August, with the M30 chart printing higher highs and higher lows consistently. Monday’s session closed with bullish strength above key psychological zones, suggesting the uptrend remains intact. Price is currently retracing after an impulsive move, providing a prime opportunity for a clean entry.
The M30 structure also shows a tight bullish channel, and pullbacks into confluence zones have proven to be reliable buy areas. The plan will focus on timing re-entries after each impulse leg to ride multiple profit waves toward higher targets.
🔍 M30 Trading Plan Breakdown
✅ Phase 1: Buy on Retracement to 3379 (Primary Entry Zone)
Entry Zone: 3379
Why:
Key support zone from previous structure breakout
Near 50% Fibonacci retracement of prior impulse
Price-action pivot zone where buyers stepped in Monday
Confirmation to Enter:
Bullish engulfing or hammer on M30
RSI bounce above 40–45
Price closes back above dynamic support (50 EMA)
Stop Loss:
Below 3369 (10 pips buffer beneath structure)
🎯 Target 1: 3395
Reasoning:
Short-term resistance from Monday NY session wick high
Completion of first impulse move (~1.5R target)
Action:
Take 30–40% profit
Move SL to breakeven or trail slightly below new support at 3385
Wait for pullback to enter Phase 2
✅ Phase 2: Re-Entry After Pullback (Post-3395)
Retracement Zone: 3388–3390 (bullish flag / higher low expected)
Re-Entry Trigger:
Tight consolidation followed by bullish breakout on M30
RSI remains above midline; MACD crossover confirmation optional
🎯 Target 2: 3418
Why:
Next resistance zone based on price rejection in late July
Also aligns with intraday Fibonacci extension (1.272 of the first wave)
Strong psychological + structural zone
Action:
Take 30–40% more profit
Adjust trailing SL to 3398 or dynamic support based on EMA
Monitor for pullback to hold or fade
✅ Phase 3: Final Position Hold or Re-Add on Pullback
Retracement Zone: 3405–3408 (previous resistance turned support)
Entry/Scaling Condition:
Price respects the new support zone and prints continuation candle
M30 volume and momentum remain positive
🎯 Target 3: 3443
Why:
Key psychological level near 3440–3450 resistance
Top of projected trend channel and potential supply zone
Excellent exit zone before possible reversal or profit-taking by institutions
Action:
Close remaining 20–30% of position
Optional: Watch for breakout >3443 for longer swing continuation if fundamentals align
⚠️ Risk Management Notes
Max risk per full plan: 1.5–2% of account
SLs strictly enforced at each entry
No entry during high-impact news spikes (check economic calendar)
Never chase — only execute on confirmed candle setups and risk-reward compliance
🔁 Summary Table
Phase Buy Level Target SL Action
Phase 1 3379 3395 3369 Take 30–40%, trail SL
Phase 2 3388–3390 3418 3379 Take 30–40%, trail SL
Phase 3 3405–3408 3443 3395 Take final 20–30%, full exit
📊 Indicators Used
50 EMA / 200 EMA: Confirm trend and support
RSI (14): Trend strength and bounce signal
MACD: Confirmation of momentum continuation
Volume: Increased buy-side volume confirms valid breakout after retracement
🕒 Session Timing Considerations
Asian Session: Wait for price to dip to 3379 — ideal entry zone
London Open (3pm SG time): Look for breakout toward 3395
New York Open (8:30pm SG time): Strong move possible to 3418 or 3443 depending on momentum and news catalysts

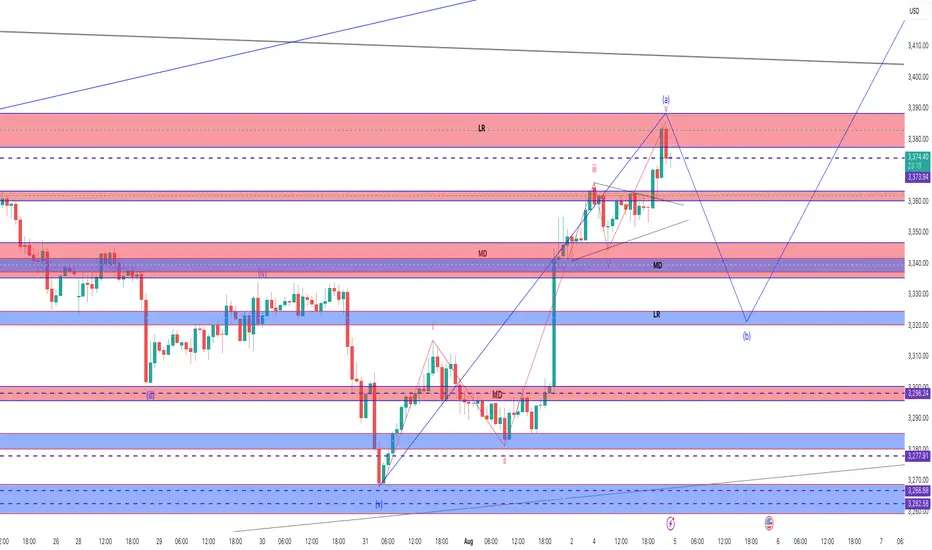
Letting the Pullback Happen – Lining Up for the Next BuyPrice just hit that tough resistance at 3,373–3,380 and started to drop—pretty much what I expected for wave (a) top. Now waiting for a wave (b) pullback. Not chasing here, just being patient.
Game plan:
Waiting for price to drop into the 3,330–3,325 support zone.
If I see a nice bounce or bullish candle in that area, I’ll look to go long.
First target: Back to the 3,373–3,380 resistance. If price smashes through, will hold a small portion for a bigger run.
Stop loss: Just below 3,320 or the latest swing low—keeping it tight.
If price goes lower, next buy zone is 3,298, then 3,278. I’ll repeat the same idea.
If price dumps below 3,262, I’m out. No interest in holding longs if support fails.
4H Gold/USD - Decoding the liquidity zones 📈 Smart Money Concept: Liquidity Grab & Market Shift
This 4H Gold/USD chart shows a classic liquidity sweep below a key level (Sell-side liquidity) followed by a CHoCH (Change of Character) — signaling a bullish market structure shift. A fair value gap (FVG) is formed as price aggressively breaks previous highs, offering a clean entry point on the retest.

XAG/USD Long Setup | H1 TimeframeA classic setup based on #SmartMoneyConcepts:
✅ Change of Character (CHOCH) after a liquidity sweep.
✅ Price returned to the Order Block & filled the FVG.
✅ Entry at the Point of Interest (POI) with a high R/R.
Waiting for it to reach the buy-side liquidity targets. Do you agree?
