XAUUSD: Buy ideaBuy idea on XAUUSD as you can see on the chart because we have the breakout with force the vwap indicator by a big green candle...
Futures market

Selling activated ▪️I'm expecting selling at 3345-3348 from my zones although I took a small risk of sell at 3342
And my Targets will be 3333-3324
▪️Secondly if H4 candle closing below 3250 I will not sell till next stability
This trade is based on liquidity sweeps
#XAUUSD
Tactical Short Setup on EURThe September 2025 Euro FX futures contract (E6U25) is currently trading around 1.1440 after topping out near 1.19 the 1st of July. This decline reflects a broader market repricing, driven by evolving expectations around monetary policy from the Federal Reserve and the European Central Bank, softening Eurozone growth prospects, and a technical backdrop that has turned decisively bearish. Coupled with shifts in sentiment and options market positioning, the current setup presents an opportunity to initiate a tactical short with an attractive risk-reward profile.
Fundamental Analysis – Central banks and diverging momentums
Monetary policies on either side of the Atlantic appear to diverge. The Federal Reserve has kept its federal funds rate steady in the 4.25%–4.50% range since December 2024, resisting political pressure to ease. In contrast, the European Central Bank has gradually lowered its deposit rate from 4% to 2.00% since mid-2024 and maintained that level in July, considering inflation is now back to its 2% target. This has widened the yield differential in favor of the U.S. dollar.
Forward guidance from both central banks suggests a cautious stance. The Fed’s June 2025 dot plot anticipates a modest rate cut by year-end, though FOMC members remain divided. Meanwhile, the ECB projects subdued inflation and modest growth, implying no urgency for further easing.
On the macro front, U.S. GDP rebounded sharply in Q2 (+3.0% annualized), though driven largely by a collapse in imports. Domestic demand and job creation have slowed, and tariffs may push core inflation above 3% again. In the eurozone, Q2 GDP barely expanded (+0.1%), with uneven performance across member states. Inflation is stable at 2%, with core pressures easing. Altogether, the dollar retains a slight edge amid firmer data and a more hawkish Fed.
Technical Outlook – Bearish shift with volume confirmation
From a technical standpoint, the E6U25 contract has clearly broken down from its prior range. The area around 1.1775, which previously served as a high-volume node and resistance, was breached with strong downside momentum. The price action has since carved out a clean pattern of lower highs and lower lows, and volume has notably increased on bearish sessions, confirming the shift in control.
The current structure suggests a vacuum between 1.1775 and 1.1500, with only minor resistance expected around 1.1545, where some residual volume lies. There is little to no support before the 1.1280–1.1300 area, which aligns with a lower volume shelf on the visible range volume profile (VRVP). If price retraces to retest the 1.1525–1.1575 zone, that area is likely to act as a tactical selling opportunity before potentially resuming the downtrend.
Sentiment Analysis
CFTC data as of late July shows asset managers holding a substantial long position in EUR/USD, though these are beginning to unwind. The positioning profile leaves the euro vulnerable to further long liquidation if the selloff deepens.
Retail sentiment reinforces this view, as most retail traders are caught on the wrong side of the move. Open interest is stable but elevated, and trading activity has begun to rise slightly, hinting at retail dip-buying that may lack conviction. No major retail capitulation has occurred yet.
Broad market volatility remains subdued, and EUR/USD-specific indicators show a similar picture. The CME CVOL Index for EUR/USD remains around 8, a level considered moderately low by historical standards, reflecting a calm, non-disruptive market environment that favors technical trading, including respect for resistance levels and trend-following strategies.
Options Analysis
According to the CME FX Options Vol Converter, the landscape for EUR/USD still exhibits a modest downside bias. Risk reversals across one to three months tenors remain slightly negative, reflecting moderate demand for euro puts.
In listed markets, CME data for August expiries shows notable open interest concentration in puts at the 1.1450 and 1.1500 strikes, with deltas indicating directional positioning rather than purely hedging activity. On the call side, interest is more dispersed but visible above 1.1650, particularly at 1.1700 and 1.1750, suggesting some appetite for upside. However, the deltas are lower.
Trade Idea
A tactical short trade is favored in the 1.1525–1.1575 zone, which coincides with a potential pullback level within a well-established downtrend. This level also aligns with a minor volume shelf, providing a natural resistance area where sellers are likely to re-enter the market.
The suggested stop level is 1.1650, just above the recent short-term swing highs, which would invalidate the current bearish structure. The target lies around 1.1290, near the next major support zone and volume cluster.
Final thoughts
The EUR/USD rally in May/June was primarily fueled by expectations of synchronized easing and softer U.S. data. However, the Fed’s reluctance to commit to a cut, combined with a relatively more aggressive ECB stance, has shifted the narrative back in favor of the dollar. With asset managers showing signs of willingness to further unwind their exposure, combined with sentiment indicators pointing to complacency, a deeper retracement remains plausible.
The technical breakdown, lack of implied vol support for a rebound, and fresh open interest on euro puts collectively argue for tactical downside continuation. The proposed trade seeks to capture that move with a controlled stop and a realistic price target. Unless EUR/USD can reclaim the 1.1650–1.1700 zone decisively, the path of least resistance remains downward.
---
When charting futures, the data provided could be delayed. Traders working with the ticker symbols discussed in this idea may prefer to use CME Group real-time data plan on TradingView: tradingview.com/cme/ .
This consideration is particularly important for shorter-term traders, whereas it may be less critical for those focused on longer-term trading strategies.
General Disclaimer:
The trade ideas presented herein are solely for illustrative purposes forming a part of a case study intended to demonstrate key principles in risk management within the context of the specific market scenarios discussed. These ideas are not to be interpreted as investment recommendations or financial advice. They do not endorse or promote any specific trading strategies, financial products, or services. The information provided is based on data believed to be reliable; however, its accuracy or completeness cannot be guaranteed. Trading in financial markets involves risks, including the potential loss of principal. Each individual should conduct their own research and consult with professional financial advisors before making any investment decisions. The author or publisher of this content bears no responsibility for any actions taken based on the information provided or for any resultant financial or other losses.

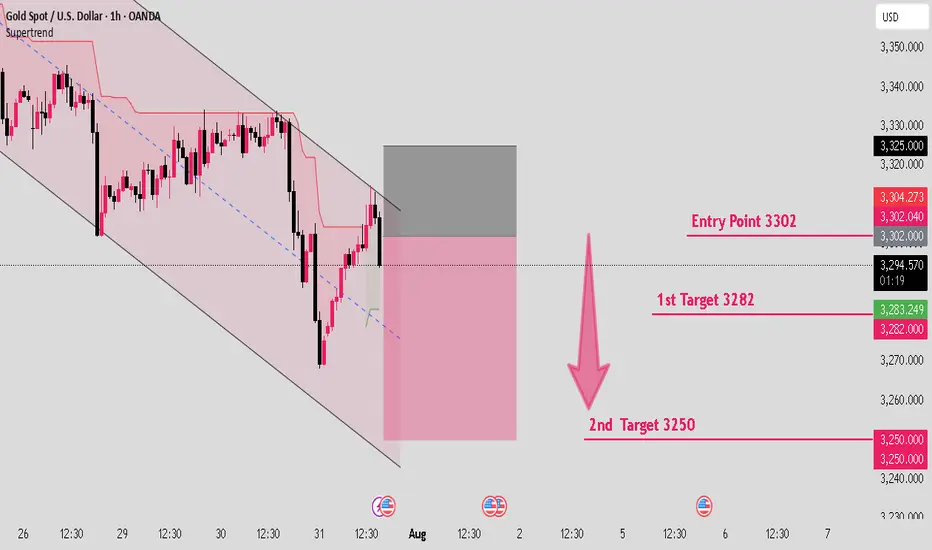
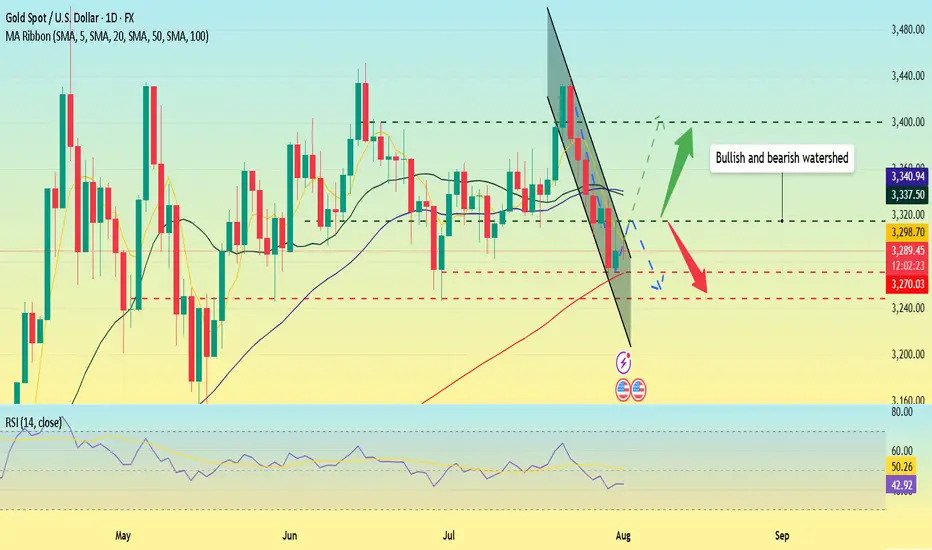
Gold is creating a downward structure in parallel channel.Hello IGT FOLLOWERS
Here is my gold overview, According to me gold will fall because it is continously working in a downward parallel channel.. Bearish momentum visible on lower timeframes (1H-4H) • Price Structure: Recently rejected from $3,320-$3,325 resistance zone Forming lower highs and lower lows- suggesting short-term downtrend continuation..
Key points :
Entry point : 3302
1st Target : 3282
2nd Target : 3250
Follow me for more latest updates and signals
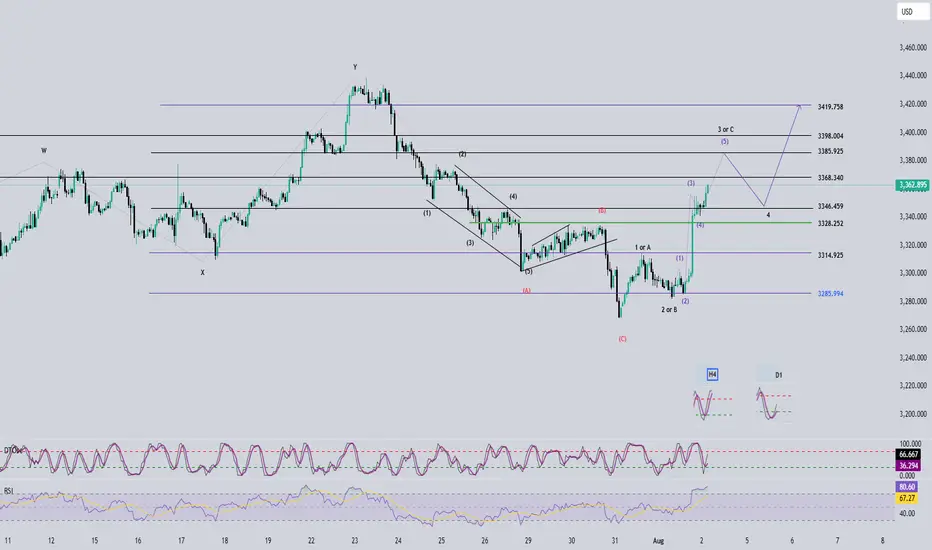
Elliott Wave Analysis – XAUUSD August 1, 2025📊
________________________________________
🔍 Momentum Analysis:
• D1 Timeframe:
Momentum has reversed to the upside. Based on this signal, we expect a bullish trend to continue for the next 5 daily candles — likely until mid-next week.
• H4 Timeframe:
Momentum has also turned upward → This suggests that from now until the U.S. session, the price will likely continue to rise or consolidate with an upward bias.
• H1 Timeframe:
Momentum is currently turning down → We anticipate a short-term corrective move. We should wait for H1 to enter the oversold zone and give a bullish reversal signal before looking for long entries.
________________________________________
🌀 Wave Structure Analysis:
The current wave structure remains complex and lacks clear confirmation. Thus, the current wave labeling should be considered provisional. However, the wave count has not been invalidated, and D1 momentum supports a bullish outlook — so we continue to maintain our wave structure bias.
Important Note:
Wave (C) in red appears relatively short. This leaves open the possibility that the price may continue lower, targeting:
• ⚠️ 3246
• ⚠️ 3200
→ This scenario will be triggered if price breaks below 3268, especially given today's Nonfarm Payroll (NFP) report.
________________________________________
📌 Two Possible Wave Scenarios:
1. Scenario 1: Black Waves 1 – 2 – 3
o Wave 1 (black) is complete.
o We are now in Wave 2 (black) → Preparing for Wave 3.
o Wave 3 tends to be strong, impulsive, and sharp with large candle bodies.
o Target: 3351
2. Scenario 2: Black ABC Correction
o The market is currently in Wave B (black).
o Potential target for Wave C: 3328
________________________________________
🛡 Support Zones & Trade Strategy:
• Support Zone 1: 3290 → A good area for potential buying, but we must wait for H1 to enter the oversold region and show a bullish reversal.
• Support Zone 2: 3275 → Deeper buy zone if the price corrects further.
________________________________________
💡 Trade Plan:
📍 Option 1 – Buy Limit:
• Buy Zone: 3290 – 3289
• Stop Loss: 3280
• Take Profit 1: 3309
• Take Profit 2: 3328
• Take Profit 3: 3351
📍 Option 2 – Buy Limit:
• Buy Zone: 3275 – 3273
• Stop Loss: 3265
• Take Profit 1: 3309
• Take Profit 2: 3328
• Take Profit 3: 3351
________________________________________
📎 Notes:
• Experienced traders should wait for clear confirmation signals on H1 before entering trades.
• New traders may consider using limit orders in the proposed buy zones.
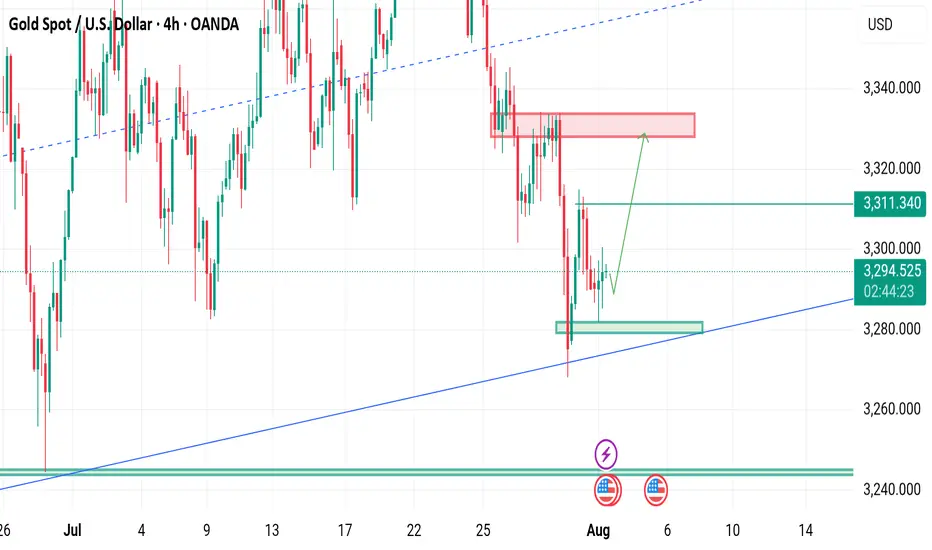
NFP ON DECK TODAY Gold is currently holding the Range of 3275-3310.
What's possible scanarios we have?
we have NFP data on deck today, expect potential volatility.
Until the release, gold may continue to range between 3275 and 3315.
This trade is totally unexpected how can gold react on numbers.
•If the H4 & D1 chart breaks below 3270, we could see a further drop toward the 3250 zone.
• Ifthe H4 & D1 chart flips above 3310, we could see a further Upside climb the 3335 -3345 zone.
Stay alert. Key levels in play.
#XAUUSD
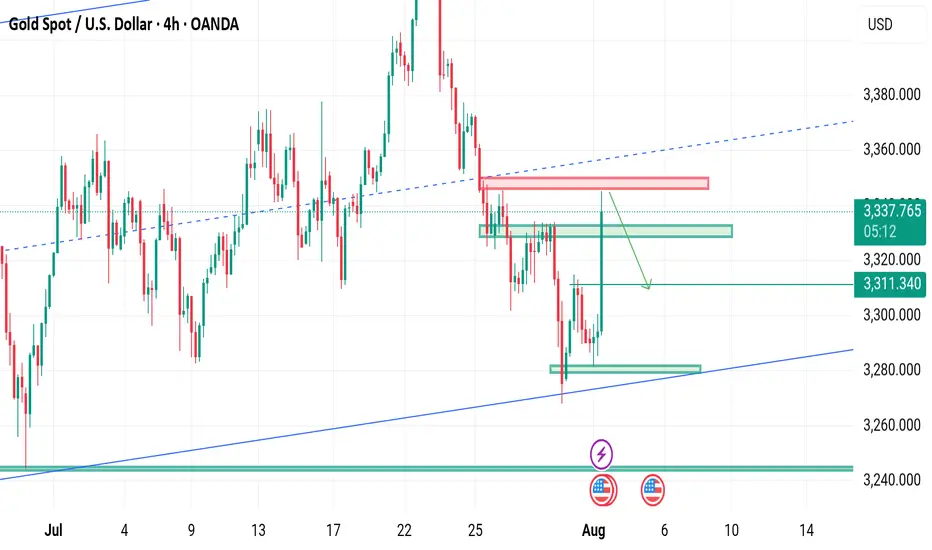
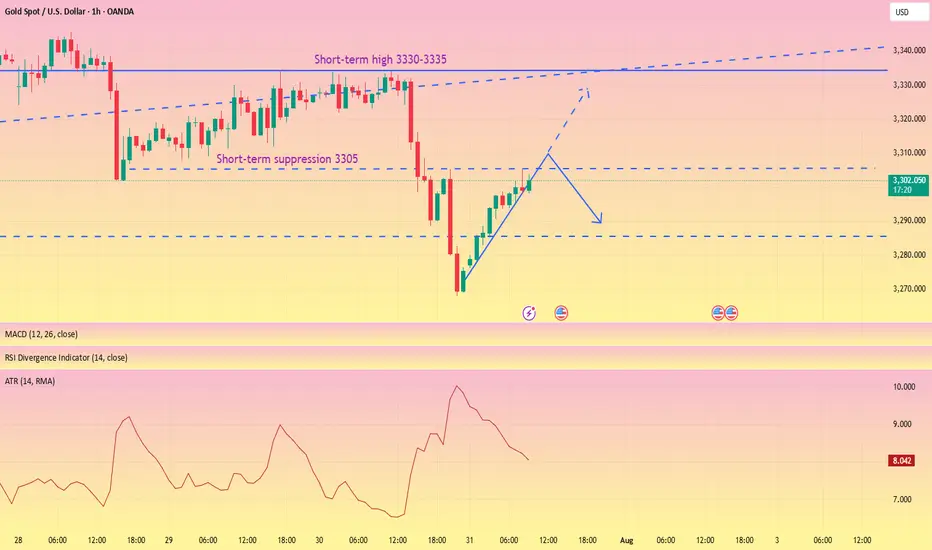
The rebound is weak, short orders intervene#XAUUSD
After two consecutive trading days of volatility, gold finally began to fall under pressure near 3335. After breaking through the 3300 mark, the price of gold accelerated its decline, reaching a low of around 3268, and yesterday's daily line closed with a large negative line. 📊
Today's rebound is more likely to be based on the buffering performance of the impact of news. The ATR data also shows that the bullish momentum is slowly weakening in the short term. 🐻After digesting the impact of yesterday's news through rebound during the day, it may fall again in the future.📉
📎The primary focus today is 3305 above, which was also the high point of yesterday's pullback correction. If the gold price rebounds to 3305-3320 and encounters resistance and pressure,📉 you can consider shorting and look towards 3290-3270.🎯
If the short-term gold rebound momentum is strong and breaks through the 3305-3320 resistance area, it will be necessary to stop loss in time. Gold may be expected to touch yesterday's high resistance of 3330-3335, which is the second point to consider shorting during the day.💡
🚀 SELL 3305-3320
🚀 TP 3290-3270
xauussWe will probably have a minor correction in this direction. We will wait for the trend line to break, if it breaks, the targets will be touched in order.

Gold rebound is weak, short below 3315
Gold remains weak, with multiple intraday rebounds failing to maintain momentum. The upper moving average continues to suppress the market, and the short-term market remains dominated by bears. Today, we are following the trend and taking a bearish stance. The key upside level is around 3315. If it reaches this level before the US market opens or if it peaks in the short term, we will short sell. The non-farm payroll data will be released today, and we will consider reversing our direction based on the situation after the data.
Gold prices have once again encountered resistance to their upward trend, and the volatile pattern continues. The gold price trend is trending lower highs, and today's low is expected to be lower than yesterday's. Therefore, our intraday short target could be 3268 or even lower, so it's crucial to seize the right entry point.
If you're new to the market, come to me. I'll teach you how to trade while you learn. If you're already in the market and struggling, come to me. I'll help you avoid repeating the same mistakes. If you've already experienced this market and are battered, come to me. I'm confident I can help you regain confidence. If you're stuck in a position, I'll develop a strategy tailored to your entry point. Because everyone's trapped positions are different, the solutions will vary, some suitable for conservative traders and others for aggressive ones. However, I can't offer a perfect answer to every situation. I suggest you bring your order with you. Once you contact me, I'll use the most appropriate method to resolve your situation and help you exit the market.
Specific Strategy
Short gold at 3315, stop loss at 3325, target at 3280

gold on third pattern breakout#XAUUSD have multiple test the third pattern, now price forming needs to breakout the 3308 before any further movement.
Buy entry 3301.4, TP 3308-3323.
Below 3291 holds a very strong bearish continuation, if breakout price will fall till 3269

XAUUSD Gold Trading Strategy August 1, 2025
Yesterday's trading session, gold prices recovered to the 3315 area and then continued to decrease to the 3281 area. Currently, gold prices are fluctuating quite unpredictably due to the impact of tariff news and investor confidence.
Basic news: The Federal Reserve FED continues to maintain the federal funds benchmark interest rate in the range of 4.25% - 4.50%, in line with policy since 2025. Chairman Powell did not give any signal about the next interest rate cut on September 16 - 17.
Technical analysis: After falling sharply to the 3269 area, gold prices are showing signs of recovery. In the current downtrend channel, there has been a higher bottom than the bottom at H1. We can see that if the bullish pattern at H1 is confirmed, combined with the reversal candlestick appearing at H4, the possibility of gold bouncing back to reach the resistance area of 3330, even 3350 is completely possible. In the weekend trading session, we will wait at the support zones to trade.
Important price zones today: 3280 - 3285 and 3269 - 3274.
Today's trading trend: BUY.
Recommended orders:
Plan 1: BUY XAUUSD zone 3283 - 3285
SL 3280
TP 3288 - 3300 - 3310 - 3330.
Plan 2: BUY XAUSD zone 3269 - 3271
SL 3266
TP 3274 - 3284 - 3300 - 3320.
Wish you a safe, favorable and profitable trading day.🥰🥰🥰🥰🥰

gold 4ooo projectionHello, me thinks gold is ready for a midterm correction, which in turn can propel it to 4ooo. This is just an idea, not financial advice. Cheers

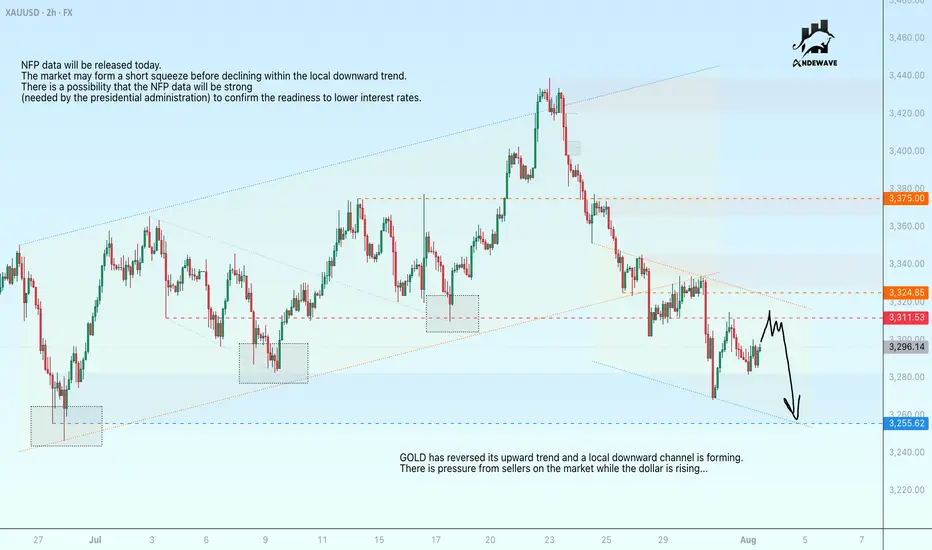
GOLD may be subject to manipulation ahead of the NFPGOLD has reversed its upward trend and a local downward channel is forming. There is pressure from sellers on the market while the dollar is rising...
NFP data will be released today. The market may form a short squeeze before declining within the local downward trend.
There is a possibility that NFP data will be strong (needed by the presidential administration) to confirm the readiness to lower interest rates.
Scenario: ahead lies a strong resistance zone at 3311.5 - 3324.85. The formation of a false breakout could intensify bearish pressure, leading to a decline in prices to 3255
Gold continues to go long in the 3280-3300 range.Gold continues to go long in the 3280-3300 range.
Today, we remain firmly bullish on a bottom in the 3280-3300 range.
On August 1st, the Federal Reserve, while keeping interest rates unchanged, acknowledged slowing economic growth, triggering a repricing of expectations for a rate cut.
This led to a rebound in gold prices, but of course, this was just a pretext for the price increase.
Recently, gold prices experienced a four-day decline (July 23-28), falling from $3431 to $3268, as progress in trade negotiations and a rebound in the US dollar dampened safe-haven demand.
Non-farm Payrolls
Here are the key takeaways:
Today's US July non-farm payrolls data (expected to increase by 110,000, compared to 147,000 previously) will determine expectations for a September rate cut by the Federal Reserve.
A weak reading (e.g., below 100,000) could push gold prices back towards $3,400;
A strong reading (above 150,000) would remain bearish for gold. Gold prices continue to decline, and we are long in the 3280-3300 range.
Today, we remain firmly bullish on gold bottoming in the 3280-3300 range.
On August 1st, the Federal Reserve, while keeping interest rates unchanged, acknowledged slowing economic growth, triggering a repricing of rate cut expectations in the market.
This led to a rebound in gold prices, but of course, this was just a pretext for the price increase.
Recently, gold prices experienced a four-day decline (July 23-28), falling from $3431 to $3268, as progress in trade negotiations and a rebound in the US dollar dampened safe-haven demand.
Non-farm Payroll Data
Here are the key takeaways:
Today's US July non-farm payroll data (expected to increase by 110,000, compared to 147,000 previously) will determine expectations for a September rate cut by the Federal Reserve. A weak reading (e.g., below $100,000) could push gold back to $3,400.
A strong reading (above $150,000) would continue to be bearish for gold.
Technical Analysis and Trading Recommendations
Key Levels:
Support:
$3,270 (100-day moving average)
$3,248 (June low);
Resistance:
$3,300 psychological level
$3,340 (21-day/50-day moving average crossover).
Trading Strategy:
Short-term:
1: If the price holds above $3,300, initiate a long position with a target of $3,330-3,350.
2: If the price falls below $3,270, a drop to $3,248 is possible.
3: Focus on the key watershed at $3,300
4: Key Point:
As long as the gold price is above $3,300, I believe it's a good time to buy the dip. Following the upward trend in gold prices is a very wise choice.
As shown in Figure 4h:
The potential for gold prices to rebound is becoming increasingly clear.
The lower edge of the wide fluctuation range is slowly stabilizing.

US OILShort term bearish view in US OIL, I want price to drop below the OLD Low before continuing the upside momentum
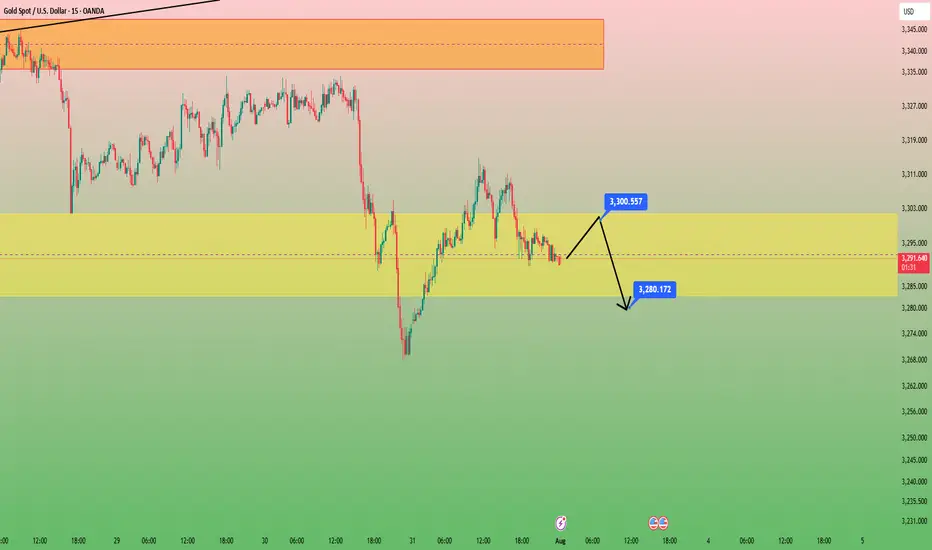
GOLD in 15minHello to all traders. 😎😎
I hope all your deals will hit their targets. 🎉🎉
After yesterday's heavy drop on the last day of July. We had a weak growth.
I think the price will retest $3300 and we will have another drop to the $3280 area. Look for short positions in the $3300 area.
Remember that this is an analysis and be sure to do money management when trading.
What Do You Think?
Which scenario do you think is happen? **Share your thoughts!** ⬇️
Don't forget that this is just an analysis to give you an idea and trade with your own strategy. And don't forget the stop loss🛑🛑🛑
❤️❤️❤️The only friend you have in financial markets is your stop loss❤️❤️❤️
Please support me with your ✅' like'✅ and comments to motivate me to share more analysis with you and share your opinion about the possible trend of this chart with me 🙏😊
Be Happy , Ali Jamali
Impact of the Non-Farm Payrolls? Latest Analysis.Information Summary:
Most traders are turning their attention to the crucial US labor market report, which is being closely watched as the market actively searches for new clues regarding the timing of the next interest rate cut this year.
The July non-farm payrolls report will be released at 8:30 AM US time. US non-farm payrolls increased by 110,000 in July, seasonally adjusted, lower than the 147,000 increase in June. The US unemployment rate is expected to rise from 4.1% to 4.2% in July.
If the non-farm payrolls figure falls below 100,000 and the unemployment rate rises, it could signal a weakening job market, undermining the Fed's rekindled hawkish outlook and dampening the dollar's upward momentum. In this scenario, gold prices could re-cross the 3,400 mark. However, if the non-farm payrolls unexpectedly exceed 150,000, it could support the dollar's continued rise and hurt gold. Strong US employment data could rule out two rate cuts from the Fed this year.
Market Analysis:
Quaid believes that the current moving average crossover is trending downward, and downward momentum is still in play. The RSI remains at 42.7, hovering below the midline, indicating that gold's downward trend remains intact. The 20-day moving average fell below the 50-day moving average on Wednesday, confirming the bearish momentum.
Therefore, if gold closes below the key support level of the 100-day moving average at $3,270 on a weekly basis, a new downtrend could begin, potentially leading to a drop towards the June 30 low of $3,248.
Quaid believes that the current bull-bear watershed needs to focus on around 3315, which is the previous intensive trading area and is also the first resistance position for short-term upward movement.
On the last trading day of Super Data Week, Quaid hopes that everyone has gained something and has a happy weekend; I wish you all good luck.
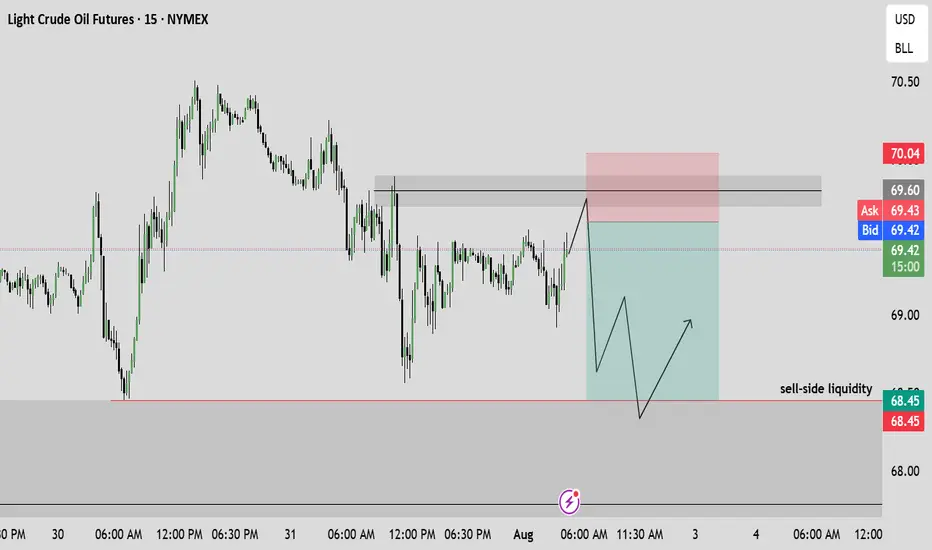
USOIL REACHED THE 6,900.00 SUPPORT LEVEL. WHAT'S NEXT?USOIL REACHED THE 6,900.00 SUPPORT LEVEL. WHAT'S NEXT?
As we told July 31, the price got reversed towards first support level of 6,900.00. Market participants are waiting for the OPEC+ meeting this week, expecting a significant output hike. Currently, the price sits slightly above the support level. Although, the asset trades above this level, considering the current weakness of the asset, further decline is expected. The 6,800.00 support level is the next target here.

GOLD REMAINS UNDER PRESSURE AFTER U.S. INFLATION DATA📊 Market Overview:
Gold is trading around $3294, down from $3311 earlier after U.S. Core PCE and Employment Cost Index came in as expected — reinforcing the Fed's hawkish stance. A stronger dollar and rising Treasury yields continue to weigh on gold.
📉 Technical Analysis:
• Key resistance: $3302 – $3305
• Nearest support: $3285 – $3275
• EMA09 (H1): Price is below the 9-period EMA → short-term trend remains bearish
• Candlestick / volume / momentum: After the sharp drop, price is consolidating between $3293–$3298 with low volume. Failure to break above $3302 may trigger further downside. RSI near 45 suggests room for more selling.
📌 Outlook:
Gold may continue to decline in the short term if it fails to reclaim $3302 and the dollar remains strong through the Asian and European sessions.
💡 Suggested Trade Setup:
🔻 SELL XAU/USD: $3296 – $3298
🎯 TP: $3280 / $3275
❌ SL: $3305
🔺 BUY XAU/USD: $3275 – $3278 (if reversal candle appears)
🎯 TP: $3295
❌ SL: $3270

Why Did I Lose XAUUSD During NFP Time .... Waiting for a Miracle
Why Did I Lose XAUUSD During NFP Time 😢 While I Was Waiting for a Miracle 😉… and Everyone Else Cashed In? 🤑
Alright, champ. Let’s break down why you lost your short trade around $3,348 per ounce, while the whole world seemed to be printing money. This one’s for the smartest and slickest trader on Egyptian soil—but explained like someone who actually understands market behavior, not someone blindly quoting a textbook. Grab a pen and paper. Let’s dig in.
⸻
🔥 Part 1: “You Faced NFP Like You’re Superman”
❌ What Happened:
• Price shot up hard after the NFP release.
• You said, “That’s too much—it must come down.”
• You went short from the top (around 3,305).
😵💫 Where You Went Wrong:
• NFP isn’t just any move—it’s nuclear fuel for the market.
• The move that follows it is usually an impulse wave—it continues, it doesn’t pull back.
• The market doesn’t drop just because it went up a lot. It drops when:
• Volume dries up.
• Buyers get bored.
• You spot negative delta or divergence.
⚠️ None of that was present when you shorted.
✅ The Smarter Mindset:
“During major news events like NFP, the market doesn’t pull back—it follows through.”
⸻
🔥 Part 2: “Volume Was Screaming in Your Face: I’m Not Done Yet!”
📊 What You Saw:
• Positive delta.
• Increasing volume.
• Big lot sizes hitting the ask side.
❌ What You Ignored:
• No divergence between effort and result.
• Buyers were still strong—no weakness.
• Price wasn’t reacting to resistance; it was smashing through it.
💡 Big Difference Between:
• Absorption = buyers easing the price up slowly.
• Rejection = buyers failing and price slapping back.
You mistook absorption for rejection—classic rookie mistake.
✅ The Real Lesson:
“As long as volume is pushing price, stick with the trend.”
⸻
🔥 Part 3: “You Misused Fibonacci Like a Hammer on a Screw”
❌ What You Did:
• You shorted at the 125%-150% Fibonacci extensions.
• You said, “Price must reverse here.”
📏 What You Should’ve Known:
These levels (138.2%, 150%, 161.8%, 200%) are not sell zones.
They are target zones for buyers, not resistance levels.
✅ The Correct Use:
• Use 125% or 138.2% as breakout buy zones.
• Take profit at 161.8% or 200%.
These are where bulls take profits—not where you blindly short just because “it went up a lot.”
⸻
🎯 Why You Can’t Just Sell There:
Because those zones are:
• Where buying continues.
• Not where it stops—unless momentum fades.
That only happens when:
• Volume drops.
• Delta turns negative.
• Rejection wicks appear.
But what did you do?
You shorted into momentum—while buying was on fire—thinking, “It must stop here!”
⚠️ Nope, bro. That train was still moving—you just stepped in front of it.
⸻
🔥 Part 4: “You Forgot Market Psychology”
🤔 What That Means:
• After NFP:
• Smart money enters early.
• Retail traders wait and watch.
• When price breaks up, retail chases → market moves more.
• Smart money sells into their faces and takes profit.
❌ Your Mistake:
• You tried to be clever and beat the market.
• You didn’t ask:
• Who’s on the market’s side?
• Who’s chasing?
• What will the crowd do next?
When retail feels FOMO, they chase → and that’s what drives continuation.
⸻
🧠 Pro Playbook for NFP-Driven Impulse Moves
✅ Ideal NFP Trade Setup:
1. News release: NFP
2. Price action: Big breakout from range.
3. Confirmation:
• Increasing volume
• Positive delta
• No rejection wicks
4. Entry: Buy Stop above 125% or 138.2%
5. Stop Loss: Below the breakout candle
6. Targets:
• TP1: 161.8%
• TP2: 200%
Now that’s how you use Fibonacci properly, not like people randomly dragging lines around.
⸻
🎯 Where to Draw the Fib Levels From?
✅ The Rule:
From the start of the explosive move to the first clear top right after the news.
🧨 For NFP:
• From: the low of the NFP candle (or the first strong move after the news).
• To: the first visible high with:
• A pause in upward momentum
• A doji candle
• Rejection wick
• Or minor resistance before the move continues
Example:
• Low: around 3,291.50
• Temporary high: around 3,316.00
Draw your Fib from:
• Bottom = 3,291.50
• Top = 3,316.00
⸻
✳️ How to Use the Levels After That:
• 100% = Move ends at the high
• 125% = First extension
• 138.2% = Real ignition point
• 161.8% = Golden target
• 200% = Full wave target
💡 Why Use Buy Stops Above 125%-138.2%?
Because:
• Price breaks above previous highs (lots of traders sell there).
• It creates fake sell traps.
• You enter after the stop-hunt, when the market wipes out sellers and goes higher.
⸻
🔥 How That Looks in Practice:
1. Draw Fib from the start of the NFP impulse move.
2. Wait for price to reach 125% or 138.2%.
3. Place a Buy Stop just above that.
4. Aim for 161.8% or 200% as targets.
Silver is in the Bearish trend after testing ResistanceHello Traders
In This Chart XAGUSD HOURLY Forex Forecast By FOREX PLANET
today XAGUSD analysis 👆
🟢This Chart includes_ (XAGUSD market update)
🟢What is The Next Opportunity on XAGUSD Market
🟢how to Enter to the Valid Entry With Assurance Profit
This CHART is For Trader's that Want to Improve Their Technical Analysis Skills and Their Trading By Understanding How To Analyze The Market Using Multiple Timeframes and Understanding The Bigger Picture on the Charts

Natural Gas is in the Buying DirectionHello Traders
In This Chart NATGAS HOURLY Forex Forecast By FOREX PLANET
today NATGAS analysis 👆
🟢This Chart includes_ (NATGAS market update)
🟢What is The Next Opportunity on NATGAS Market
🟢how to Enter to the Valid Entry With Assurance Profit
This CHART is For Trader's that Want to Improve Their Technical Analysis Skills and Their Trading By Understanding How To Analyze The Market Using Multiple Timeframes and Understanding The Bigger Picture on the Charts

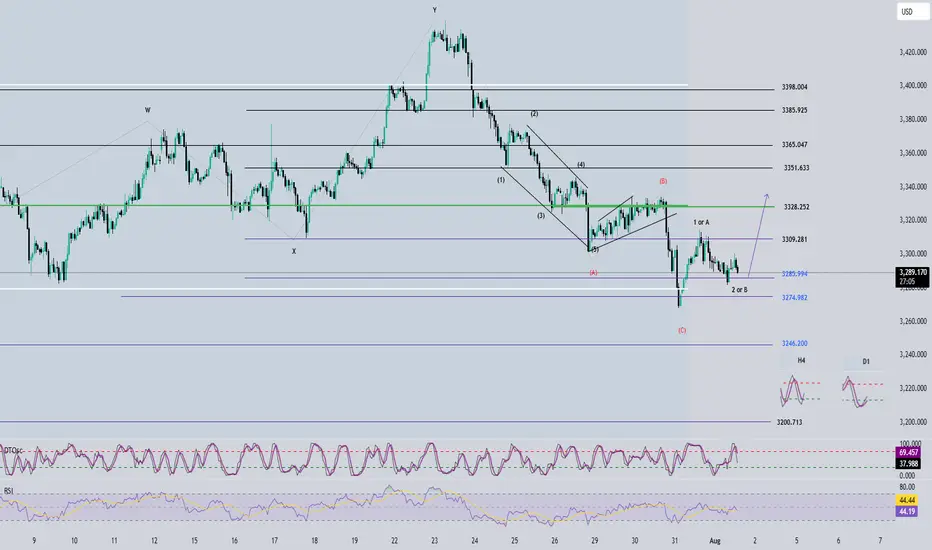
Elliott Wave Analysis – XAUUSD, August 4, 2025📊
🔍 Momentum Analysis:
D1 Timeframe: Momentum continues to rise strongly. It's expected that the price will keep rising for at least two more trading days, pushing the momentum indicator into the overbought territory, reinforcing the current bullish trend.
H4 Timeframe: Momentum is showing signs of a potential bearish reversal, indicating a possible corrective pullback during Monday’s trading session.
H1 Timeframe: Momentum is strongly bullish, especially evident from the powerful upward move on Friday. Price may continue rising at the open of the Asian session, potentially creating a Gap. However, caution is advised, as this Gap could signal exhaustion.
📌 Wave Pattern Analysis:
Given Friday's strong price action, the primary scenario currently favors wave 3 within the 5-wave bullish structure (12345 – black). However, we cannot entirely eliminate the possibility that this is wave C within an ABC corrective structure (black).
Presently, the price is forming a smaller 5-wave bullish structure (blue), likely in the final wave 5. Attention should be paid to two critical target zones:
🎯 Blue Wave 5 Targets:
• Target 1: 3368
• Target 2: 3385
⚠️ Next Scenario:
Upon completing the blue 5-wave structure, a corrective move downward will occur.
• If the correction does not break below 3315, the larger 5-wave bullish structure (12345 – black) is confirmed, and the price will continue upward to complete black wave 5.
• If the correction breaks below 3315, the structure shifts to an ABC corrective pattern (black), increasing the likelihood of a deeper decline to complete the larger corrective wave C (red).
🧩 Combining Momentum & Wave Analysis:
• D1 momentum strongly supports the continuation of the bullish trend.
• H4 momentum forecasts a short-term bearish correction on Monday, aligning with the formation of wave 4 correction.
• H1 momentum suggests the possibility of a Gap at Monday's Asian session open, marking the beginning of a corrective pullback as momentum reverses.
🎯 Short-term Trading Plan:
We will trade the current blue wave 5 with the following limit order plan:
✅ Sell Limit Zone: 3385 – 3387
⛔️ Stop Loss (SL): 3399
🎯 Take Profit (TP1): 3368
🎯 Take Profit (TP2): 3355
📌 Note:
The detailed trading plan for capturing the larger wave 4 correction (black) will be updated once sufficient evidence confirms the completion of the blue wave 5.
Happy trading, everyone! 🚀