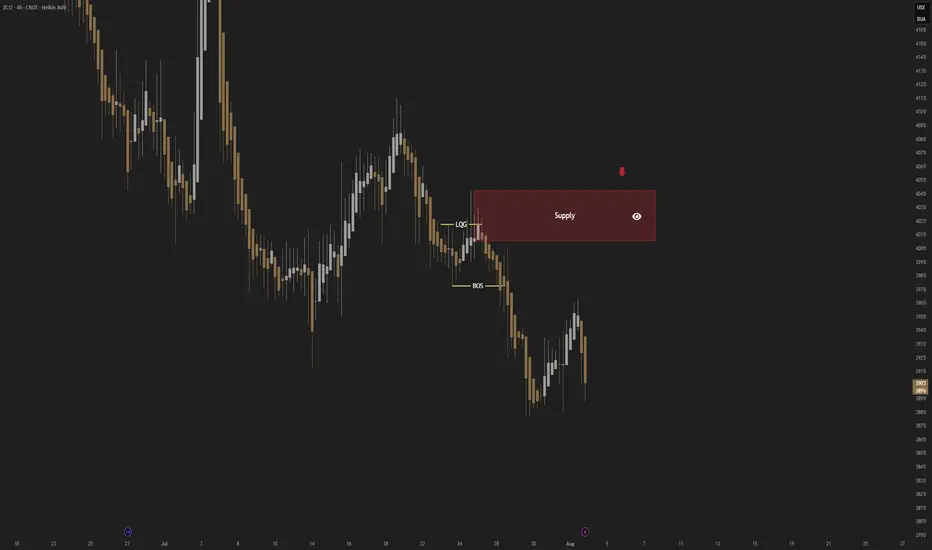
CORN; Heikin Ashi Trade Idea📈 Hey Traders!
Here’s a fresh outlook from my trading desk. If you’ve been following me for a while, you already know my approach:
🧩 I trade Supply & Demand zones using Heikin Ashi chart on the 4H timeframe.
🧠 I keep it mechanical and clean — no messy charts, no guessing games.
❌ No trendlines, no fixed sessions, no patterns, no indicator overload.
❌ No overanalyzing market structure or imbalances.
❌ No scalping, and no need to be glued to the screen.
✅ I trade exclusively with limit orders, so it’s more of a set-and-forget style.
✅ This means more freedom, less screen time, and a focus on quality setups.
✅ Just a simplified, structured plan and a calm mindset.
💬 Let’s Talk:
💡Do you trade supply & demand too ?
💡What’s your go-to timeframe ?
💡Ever tried Heikin Ashi ?
📩 Got questions about my strategy or setup? Drop them below — ask me anything, I’m here to share.
Let’s grow together and keep it simple. 👊
Futures market
ATH - Not in my watch for nowAs mentioned in my last post, Gold won't be pushing to break ATH unless there's an unusual catalyst that attracts it. Range bound trading is still the play, especially as we're coming into August. Save your ammunition for the Fall season, reduce your position and trade conservatively to build your equity safely. The USD has some room leg room to push higher in the short term that should hinder the yellow metal to go full bore.

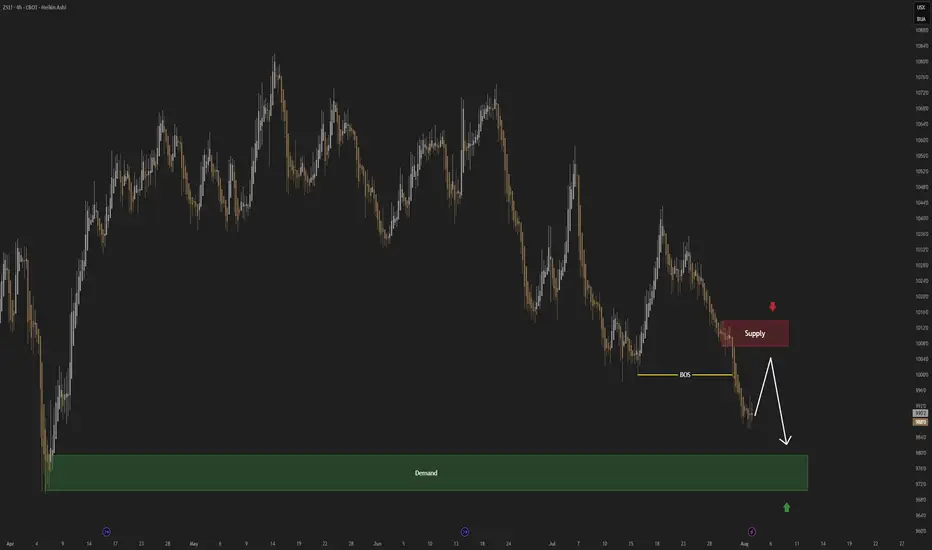
SOYBEAN; Heikin Ashi Trade Idea📈 Hey Traders!
Here’s a fresh outlook from my trading desk. If you’ve been following me for a while, you already know my approach:
🧩 I trade Supply & Demand zones using Heikin Ashi chart on the 4H timeframe.
🧠 I keep it mechanical and clean — no messy charts, no guessing games.
❌ No trendlines, no fixed sessions, no patterns, no indicator overload.
❌ No overanalyzing market structure or imbalances.
❌ No scalping, and no need to be glued to the screen.
✅ I trade exclusively with limit orders, so it’s more of a set-and-forget style.
✅ This means more freedom, less screen time, and a focus on quality setups.
✅ Just a simplified, structured plan and a calm mindset.
💬 Let’s Talk:
💡Do you trade supply & demand too ?
💡What’s your go-to timeframe ?
💡Ever tried Heikin Ashi ?
📩 Got questions about my strategy or setup? Drop them below — ask me anything, I’m here to share.
Let’s grow together and keep it simple. 👊

GOLD 1H CHART ROUTE MAP UPDATE & TRADING PLAN FOR THE WEEKHey Everyone,
Please see our updated 1h chart levels and targets for the coming week.
We are seeing price play between two weighted levels with a gap above at 3370 and a gap below at 3348. We will need to see ema5 cross and lock on either weighted level to determine the next range.
We will see levels tested side by side until one of the weighted levels break and lock to confirm direction for the next range.
We will keep the above in mind when taking buys from dips. Our updated levels and weighted levels will allow us to track the movement down and then catch bounces up.
We will continue to buy dips using our support levels taking 20 to 40 pips. As stated before each of our level structures give 20 to 40 pip bounces, which is enough for a nice entry and exit. If you back test the levels we shared every week for the past 24 months, you can see how effectively they were used to trade with or against short/mid term swings and trends.
The swing range give bigger bounces then our weighted levels that's the difference between weighted levels and swing ranges.
BULLISH TARGET
3370
EMA5 CROSS AND LOCK ABOVE 3370 WILL OPEN THE FOLLOWING BULLISH TARGETS
3392
EMA5 CROSS AND LOCK ABOVE 3392 WILL OPEN THE FOLLOWING BULLISH TARGET
3416
EMA5 CROSS AND LOCK ABOVE 3416 WILL OPEN THE FOLLOWING BULLISH TARGET
3429
EMA5 CROSS AND LOCK ABOVE 3429 WILL OPEN THE FOLLOWING BULLISH TARGET
3439
BEARISH TARGETS
3348
EMA5 CROSS AND LOCK BELOW 3348 WILL OPEN THE FOLLOWING BEARISH TARGET
3328
EMA5 CROSS AND LOCK BELOW 3328 WILL OPEN THE FOLLOWING BEARISH TARGET
3313
EMA5 CROSS AND LOCK BELOW 3313 WILL OPEN THE SWING RANGE
3296
3281
As always, we will keep you all updated with regular updates throughout the week and how we manage the active ideas and setups. Thank you all for your likes, comments and follows, we really appreciate it!
Mr Gold
GoldViewFX

GOLD 4H CHART ROUTE MAP UPDATE & TRADING PLAN FOR THE WEEKHey Everyone,
Please see our updated 4h chart levels and targets for the coming week.
We are seeing price play between two weighted levels with a gap above at 3371 and a gap below at 3293. We will need to see ema5 cross and lock on either weighted level to determine the next range.
We will see levels tested side by side until one of the weighted levels break and lock to confirm direction for the next range.
We will keep the above in mind when taking buys from dips. Our updated levels and weighted levels will allow us to track the movement down and then catch bounces up.
We will continue to buy dips using our support levels taking 20 to 40 pips. As stated before each of our level structures give 20 to 40 pip bounces, which is enough for a nice entry and exit. If you back test the levels we shared every week for the past 24 months, you can see how effectively they were used to trade with or against short/mid term swings and trends.
The swing range give bigger bounces then our weighted levels that's the difference between weighted levels and swing ranges.
BULLISH TARGET
3371
EMA5 CROSS AND LOCK ABOVE 3371 WILL OPEN THE FOLLOWING BULLISH TARGETS
3424
EMA5 CROSS AND LOCK ABOVE 3424 WILL OPEN THE FOLLOWING BULLISH TARGET
3499
EMA5 CROSS AND LOCK ABOVE 3499 WILL OPEN THE FOLLOWING BULLISH TARGET
3561
BEARISH TARGETS
3293
EMA5 CROSS AND LOCK BELOW 3293 WILL OPEN THE SWING RANGE
3236
3171
EMA5 CROSS AND LOCK BELOW 3171 WILL OPEN THE SECONDARY SWING RANGE
3089
3001
As always, we will keep you all updated with regular updates throughout the week and how we manage the active ideas and setups. Thank you all for your likes, comments and follows, we really appreciate it!
Mr Gold
GoldViewFX

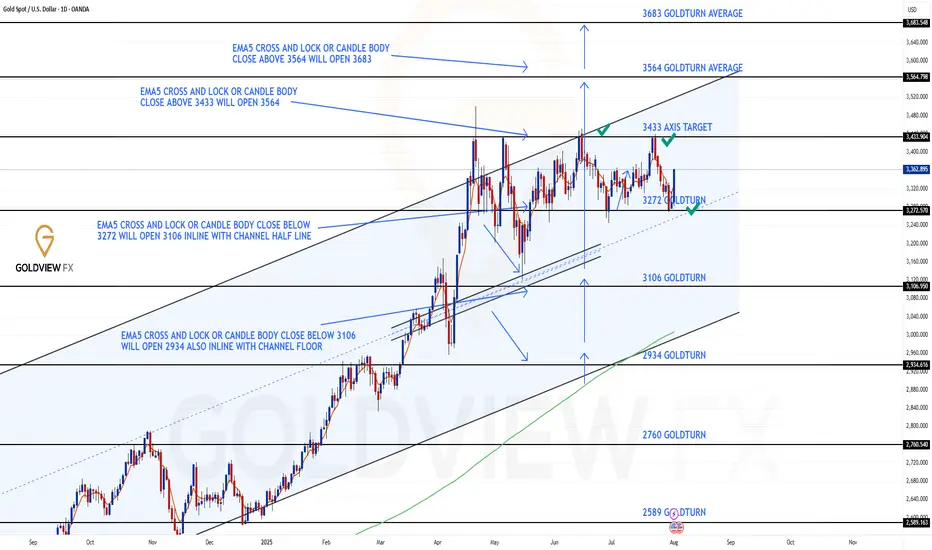
GOLD DAILY CHART ROUTE MAPHey Everyone,
Daily Chart Update – Another Clean Rejection: Structure Still Dominates
Following up on the recent price action last week after hitting the 3433 resistance level, we got exactly what the chart warned us about.
There was no confirmed break above 3433, which led to a clean rejection right back into 3272. Interestingly, the move aligned perfectly with the channel half-line, giving us another bounce right off that zone.
We remain in the same structured range, with price still rotating between 3262 and 3433, a 170+ pip zone that continues to deliver high probability trade setups.
Here’s where we are now:
🔹 Range Still Active
Price is respecting the 3272–3433 boundaries with precision. Until we get a decisive break and hold outside this range, range bound strategies remain in play.
🔹 No Breakout = Clean Rejection
The failure to sustain above 3433 confirms resistance is still valid. We're watching EMA5 for potential breakout confirmation, until then, the bias stays neutral within the range.
🔹 Channel Half-line Bounce
That rejection into 3272 also matched the channel half-line and the bounce there further cements this area as critical support.
Updated Key Levels
📉 Support – 3272
Still the major pivot. Buy zones remain valid here unless we see a confirmed breakdown.
📈 Resistance – 3433
Now clearly tested and rejected again. Any clean break and hold above could change the dynamic, but until then, it's solid resistance.
Thanks as always for your support.
Mr Gold
GoldViewFX
GOLD WEEKLY CHART MID/LONG TERM ROUTE MAPHey Everyone,
Weekly Chart Update – Another Clean Rejection + Bounce: Range Still in Play
Just a quick follow up on the ongoing weekly structure. We continue to see incredible respect for levels, with price action playing out exactly as mapped.
After the initial rejection at 3387, we got another test of support at 3281, and once again, the level held perfectly, delivering a clean rejection and bounce. Price is now rotating back upward, currently heading toward 3387, which remains the upside magnet and still open for a retest.
We remain firmly inside the 3281–3387 range, and as long as neither boundary breaks with confirmation, the structure remains our dominant guide.
Updated Structural Notes:
🔹 3281 Rejected Again
Support doing its job to the pip. This latest bounce further reinforces the strength of this level within the weekly channel.
🔹 Back Toward 3387
With 3281 holding once more, price is now tracking toward the 3387 resistance zone, which remains the key level to break for further upside continuation.
🔹 Channel Structure Unchanged
No breakdown below support, no confirmed breakout above resistance. The rising channel remains fully respected, and EMA5 still leans constructive.
Updated Levels to Watch:
📉 Support – 3281
Key weekly pivot tested and held again. Continues to offer solid dip buy opportunities unless decisively broken.
📈 Resistance – 3387
Still our major resistance. It’s been tested and rejected, but remains open for another challenge.
📈 Resistance 2 – 3482
Unfilled gap and broader weekly target. Only comes into focus if we get a proper breakout and hold above 3387.
Plan:
We stay range focused between 3281 and 3387 until proven otherwise. No breakout = no change. Watch for signs of momentum as we approach the top again a confirmed close above could shift the game toward 3482. Until then, structure is king.
Appreciate all the continued support.
Mr Gold
GoldViewFX

Gold Trend Reversal: MSS Completed Eyes on OB and Breaker Block!The gold market has executed a Market Structure Shift (MSS) in the New York session, indicating a trend reversal. Initially, the market made a Break of Structure (BoS) to the upside, but later dropped sharply and closed below the MSS level, confirming a bearish shift. Currently, the market is likely entering a retracement phase and may look to fill its Pending Demand (PD) arrays.
There are two critical levels from which the market could potentially drop again:
1. The first is an Order Block (OB).
2. The second is a Breaker Block (BB).
Keep a close watch on these two levels. If the market returns to either and presents bearish confirmation signals, it could resume the downward move towards swing lows.
Do Your Own Research (DYOR).

XAUUSDGold (XAUUSD) has been undeniably one of the most rewarding instruments to trade this year. Whether that be longs or shorts.
Well, after the latest drop let’s be clear on one thing…. There is another big one to come.
There is a 4 year cycle of behaviour to not be ignored. Question, what happened this time in the Gold charts 4 years ago?
If you know the answer then you need to be setting up for sells.
Of course there have been many highs made this year and some are anticipating a new ATH before the drop. It is possible based on price action in 2025.
If history is to repeat itself, the open of Asian Session tonight (030825) could see a continuation up of the explosion up of Friday (010825). This should result in the sweeping out of stop losses of any sells that have been held over the weekend.
The closure of the sells will create buying pressure sending price further up to retest at least the most significant swing high. At and from this level and a few more above, we can look out for sustained selling to break below 3300 and beyond.
It is just theory at this point but should be taken into account.
Potential sell areas:
3368-3370
3378-3380
3400-3405
3412-3416
3428-3430
3433-3438
3444-3450
Of course risk management is key. But from the highest point that price reaches early next week could be the start of a very good sell.
All entry zone me should have an initial 1:2RR while holding partial sells with extended TPs as far as 3233,3217,3198,3159,3099.
Good luck 🤞
This is not financial advice and should be taken with a pinch of salt.

HelenP. I Gold may reach resistance zone and then dropHi folks today I'm prepared for you Gold analytics. From a structural perspective, the XAU chart indicates a recent shift to a bearish bias, following a clear breakdown from a large broadening wedge pattern. This development suggests that sellers have gained a significant advantage in the market. The price is now staging a corrective rally back towards the point of the breakdown, creating a critical test at the confluence of the broken trend line and the major horizontal resistance zone at 3375 - 3385. My analysis for a short position is based on a potential 'bull trap' scenario within this area. I believe the price may briefly push above the trend line to trap buyers, but the key condition is a swift and forceful rejection from within the resistance zone. If the price fails to hold its gains and reverses back below the trend line, it would be a strong confirmation of the underlying bearish pressure. This would likely trigger the next impulsive move downwards, and therefore, the primary goal for this scenario is set at the 3320 level, a logical objective following such a powerful rejection. If you like my analytics you may support me with your like/comment ❤️
Disclaimer: As part of ThinkMarkets’ Influencer Program, I am sponsored to share and publish their charts in my analysis.

XAUUSD 4H Analysis – Smart Money Trap Setup🚨 Gold is currently reacting off mid-range demand, with a clear liquidity sweep + bullish push underway.
🔴 Key Supply Zones:
3,450–3,480 = Extreme high imbalance
3,400–3,420 = Previous consolidation before selloff
🟢 Key Demand Zone:
3,150–3,200 = Untouched demand zone and liquidity pool from May
📊 My Expectation:
Price is likely to induce breakout traders above 3,420–3,450, tap into premium supply, then aggressively reverse back into demand around 3,160.
🧠 Why this setup?
Equal highs = Liquidity trap 🔥
Price approaching unmitigated supply
Structure shift possible after sweep
SMC model: Buy into premium → Sell from supply → Target demand
🔻 Bearish Plan:
Wait for price to run above 3,450
Look for strong rejection / bearish OB / SFP
Enter short → Target 3,160 zone
💬 What do you think?
Will XAUUSD break this supply or fall from there?
📍Like + comment your thoughts below!
📌 Follow for daily Smart Money charts 🔐
#XAUUSD #GOLD #SMC #ICT #Liquidity #Forex #SmartMoney #PriceAction #GoldAnalysis #OrderBlock

Gold Weekly Outlook. 03.08.2025, SundayCOMEX:GC1!
Expecting a run up to daily BPR. Previous weekly closure suggesting bullish price action on Gold. Paytience is the key

Nonfarm Pay Attention Zone✏️ OANDA:XAUUSD is recovering and increasing towards the resistance zone of yesterday's US session. The 3315 zone is considered a strategic zone for Nonfarm today. A sweep up and then collapse to the liquidity zone of 3250 will be scenario 1 for Nonfarm today. If this important price zone is broken, we will not implement SELL strategies but wait for retests to BUY. It is very possible that when breaking 3315, it will create a DOW wave with the continuation of wave 3 when breaking the peak of wave 1.
📉 Key Levels
SELL trigger: Reject resistance 3315.
Target 3250
BUY Trigger: Break out and retest resistance 3315
Leave your comments on the idea. I am happy to read your views.

XAUUSD at the daily level, there is a major change in direction
US non-farm payrolls data,Market sentiment is ignited
If there is a retracement or a volatile area, it is an opportunity to enter the market and buy.
The stop loss can be placed in the lower edge area of the box
Pay attention to the situation where the upper edge of the box is broken
The daily trend is expected to be bullish

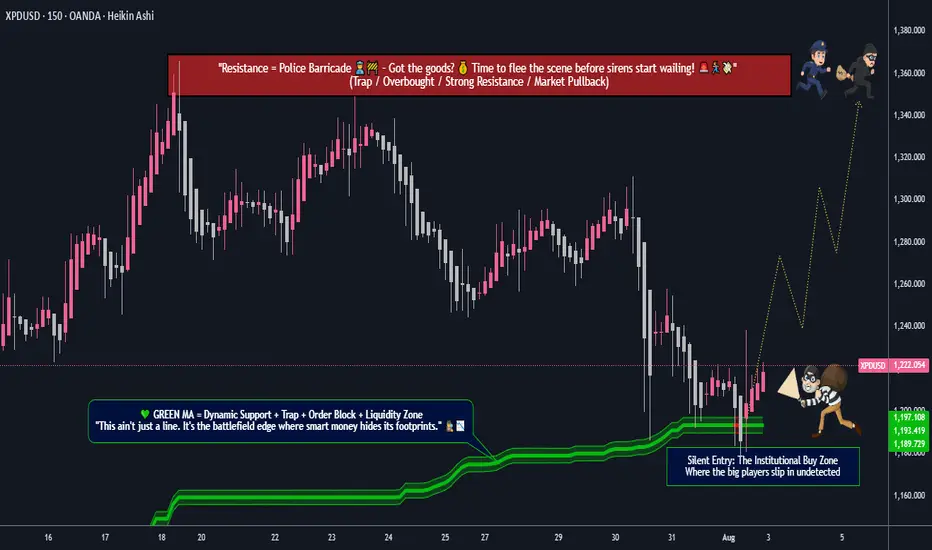
XPD/USD Vault Breach: Long Entry Metal Heist Strategy🔐 "Palladium Vault Breach: XPD/USD Bullish Metal Heist Plan" 💼💸
🌍 Greetings to All Market Hustlers, Robbers & Risk-Takers! 🌟
Time to tap into XPD/USD - Palladium, one of the most volatile and opportunistic metals on the board.
Based on the Thief Trading Blueprint — forged from technical precision and fundamental foresight — this setup outlines a strategic metal market robbery with targets marked and exits planned.
This heist plan is NOT for the faint-hearted. It’s designed for traders who want to rob the market clean — fast or smooth, swing or scalp, your call.
🔑 ENTRY POINTS — The Vault is Open!
📌 Initiate Long Positions anywhere near current levels.
For tactical precision, layer Buy Limit orders using a pullback zone strategy on the 15min to 30min chart, around recent swing highs/lows. This improves risk-adjusted entries. We’re using the layering method — multiple orders placed like silent drills breaching the vault.
🛑 STOP LOSS — Cover the Escape Route
📍 Set your Stop Loss below the recent 4H swing low, around 1160.000.
Adjust SL based on lot size and the number of entries layered in. The key is to survive the shakeout, not just chase the breakout.
🎯 TARGET — Grab the Bag and Exit Clean
🏁 Primary Target: 1360.000
But remember: Always escape before the police set up barricades at resistance. That’s where heavy sellers and bearish robbers defend their turf. Use trailing stops to lock in gains and avoid getting caught in reversals.
💥 TRADE MODE — Pick Your Role:
Scalpers: Only long side. Stick to momentum plays.
Swing Traders: Join the full operation and ride the bullish wave.
Use trailing SL as a smart shield.
📊 MARKET CONTEXT — Why This Heist Works
🧠 The setup is powered by a mix of:
Macro-Economic Conditions
Intermarket Metal Correlations
Sentiment Shifts and Risk-On Bias
Supply Constraints & Demand Revival
Geopolitical Hotspots Driving Precious Metal Interest
COT & Institutional Positioning Insights
These dynamics are creating a sweet spot for a high-probability bullish breakout, aligning perfectly with our Thief Trading style.
🚨 RISK ZONES — Stay Sharp!
⚠️ Be cautious near major news releases or data events. These are trap zones where the market plays dirty.
Avoid fresh entries near high-impact data
Manage existing positions with trailing SL
Re-assess if market structure flips
🎯 STRATEGIC THOUGHTS
This is not just a trade. It’s a robbery plan backed by logic, discipline, and sniper-level entry techniques. Markets are wild — rob them before they rob you.
No greed. No fear. Just clean execution.
🚀 Thief Trading Style = Outsmart the crowd. Outrun the reversal.
Bullish
Description
Hi traders
I think after the fake break that happened last week at 3280, we should be ready to move higher with a target of 3430-3450 and if the fundamentals are impressive, even a break of the previous high.
Of course, the resistance zone of 3385-3405 is in the way of the price.
I hope that the analysis I am providing is accurate and effective.
Possible positions this week
A:Suitable prices for BUY positions
1)3345-3340
2)3174-3150
B:Suitable prices for SELL positions
1)3385-3405(Of course, with approval from the market and the type of candles)
This is just an analysis and everyone is responsible for their own work.
Hoping for a good and profitable week.

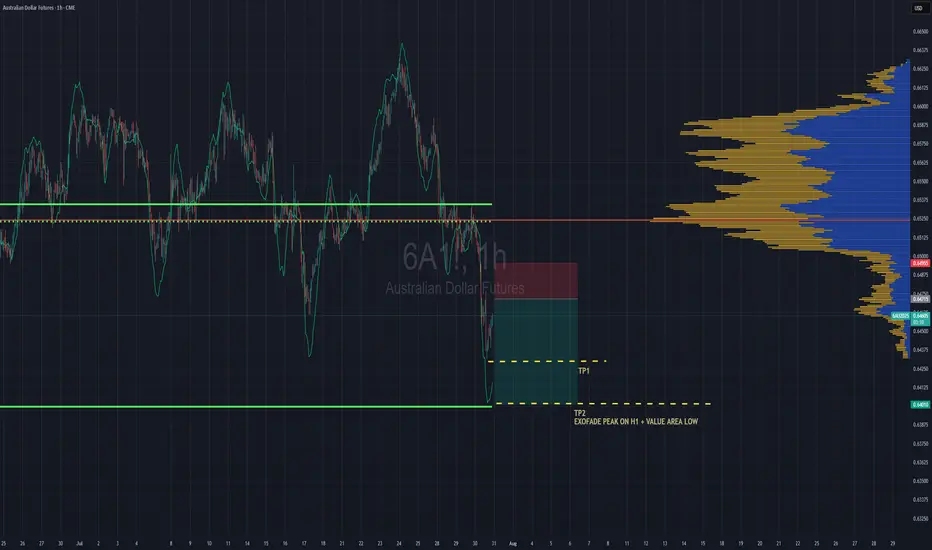
Aussie Shorts Looks Promising This is a pullback trend trade anticipating trend continuation. Entry is based on LVN (low volume node) for entry. Also looking on the footprint chart there is a high volume node with -ve delta that was traded at 0.64715.
If the sellers return to defend that price then this pullback should give some strong rejection once we pierce the entry zone and send bulls packing.
TP1 - First swing low
TP2 - Value area low of the range, which also is in confluence with the ExoFade peak on the 1HR timeframe. ExoFade peaks always gets taken out in a strong trend, that's why i love using them as price targets for exits. ExoFade is free on Tradingview for those curious about it. Just search for it.
Weekly Market Outlook – EUR/USD & GOLD Aug 4 ARX Method Each Sunday, I prepare a simple but effective outlook for the week ahead using price action structure, key liquidity zones, and ARX level confluence no indicators, just clean charts.
🔍 This week’s snapshot:
EUR/USD – Sitting at a key level after a liquidity sweep.
Gold (XAU/USD) Clear BMS on the weekly and 4H break above 3350. Looking for continuation.
🧠 The focus is always the same:
Let the market reveal its hand. Wait for structure. Execute with patience.
If this helps your preparation, feel free to check my profile bio for more info about how I trade and share these weekly.
Trade sharp.
Ale ARX | Price & Time


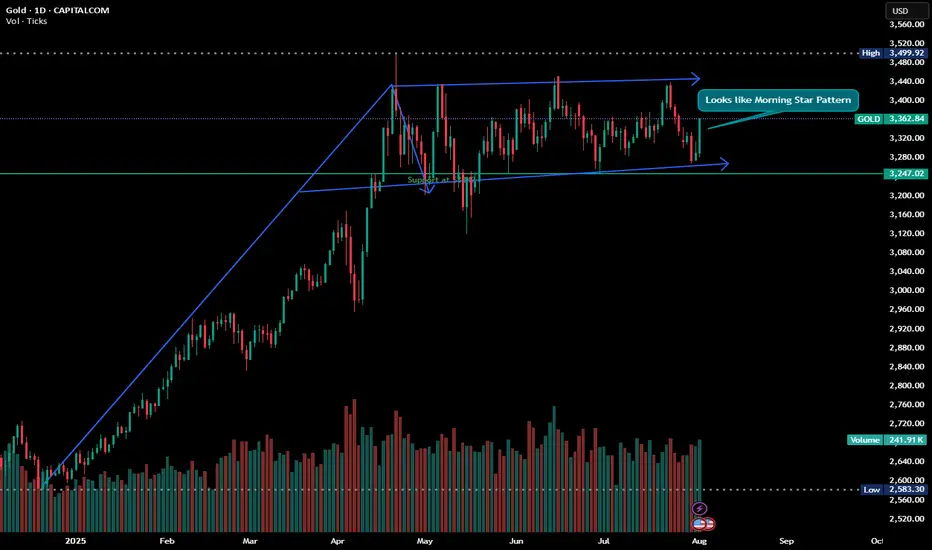
Glitters of Gold - Looks like Morning Star and Bullish Flag Disclaimer : Do your own research before investing. This is just a chart analysis. No recommendation to buy and sell.
With the up and down of stock market, there is always a safe investment place and its shine increase as the time passes with the increase in price, yes its GOLD. Everyone love it. if you look at gold from last couple of years, there is continuous growth in this metal.
while doing my chart analysis i found gold charts are quite interesting.
Gold is currently trading in range and formation of 2 patterns can be seen in the daily chart with my support and resistance level marked in CHART.
For some its investment and for some its trading however my recommendation is always do some SIP in GOLD.
Happy Investing.
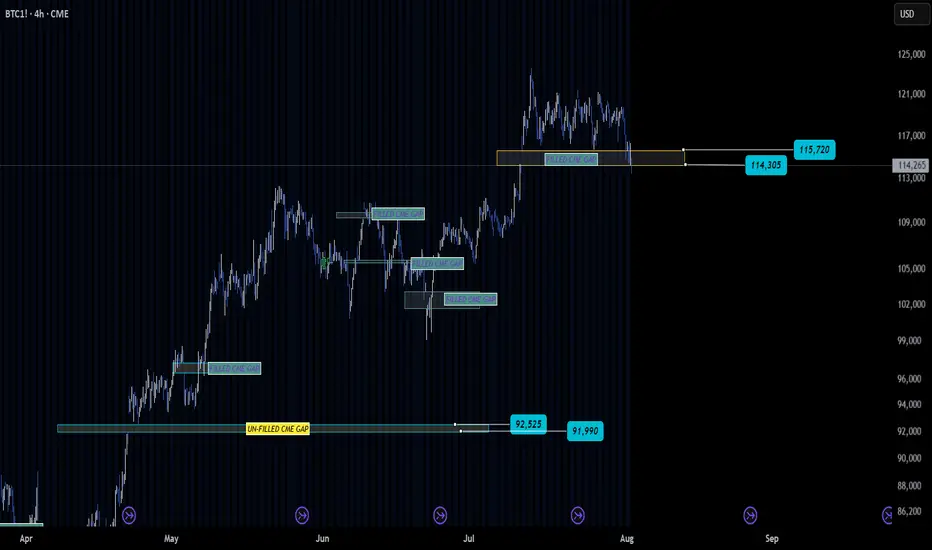
BTC Fills Key CME Gap — Eyes Now on What’s Next✅ The CME gap between 115700–114300 has officially been filled — a level many traders were watching closely.
What happens here could shape BTC’s next major move 🎯
Will we see consolidation, reversal, or continuation? Price action at this level deserves attention.
🕵️ Worth noting: one more unfilled gap remains at 92500–91900 📉
While CME gaps aren’t guaranteed to fill, history shows they often do — and traders are tracking that lower level.
👀 Watch this zone closely — market memory is strong around gap fills.
What’s your bias from here?
Not financial advice.
XAUUSD Gold Swing Trading Plan – 1st Week of August 2025 (H4 TF)Strategy Type: Swing Trade (Multi-Day Positioning)
Timeframe: H4 (4-hour)
Market Bias: Bullish Continuation
Risk Profile: Medium-to-Low Frequency, High Conviction
Trade Style: Buy-the-Dip, Scale-out Strategy
🧠 Macro & Technical Outlook
Gold is currently maintaining a bullish higher-high, higher-low structure on the H4 chart, reflecting continued strength from macro drivers including inflation hedging, softening USD, and a shift toward safe-haven assets amid geopolitical and economic uncertainty.
The market has recently completed a local impulse wave and is entering a healthy retracement phase. This sets up a textbook swing opportunity, where pullbacks to key Fibonacci levels can be capitalised for the next bullish leg up.
🔍 H4 Trading Plan Summary
✅ Phase 1: Buy on Pullback to 3360
Entry Zone: 3360 (H4 support and key retracement level)
Reasoning:
Confluence of dynamic support and 50–61.8% Fibonacci retracement zone of the previous H4 swing
Former resistance turned support (RBS zone)
Volume tapering and RSI cooling off — signalling a healthy setup for bullish continuation
Entry Trigger:
Bullish engulfing or pin bar candle on H4
Optional confirmation: RSI > 40 after bounce, MACD crossover
Stop Loss: Below 3340 (beneath structural support)
🎯 Target 1: 3383
Why:
Local resistance zone from previous H4 rejection wick
Close to psychological level and good zone for first partial profit
Action:
Secure 25% profits
Move SL to breakeven or +10 pips for risk-free continuation
Wait for next retracement
✅ Phase 2: Wait for Pullback After 3383
Retracement Zone: Estimated dip to 3370–3375 (higher low area)
Entry Trigger:
Confirmation of strong bounce at this level with tight consolidation and breakout on smaller timeframes (M30/H1)
🎯 Target 2: 3430
Why:
Strong historical resistance from early July
Mid-level of long-term range (3330–3480)
Often serves as decision point between accumulation or breakout
Action:
Secure additional 40–50% profits
Trail SL below the most recent higher low (~3390)
✅ Phase 3: Final Position Hold Toward 3475
Retracement Zone: Likely dip to 3410–3420 after 3430 is reached
Final Entry (Optional): Only if momentum is strong and structure holds
Target 3: 3475
Why:
Multi-month resistance and projected upside target from recent breakout
Round number magnet + liquidity zone for larger institutional exits
Action:
Close remaining 25–30% of the position
Reassess for breakout or reversal at 3475
⚠️ Risk Management Plan
Max exposure: 1.5–2% of account
Stop losses fixed — no averaging down
Use position sizing to handle swing duration volatility
Scale-in only with structure confirmation
🔁 Summary Table
Phase Buy Level Target SL Action
Phase 1 3360 3383 3340 Partial TP, BE SL
Phase 2 3370–3375 3430 3355–3365 Add size, secure more
Phase 3 3410–3420 3475 3390 Final TP, full exit
📊 Indicators to Watch (H4)
RSI: Look for 40–60 zone bounce and push toward 70
MACD: Cross above signal line confirms momentum
Volume: Increased buy-side volume at 3360–3375 confirms entry strength
🧭 Fundamental Considerations
Watch DXY: Weakness in Dollar continues to support Gold’s uptrend
FOMC or Jobs Data Ahead?: Any surprise comments from Fed could introduce volatility
Global Headlines: Risk-off flows (e.g., China/US tensions, war news) are bullish for Gold
