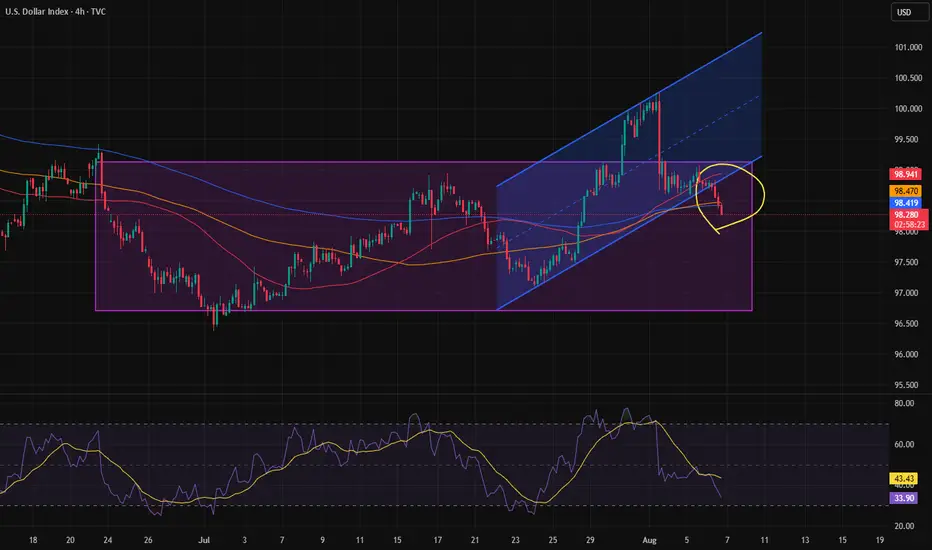
Dollar dropWith the break of the ascending channel's bottom, the price is expected to reach the bottom of the range.
Market indices
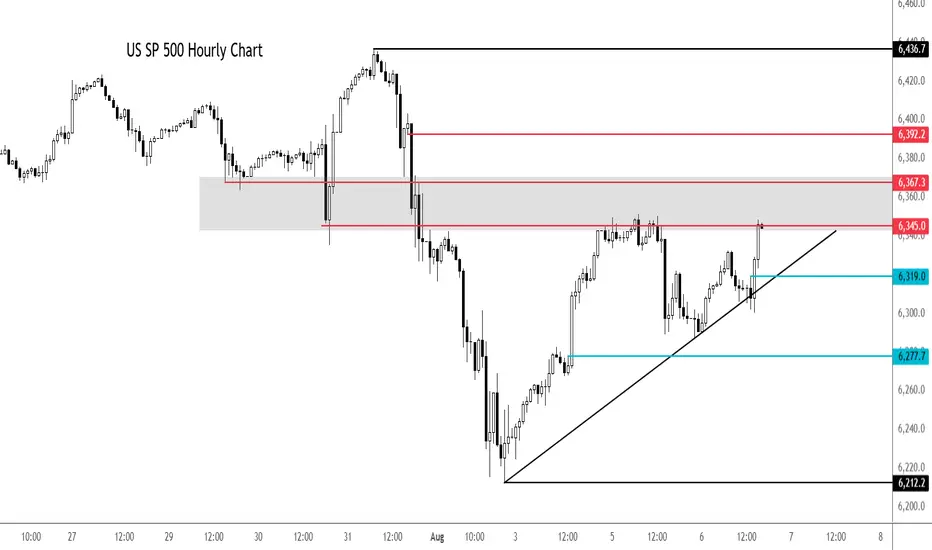
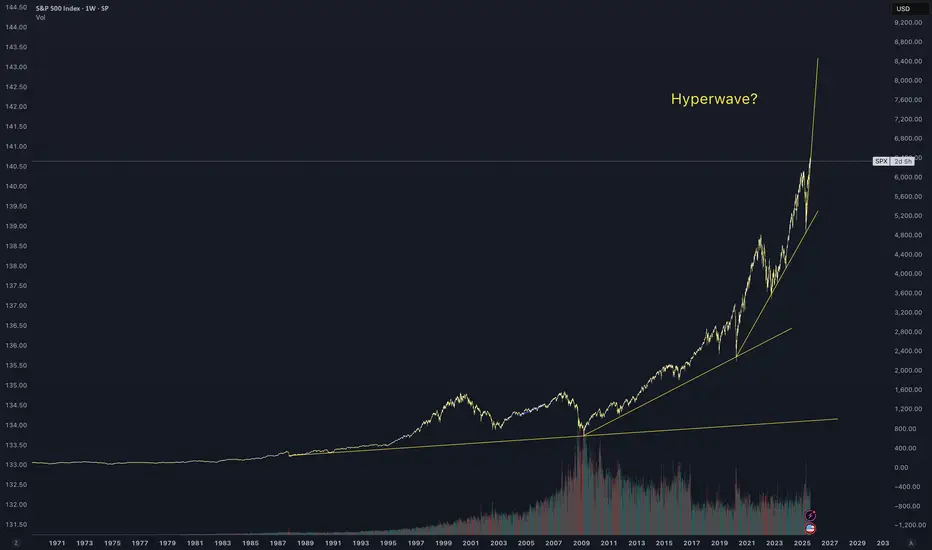
S&P 500 extends rally despite macro concernsThe 5% Apple rally aside, it is all about rate cut bets vs. strong earnings. So far, the latter has helped to keep US markets supported near all-time highs. But if macro concerns increase further, investors' perception about future earnings growth will weaken. And with that, we could see some cracks in expensive stocks.
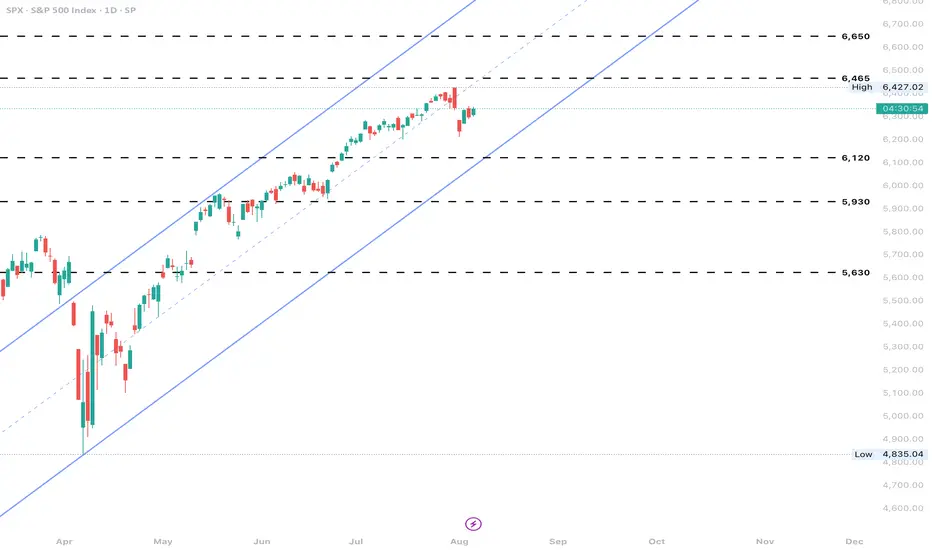
Looking at the hourly chart of the SPX500, the US benchmark was testing a potential resistance zone in the shaded region between 6345 to 6367, an area which was previously support. Above this zone, 6392 is the next level of potential resistance and then the all-time high of 6436 comes into focus next.
earlier, the index bounced after a failed breakdown below the trend line shown on the chart. Another potential test of the trendline could see the index break lower. Short-term support is seen around 6319 then 6277.
By Fawad Razaqzada, market analyst with FOREX.com
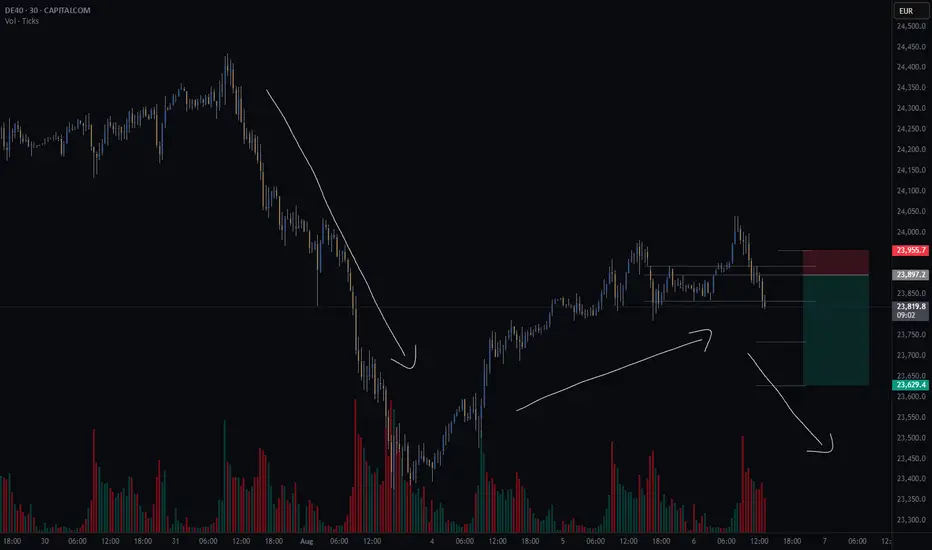
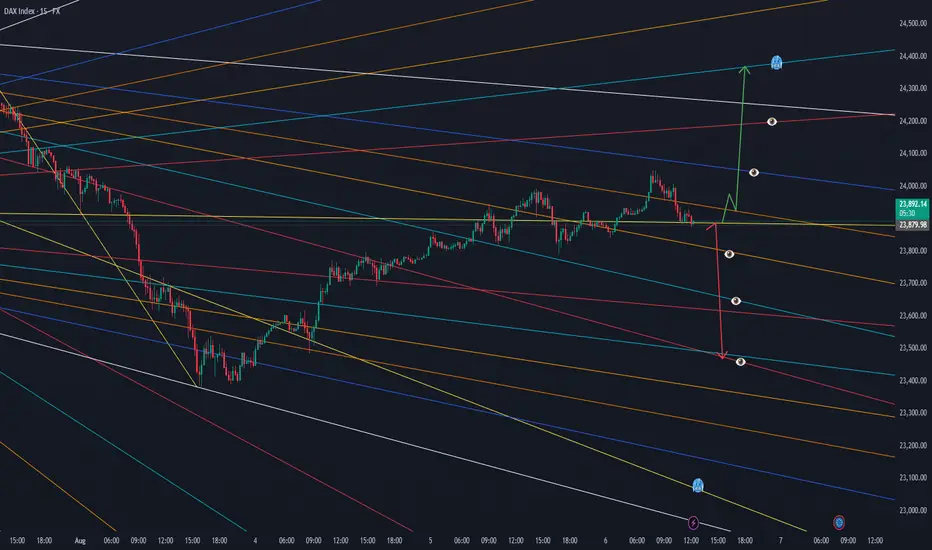
GER40CASH (DE40) - potential short - HSThere is a potential head and shoulders continuation pattern.
What I like about this setup is the GER40 is potentially creating a bear flag.
Finding a continuation pattern within the bear flag, like the head and shoulders, is a great entry point for the second part of the downward move.
Still waiting for my system to confirm some variables before I take the trade.
Risk/reward = 4.3
Entry price = 23 905.3
Stop loss price = 23 955.4
Take profit level 1 (50%) = 23 733
Take profit level 2 (50%) = 23 628
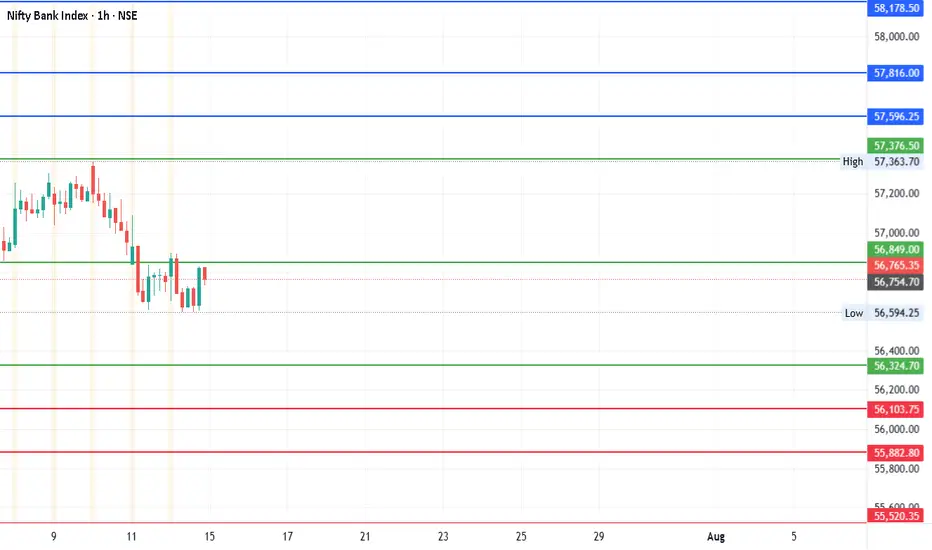
#BankNifty Weekly: Major Levels & Targets You Need to KnowDate: 14-07-2025
#Nifty Bank Technical Levels
Current Price: ₹56,765.35
Pivot Point: ₹56,849.40
Upside Targets (if price moves above Pivot)
| Target | Price |
| ----------- | ---------- |
| 🎯 Target 1 | ₹57,596.25 |
| 🎯 Target 2 | ₹57,816.00 |
| 🎯 Target 3 | ₹58,178.48 |
| 🎯 Target 4 | ₹58,540.95 |
🔽 Downside Targets (if price drops below Pivot)
| Target | Price |
| ----------- | ---------- |
| 🎯 Target 1 | ₹56,103.76 |
| 🎯 Target 2 | ₹55,882.80 |
| 🎯 Target 3 | ₹55,520.33 |
| 🎯 Target 4 | ₹55,157.85 |
🛑 Support & Resistance Levels
Support: ₹56,324.71
Resistance: ₹57,376.51
Observations:
Since the current price is below the pivot (₹56,849.40), immediate bearish bias could be assumed unless a strong reversal happens.
A break below ₹56,324.71 (Support) could trigger the downside targets.
Conversely, crossing back above the pivot may shift bias to bullish, targeting the resistance and beyond.
#TradingView #Stocks #Equities #StockMarket #Investing #Trading #Nifty
#TechnicalAnalysis #StockCharts #Finance #BankNifty #NiftyBank #WeeklyAnalysis
US500 Market Insight US500 Market Insight
The US500 continues to demonstrate resilience amid a complex macroeconomic backdrop, trading around 6,388 at mid-session today. This represents a modest 0.40% recovery from the previous close of 6,299, signaling improving investor sentiment despite ongoing market headwinds.
Fundamental Outlook: Market Resilience Amid Volatility
After a stretch of choppy trading sessions driven by mixed U.S. economic data and escalating tariff concerns, the index has regained its footing above the psychologically important 6,300 support level. This bounce reflects investor confidence in the broader market’s fundamentals, particularly in the face of global policy uncertainties.
Strong Corporate Earnings as a Key Driver
Earnings season has delivered notable upside surprises, particularly in the technology, consumer discretionary, and financial sectors. Positive forward guidance and robust profit margins have underpinned the index’s strength, helping offset negative sentiment from trade related headlines and slowing global demand in select sectors.
Dovish Federal Reserve Expectations
Markets are increasingly pricing in a more accommodative stance from the Federal Reserve, even as policymakers continue to stress a data dependent approach. With inflation surprising on the upside and NFP data coming out softer, this is reinforcing expectations for possible rate cuts later in 2025. This has eased pressure on equities and boosted appetite for risk assets.
Technical Outlook: Bullish Continuation
From a technical perspective, the US500 remains in a well defined long-term uptrend. Maintaining price action above 6,300 strengthens the case for further gains, with 6,400–6,500 seen as the next potential resistance zone. Keep watching for consolidation above 6,300 to confirm breakout momentum.
Key Risks and Market Sensitivities
Despite the positive bias, risks remain. The index remains highly sensitive to global trade developments, particularly US-China and US-EU tariff disputes. In addition, any shift in Fed tone or unexpected inflation data could trigger renewed volatility.
Conclusion
The US500’s current recovery reflects a careful balance of strong earnings, improving rate outlook, and technical support. While bullish sentiment persists, the path forward will likely remain data driven and headline sensitive, requiring traders to remain nimble. A sustained break above 6,400 could open the door to new highs later this quarter, but near-term volatility should not be discounted.
Analysis by Terence Hove, Senior Financial Markets Strategist at Exness
Nasdaq 100: Institutional Move Toward 22,680 Unfolding📊 Nasdaq 100 Smart Money Breakdown
Current Price: 22,103
Target Price: 22,680
🔼 Upside Potential: +577 points
The market is currently positioned for a premium retracement move after a recent liquidity sweep below short-term equal lows, which likely triggered sell-side liquidity. This setup hints at Smart Money Accumulation, with institutions entering long positions at discount pricing.
We're now seeing:
✅ Break of Structure (BOS) to the Downside
✅ Internal liquidity sweep
✅ Price reacting from a discounted OB (Order Block)
✅ Potential drive toward the next liquidity pool sitting above the 22,680 level.
This move aligns with a bullish market structure shift, suggesting Smart Money is engineering price higher to target buy-side liquidity above recent highs.
🎯 Target: 22,680 – a key liquidity area where Smart Money may look to offload positions.

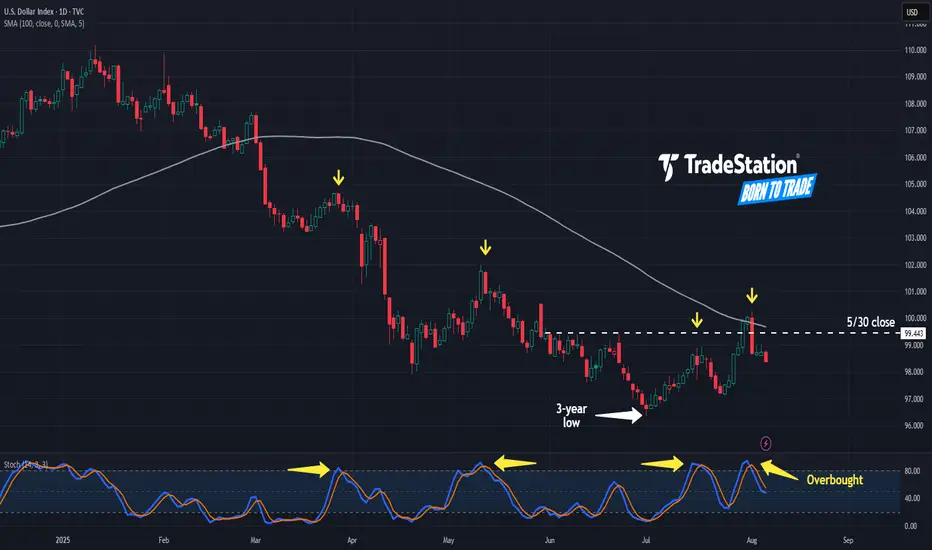
More Downside in the Greenback?The U.S. Dollar Index began 2025 with a dramatic slide. Now, after a period of consolidation, some traders may see further downside risk.
The first pattern on today’s chart is 99.443, the closing price for both a week and the entire month of May. DXY tested above the level between July 30 and August 1. It got rejected after the Labor Department revised payroll data lower. Has resistance been confirmed?
Second, the reversal occurred at the falling 100-day simple moving average. That may reflect bearishness over the longer term.
Third, stochastics have dropped from an overbought condition. Notice how those turns have occurred at other short-term peaks (marked in yellow).
Finally, traders may focus on news flow and catalysts with the White House expected to announce a replacement for Federal Reserve Governor Adriana Kugler this week.
TradeStation has, for decades, advanced the trading industry, providing access to stocks, options and futures. If you're born to trade, we could be for you. See our Overview for more.
Past performance, whether actual or indicated by historical tests of strategies, is no guarantee of future performance or success. There is a possibility that you may sustain a loss equal to or greater than your entire investment regardless of which asset class you trade (equities, options or futures); therefore, you should not invest or risk money that you cannot afford to lose. Online trading is not suitable for all investors. View the document titled Characteristics and Risks of Standardized Options at www.TradeStation.com . Before trading any asset class, customers must read the relevant risk disclosure statements on www.TradeStation.com . System access and trade placement and execution may be delayed or fail due to market volatility and volume, quote delays, system and software errors, Internet traffic, outages and other factors.
Securities and futures trading is offered to self-directed customers by TradeStation Securities, Inc., a broker-dealer registered with the Securities and Exchange Commission and a futures commission merchant licensed with the Commodity Futures Trading Commission). TradeStation Securities is a member of the Financial Industry Regulatory Authority, the National Futures Association, and a number of exchanges.
TradeStation Securities, Inc. and TradeStation Technologies, Inc. are each wholly owned subsidiaries of TradeStation Group, Inc., both operating, and providing products and services, under the TradeStation brand and trademark. When applying for, or purchasing, accounts, subscriptions, products and services, it is important that you know which company you will be dealing with. Visit www.TradeStation.com for further important information explaining what this means.
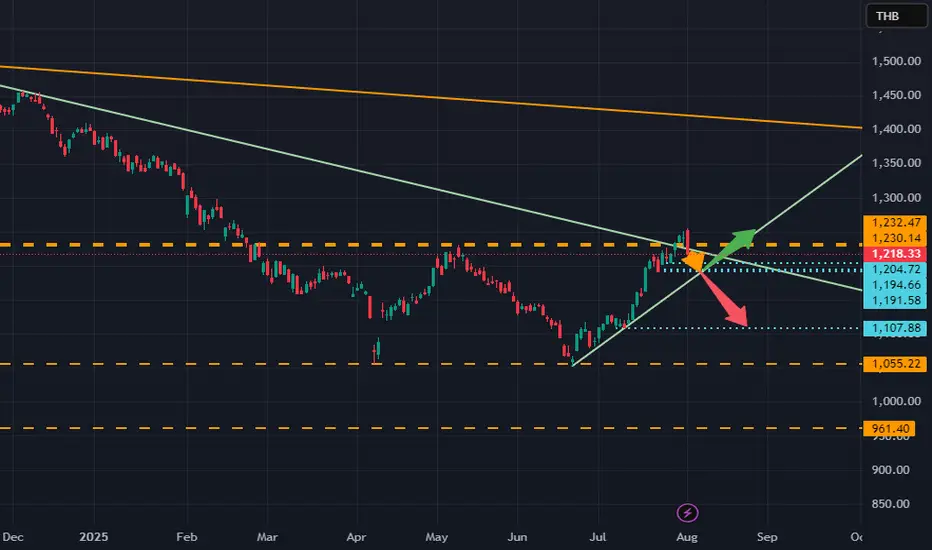
Analysis on SET INDEX: After the target hit, what comes nextDear All
Currently, SET INDEX has reached 1245- 1250 and on the first day, it can hold at this level.
However, once the tax news released, not only it fail to make new high, it fell drastically.
As a result, it can be concluded that the upward momentum is now ceased.
Also, with the big red, the set is entering the new stage.
the case is as followed,
1. most likely went down to around 1190-1200.
After which it should either
1.1 can hold at 1190-1200 and go back to retest the high 1250 once more
1.2 can not hold at 1190, it should be expected to 1110.
Best of luck
Not a trading advise.
Trader PP
SPX BUY SPOT 8/61h had a unicorn setup I seen forming yesterday. Today I got on just after 7:30 am and saw price inside POI/IPA. All it did was WICK that gap, not fill it. I went against the 4h and 1h candles both being bearish because price reacted to the OPEN of the FVG. This makes it risky because we could still fill and sweep below that wick. Just had a little FOMO this morning once the reaction happened. No major news until tomorrow. I love the sweet spot where price is. Perfect HL area on 1 hour even tho we can sweep lower again, we shall see!


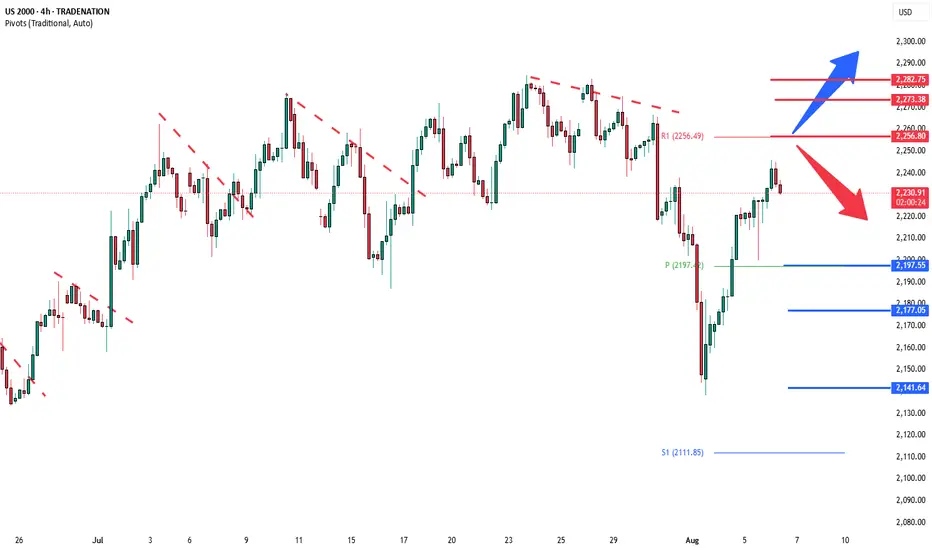
Russell2000 Key Trading LevelsKey Support and Resistance Levels
Resistance Level 1: 2256
Resistance Level 2: 2273
Resistance Level 3: 2282
Support Level 1: 2200
Support Level 2: 2177
Support Level 3: 2140
This communication is for informational purposes only and should not be viewed as any form of recommendation as to a particular course of action or as investment advice. It is not intended as an offer or solicitation for the purchase or sale of any financial instrument or as an official confirmation of any transaction. Opinions, estimates and assumptions expressed herein are made as of the date of this communication and are subject to change without notice. This communication has been prepared based upon information, including market prices, data and other information, believed to be reliable; however, Trade Nation does not warrant its completeness or accuracy. All market prices and market data contained in or attached to this communication are indicative and subject to change without notice.
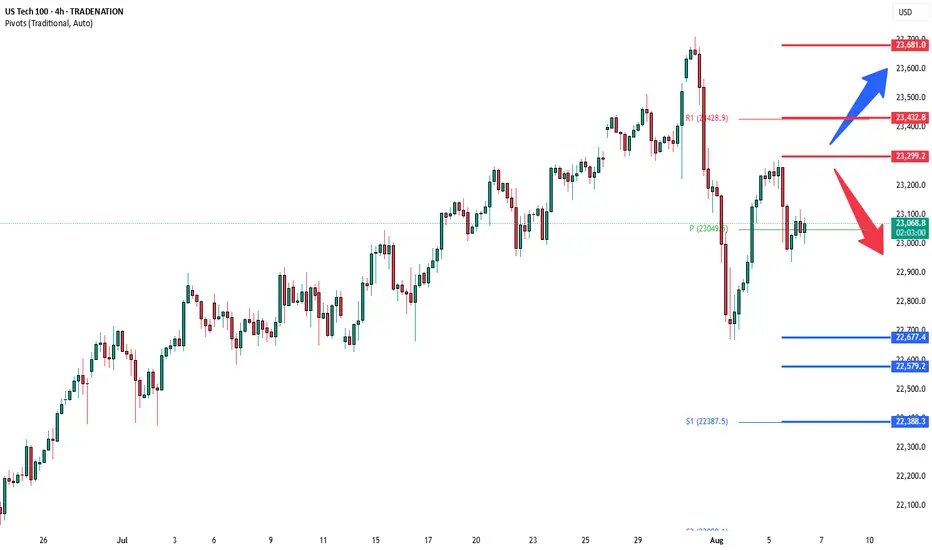
NSDQ100 Pre US Open Key Trading levelsTrade Policy & Tariff Risks:
Donald Trump escalated trade rhetoric, signaling higher tariffs on countries importing Russian energy, and previewing new tariffs on semiconductors and pharmaceuticals within days. This raises geopolitical and supply chain uncertainty—key risks for NSDQ 100 tech and healthcare stocks, particularly chipmakers, drug manufacturers, and firms exposed to global trade.
Swiss Tariff Dispute:
Swiss President Keller-Sutter is in Washington seeking to lower a newly imposed 39% tariff—highlighting the broader unpredictability of US trade actions, which could fuel market volatility and weigh on investor sentiment.
Ukraine Conflict & Sanctions Outlook:
As the US pushes toward an Aug. 8 deadline to resolve the Ukraine conflict, Trump's envoy is in Moscow. Potential Kremlin concessions (e.g., halting airstrikes) may reduce geopolitical risk premiums, especially for defense, energy, and global consumer tech firms.
Federal Reserve & Rate Policy:
With Fed Governor Kugler resigning, Trump is expected to name a replacement this week. His ongoing pressure on the Fed to cut rates adds policy uncertainty. This could support rate-sensitive NSDQ stocks in the near term, especially growth names in tech, if dovish expectations build.
Takeaway for NSDQ100 Traders:
Expect increased volatility around tariff news, Fed appointments, and geopolitical headlines. Traders should watch for:
Semiconductor stocks (e.g., NVDA, AMD, INTC) under pressure from tariff threats.
Big tech and biotech swings tied to pharma trade policy.
Potential relief rallies if Russia concessions materialize or Fed commentary turns dovish.
Key Support and Resistance Levels
Resistance Level 1: 23300
Resistance Level 2: 22430
Resistance Level 3: 23680
Support Level 1: 22677
Support Level 2: 22580
Support Level 3: 22388
This communication is for informational purposes only and should not be viewed as any form of recommendation as to a particular course of action or as investment advice. It is not intended as an offer or solicitation for the purchase or sale of any financial instrument or as an official confirmation of any transaction. Opinions, estimates and assumptions expressed herein are made as of the date of this communication and are subject to change without notice. This communication has been prepared based upon information, including market prices, data and other information, believed to be reliable; however, Trade Nation does not warrant its completeness or accuracy. All market prices and market data contained in or attached to this communication are indicative and subject to change without notice.
Dollar Index (DXY): Important Bearish BreakoutThe Dollar Index has fallen below a key daily/intraday support level,
which has now become resistance.
A bearish trend is likely to persist, with the next target set at 98.15.

London Session TradesSimplistic entry type where am combining support and resistance with TIME GER30 Killed

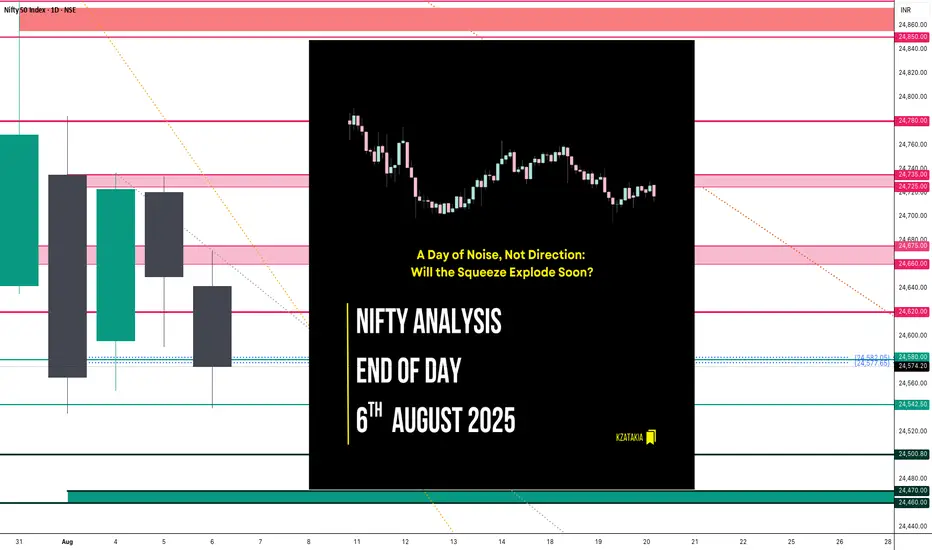
Nifty Analysis EOD – August 6, 2025 – Wednesday 🟢 Nifty Analysis EOD – August 6, 2025 – Wednesday 🔴
A Day of Noise, Not Direction: Will the Squeeze Explode Soon?
Nifty started flat with indecisive vibes, struggling initially around the 24,660 ~ 24,675 zone. After multiple failed attempts to hold, it slipped toward 24,580 — a cluster of PDL + S1 + Key Support — and broke below, forming the IB Low.
A quick bounce followed, but the index was firmly rejected near the VWAP + CPR + Fib zone, pushing it to a new day low at 24,544. Repeated intraday bounces faced selling pressure around 24,620, while 24,540 provided solid support — creating a tight intraday range.
Despite a perfect CPR setup for breakout, the market moved within just 132 points, the narrowest range in the last 4 sessions. A compression phase is building; breakout traders may soon get their moment.
📉 5 Min Time Frame Chart with Intraday Levels
🗣 Voice of the Intraday Option Buyer
Trend direction flipped multiple times — bearish to bullish and vice versa.
PDL + S1 zone experienced repeated fakeouts.
Low conviction moves on both sides frustrated momentum setups.
RBI event also not enough strong or trigger to guide directional bias.
Bank Nifty broke IB Low → IB High, closed strong; Nifty stayed muted.
Weekly expiry ahead — theta decay took control.
Many traders, including myself, anticipated a double inside bar breakout — but the trap continued.
Last 4 sessions (since Aug 1) have been painful for intraday option buyers — but it's all part of the game.
📉 Daily Time Frame Chart with Intraday Levels
🕯️ Daily Candle Breakdown
Open: 24,641.35
High: 24,671.40
Low: 24,539.20
Close: 24,574.20
Change: −75.35 (−0.31%)
Candle Structure:
Real Body: Red candle (67.15 pts)
Upper Wick: 30.05 pts
Lower Wick: 35.00 pts
Interpretation:
Attempted upside early on but couldn’t hold.
Both wicks show intraday tug-of-war; red close confirms sellers still in control.
Repeated rejection from 24,660–24,675 highlights weak bullish attempts.
Candle Type:
Bearish indecision candle — resembles an Inverted Hammer, indicating weakness despite dip buying attempts.
🔍 Nifty Short-Term View – As of August 6, 2025
Last 5 sessions show directional fatigue and failed bullish attempts above 24,700.
Two consecutive inside bars signal tight range and pending breakout.
Lower closes and long lower wicks = sellers dominate, but buyers defend dips.
Break below 24,535 = fresh selling.
Close above 24,660 = potential short-covering rally.
📌 Conclusion:
Nifty is coiling — a strong breakout may soon end this sideways-to-weak grind.
🛡 5 Min Intraday Chart
⚔️ Gladiator Strategy Update
ATR: 195.66
IB Range: 91.70 → Medium
Market Structure: Balanced
Trade Summary:
⏱ 10:35 AM – Short Entry → SL Hit
⏱ 12:15 PM – Long Entry → SL Hit
📏 Today's CPR Setup presenting...
Value Relationship: Inside Value → Breakout-Ready
Avg CPR Width: 37.54
Today’s CPR Width: 8.10 (🟠 21.58%)
CPR Type: Narrow → Perfect setup for big expansion
⚠️ Today’s setup didn’t deliver, but backtests show such narrow CPRs often explode in the following session.
📌 Support & Resistance Levels
🔼 Resistance Zones:
24,620
24,660 ~ 24,675
24,725 ~ 24,735
24,780 ~ 24,795
24,860 ~ 24,880
🔽 Support Zones:
24,542 ~ 24,535
24,500
24,470 ~ 24,460
🧠 Final Thoughts
The market is in consolidation mode with narrowing range. The double inside bar setup points to an imminent move — be prepared for a breakout trade soon. Don’t lose patience; big days often follow tough ones.
🛡 Disclaimer
This analysis is shared for educational purposes only. It is not trading advice. Please consult your financial advisor before making any trading decisions. Always trade with proper risk management.
SPX500 in Focus – Breakout Needed Above 6346SPX500 – Technical Overview
The price is currently showing bearish momentum as long as it remains below 6341 and 6323, with a downside target at 6283.
🔻 As long as the price trades below 6341, the bearish bias remains intact.
🔼 For the trend to shift bullish, we need a confirmed 1H close above 6346, which could open the path toward 6365 and higher.
🔹 Resistance: 6341, 6365, 6389
🔹 Support: 6298, 6283, 6247

Dow Jones Index Analysis (US30 / Dow Jones):The Dow Jones index showed a slight improvement at today’s market open and is currently trading near 44,300 USD, attempting to break through a nearby resistance level.
🔻 Bearish Scenario:
If the price fails to break above 44,300 USD and selling pressure returns, a break below 44,000 USD could send the index back toward 43,350 USD, which is considered a critical support zone in the short term.
🔺 Bullish Scenario:
However, if the index breaks above 44,300 USD and holds — which is currently the more likely scenario — we may see continued bullish momentum toward 44,700 USD, followed by the key resistance at 45,000 USD.
⚠️ Disclaimer:
This analysis is not financial advice. It is recommended to monitor the markets and carefully analyze the data before making any investment decisions.

Market Gains on Fed Optimism – Will 23440 Be Reached?Wall Street Edges Up Amid Fed Rate Cut Optimism; Earnings in Focus
U.S. stock indices rose on Wednesday, supported by growing expectations of Federal Reserve rate cuts later this year. Investors are also closely monitoring a fresh wave of corporate earnings, which continues to influence sentiment.
Technical Outlook
The price is currently holding above the key pivot level at 23045.
As long as it remains above this level, bullish momentum is expected to continue toward 23180 and 23295.
A confirmed breakout above 23295 would likely extend the rally toward 23440.
⚠️ On the other hand, a 1H close below 23045 would shift momentum to bearish, targeting 22870 and possibly 22725.
🔹 Resistance Levels: 23180, 23295, 23440
🔹 Support Levels: 22870, 22725

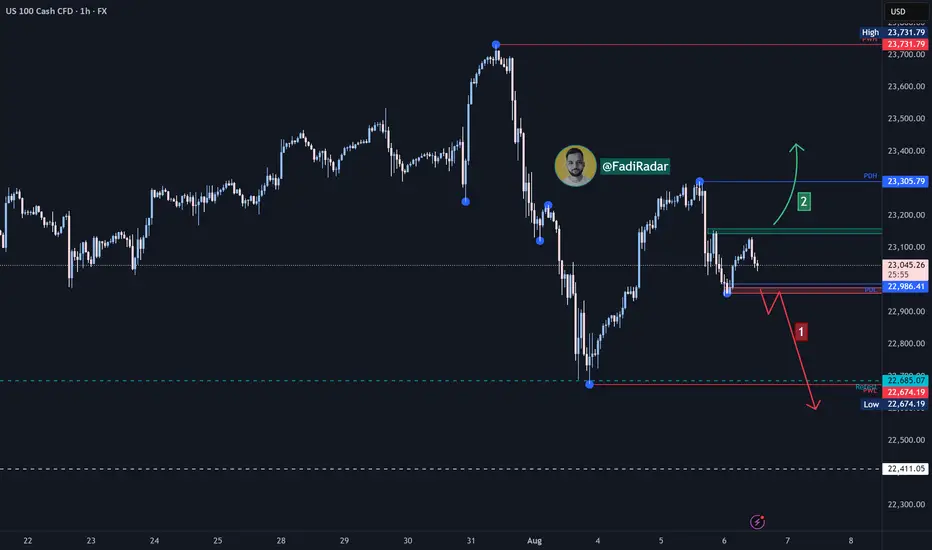
Nasdaq Index Analysis (US100 / NASDAQ):The Nasdaq index saw a slight improvement with today’s market open and is currently trading near 23,000 USD. The short-term trend remains bearish.
1️⃣ A break and close below 22,960 USD may push the price toward 22,670 USD as an initial target.
📉 Holding below that level could open the path to 22,400 USD.
2️⃣ However, if strong buying momentum leads to a break above 23,160 USD and price holds, we could see a move toward 23,300 USD, followed by 23,600 USD.
⚠️ Disclaimer:
This analysis is not financial advice. It is recommended to monitor the markets and carefully analyze the data before making any investment decisions.
ger30 stay al art on ger30 we follow according to trend confirmation nothing by the best stay positive and download the cash please don't for get the rules and relegation of trading don't risk or over trader
CAC40 Pivotal trading zone at 7730The CAC remains in a neutral trend, with recent price action showing signs of a corrective pullback within the broader uptrend.
Support Zone: 7520 – a key level from previous consolidation. Price is currently testing or approaching this level.
A bullish rebound from 7520 would confirm ongoing upside momentum, with potential targets at:
7730 – initial resistance
7787 – psychological and structural level
7830 – extended resistance on the longer-term chart
Bearish Scenario:
A confirmed break and daily close below 7520 would weaken the bullish outlook and suggest deeper downside risk toward:
7463 – minor support
7400 – stronger support and potential demand zone
Outlook:
Neutral bias remains intact while the CAC trades around pivotal 7730 level. A sustained break below or above this level could shift momentum.
This communication is for informational purposes only and should not be viewed as any form of recommendation as to a particular course of action or as investment advice. It is not intended as an offer or solicitation for the purchase or sale of any financial instrument or as an official confirmation of any transaction. Opinions, estimates and assumptions expressed herein are made as of the date of this communication and are subject to change without notice. This communication has been prepared based upon information, including market prices, data and other information, believed to be reliable; however, Trade Nation does not warrant its completeness or accuracy. All market prices and market data contained in or attached to this communication are indicative and subject to change without notice.
