Uptrend It is expected that the resistance level will be broken and after consolidation above the resistance level, the uptrend will continue. Otherwise, a trend change and a continuation of the correction will be likely.
Market indices
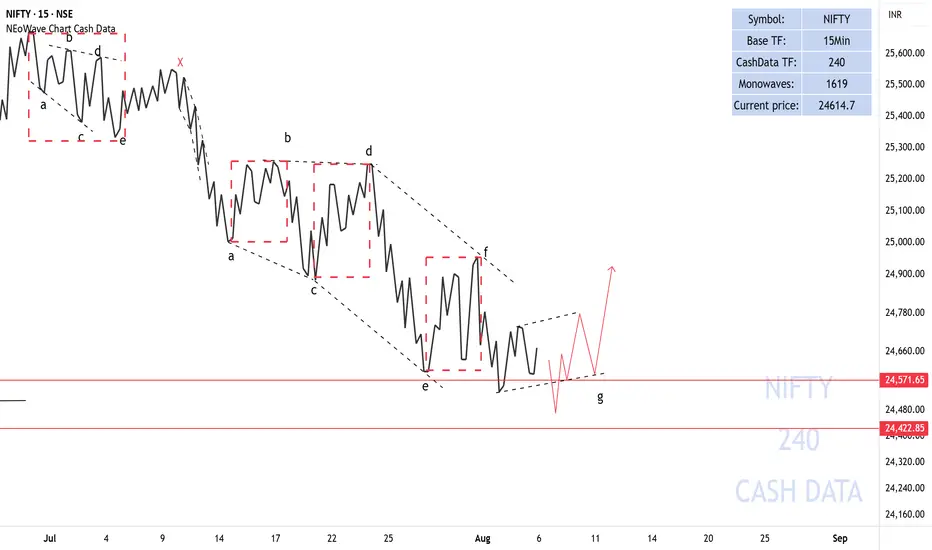
Forecasting the Movement of NIFTY50As previously mentioned, the NIFTY50 index is in the process of completing a diametric pattern. The news of the U.S. imposing tariffs on imports from India has already impacted the chart. Therefore, I believe the g-wave of the diametric will transform into a reverse contracting triangle, and the anticipated bullish correction, which I discussed earlier, will take shape in the NIFTY50.
Note:
If the U.S. imposes significantly heavier tariffs than the market expects, the g-wave may become larger.
Good luck
NEoWave Chart
US30 – Bullish Break Above 44,300.00After bouncing off 43,450.00, US30 surged past 44,120.00 and is now holding above the key 44,300.00 resistance-turned-support level.
Support at: 44,300.00 🔽 | 44,120.00 | 43,770.20
Resistance at: 44,700.00 🔼 | 44,922.00 | 45,136.10
🔎 Bias:
🔼 Bullish: Holding above 44,300.00 could fuel a rally toward 44,700.00 and beyond.
🔽 Bearish: A drop back below 44,300.00 may expose 44,120.00 and 43,770.20.
📛 Disclaimer: This is not financial advice. Trade at your own risk.


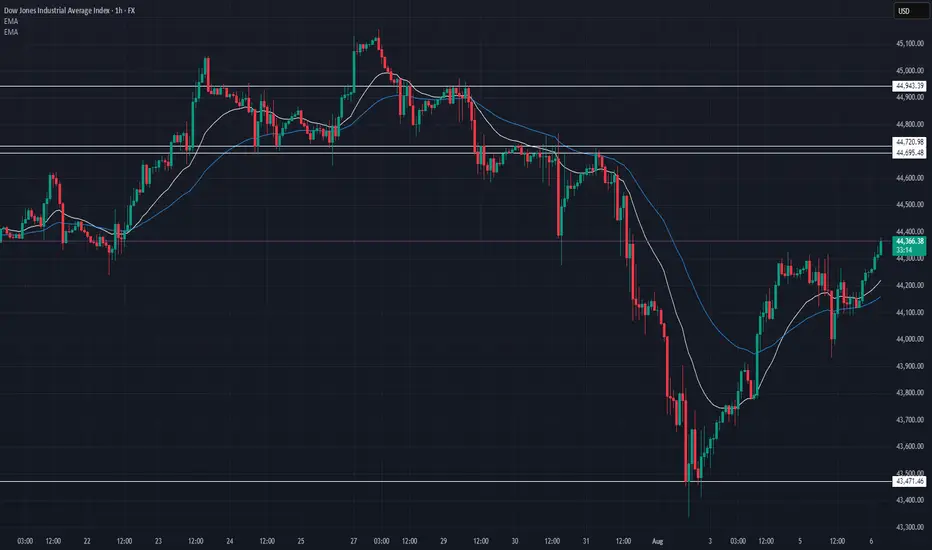
US30 Technical Breakdown – 08/06/2025📍 US30 Technical Breakdown – 08/06/2025
US30 continues its bullish recovery from the 43,500 lows and is now pressing into the 44,360 area. Price is printing higher highs and reclaiming key moving averages, building momentum ahead of the major 44,600–44,720 resistance zone.
A clean break above this range could open the door to 44,943+, while a failure may bring a pullback toward short-term support at 44,150–44,200.
📊 Current Market Behavior:
📈 Bullish momentum accelerating
📊 Price reclaiming structure above 44,300
🧱 Major test ahead at 44,600–44,720
⚠️ Overhead resistance – potential reversal zone
📌 Key Levels:
🔹 Resistance Zones:
44,380–44,400 → Immediate resistance (currently testing)
44,600–44,720 → Major breakout zone
44,943 → Last major high
🔹 Support Zones:
44,219–44,150 → EMA and structure support
44,000 → Psychological and structural support
43,471 → Recent swing low
🧠 Bias:
📈 Bullish Intraday
Momentum remains with buyers as long as price holds above 44,150. Key resistance test ahead.
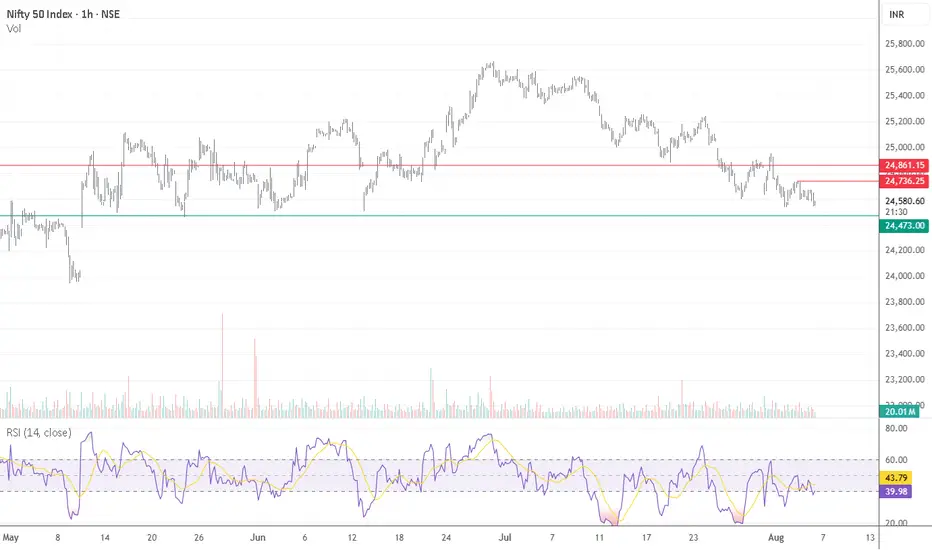
Nifty 50 – Immediate Trend Analysis (Hourly Chart)Nifty 50 – Immediate Trend Analysis (Hourly Chart)
On the hourly chart, Nifty 50 is exhibiting a clear downtrend, forming a pattern of lower highs and lower lows—signaling weakness in the immediate term.
The index has now approached a crucial support zone, which held strong multiple times during May and June, leading to a notable upside reversal in the past. This makes the current level a key inflection point.
If this support level holds, a short-term bounce is likely.
However, a break below this zone could accelerate the decline, potentially taking the index quickly towards the 24,000 level.
Key Takeaway:
Monitor this support zone closely for confirmation of a bounce or a breakdown to position accordingly.
#Nifty50 #NiftyAnalysis #TechnicalAnalysis #StockMarketIndia #NiftySupport #HourlyChart #Downtrend #MarketUpdate #NSE #IndexWatch #TradingStrategy #BreakdownOrBounce #PriceAction #ChartAnalysis #NiftyLevels
Potential bearish drop?S&P500 is rising towards the pivot, which is a pullback resistance that aligns with the 61.8% Fibonacci retracement and could drop to the 1st support.
Pivot: 6,362.20
1st Support: 6,214.78
1st Resistance: 6,436.72
Risk Warning:
Trading Forex and CFDs carries a high level of risk to your capital and you should only trade with money you can afford to lose. Trading Forex and CFDs may not be suitable for all investors, so please ensure that you fully understand the risks involved and seek independent advice if necessary.
Disclaimer:
The above opinions given constitute general market commentary, and do not constitute the opinion or advice of IC Markets or any form of personal or investment advice.
Any opinions, news, research, analyses, prices, other information, or links to third-party sites contained on this website are provided on an "as-is" basis, are intended only to be informative, is not an advice nor a recommendation, nor research, or a record of our trading prices, or an offer of, or solicitation for a transaction in any financial instrument and thus should not be treated as such. The information provided does not involve any specific investment objectives, financial situation and needs of any specific person who may receive it. Please be aware, that past performance is not a reliable indicator of future performance and/or results. Past Performance or Forward-looking scenarios based upon the reasonable beliefs of the third-party provider are not a guarantee of future performance. Actual results may differ materially from those anticipated in forward-looking or past performance statements. IC Markets makes no representation or warranty and assumes no liability as to the accuracy or completeness of the information provided, nor any loss arising from any investment based on a recommendation, forecast or any information supplied by any third-party.

Market will crash in August 2025, some gurus said !There are no lack of experts and gurus coming out to say the market will crash because of blah blah blah.......Take it with a pinch of salt and it is more important to base your decisions from your own research.
Of course, if you are heavily concentrated in one geographical region say US market or sector eg IT/AI/COMs etc then you might want to rebalance your portfolio a bit. However, if you know what you are doing or have domain knowledge , then stick to it.
Assuming these gurus are right, the market is going on a RISK off mode, ie, going to CRASH, then safe haven assets like GOLD, SILVER should rightfully be bullish.
In that case, let's monitor this chart and see how the market behaves in this month. It will be exciting !

U.S. Dollar Index (DXY) !!U.S. Dollar Index (DXY)
Long-Term Channel Support Held
The chart shows DXY moving within a rising parallel channel since around 2008.
Recent price action bounced right from the lower trendline (~98 zone), indicating strong structural support.
Bearish Pressure
DXY dropped below 100, currently around 98.72, down 1.32% this month.
Trading below the 200-month EMA, which suggests weakening long-term strength.
Bearish candlesticks forming near the lower channel indicate an increased risk of a breakdown if support fails.
Ichimoku Cloud Signal
Price below the Kumo (cloud) = bearish territory.
Cloud turning thin ahead — signaling potential indecision or transition.
What This Means for Markets
If the DXY breaks below this channel, it could trigger a broader USD sell-off, potentially bullish for cryptocurrencies, gold, and emerging markets.
If support holds, expect a rebound toward the 104–106 zone, especially if macro sentiment favors the dollar.
Stay updated and manage your risk accordingly.
DYOR | NFA

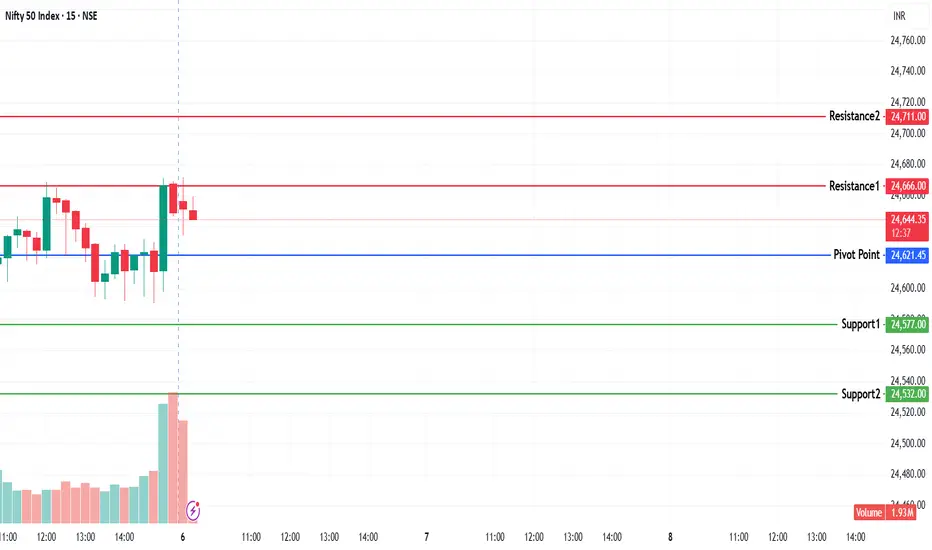
NIFTY KEY LEVELS FOR 06.08.2025NIFTY KEY LEVELS FOR 06.08.2025
If the candle stays above the pivot point, it is considered a bullish bias; if it remains below, it indicates a bearish bias. Price may reverse near Resistance 1 or Support 1. If it moves further, the next potential reversal zone is near Resistance 2 or Support 2. If these levels are also broken, we can expect the trend.
If the range(R2-S2) is narrow, the market may become volatile or trend strongly. If the range is wide, the market is more likely to remain sideways
📢 Disclaimer
I am not a SEBI-registered financial adviser.
The information, views, and ideas shared here are purely for educational and informational purposes only. They are not intended as investment advice or a recommendation to buy, sell, or hold any financial instruments.
Please consult with your SEBI-registered financial advisor before making any trading or investment decisions.
Trading and investing in the stock market involves risk, and you should do your own research and analysis. You are solely responsible for any decisions made based on this research.
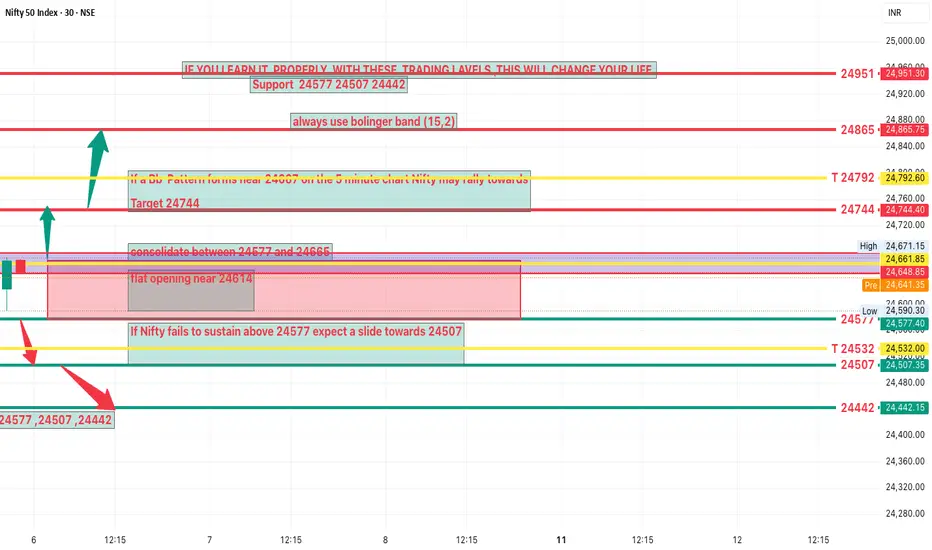
NIFTY Analysis 6 AUGUST, 2025 ,Morning update at 9 amDue to uncertainty in US tariffs on India short covering is unlikely
This global factor could lead to a flat opening near 24614
Expected Intraday Range
Likely to consolidate between 24577 and 24665
Upside Scenario
If a bb Pattern forms near 24666 on the 5 minute chart Nifty may rally towards
Target 24746
Downside Scenario
If Nifty fails to sustain above 24577 expect a slide towards
Support 24507
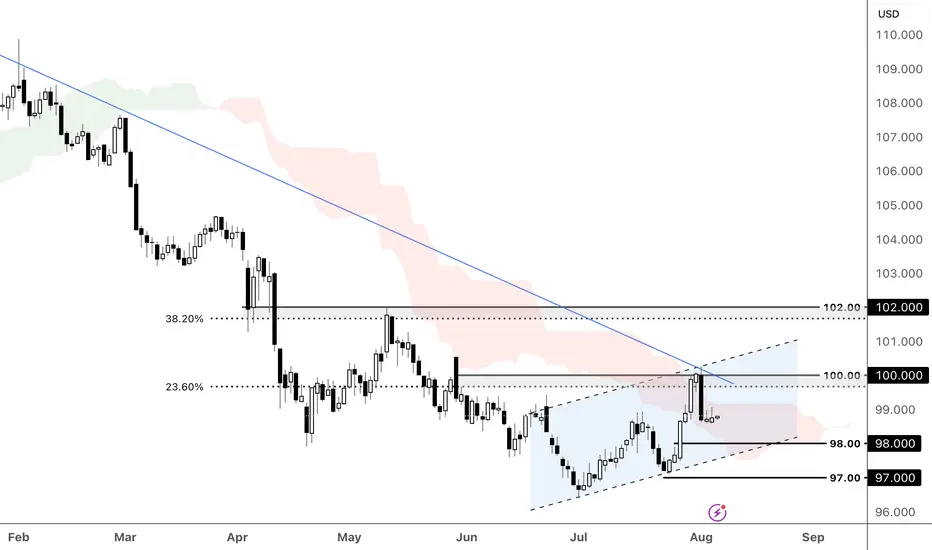
DXY is testing the descending trend line, breakout happening? The US dollar firmed as Trump's escalating tariff threats, from pharma to Indian exports, amplified trade tensions and boosted safe-haven flows. Despite rising global uncertainty, optimism over a possible US-China trade truce extension and a sharply narrower trade deficit also underpinned dollar strength.
DXY retreated below the descending trend line and the ascending channel's upper bound. The price is consolidating below the 100.00 psychological resistance, which aligns with the 23.6% Fibonacci Retracement. A rebound from the support at 98.00, in line with the ascending channel's lower bound, could prompt a retest of the channel's resistance, paving the way for further gains toward the 38.2% Fibonacci Retracement and 102.00 resistance, upon breaking 100.00. Conversely, a bearish breakout of the channel and close below the 98.00 support could prompt a further decline toward the following support at 97.00.
By Li Xing Gan, Financial Markets Strategist Consultant to Exness
US indices paused as fragile macro data undermined recent gains
US equity gains paused amid President Trump’s renewed tariff threats and weakening economic data. Trump warned of steep tariff hikes on India and a potential 35% levy on the EU if obligations are not met. Meanwhile, the US July Services PMI fell from 50.8 to 50.1, missing the 51.5 consensus. New orders dropped to 50.3, while employment declined to 46.4—the lowest since March.
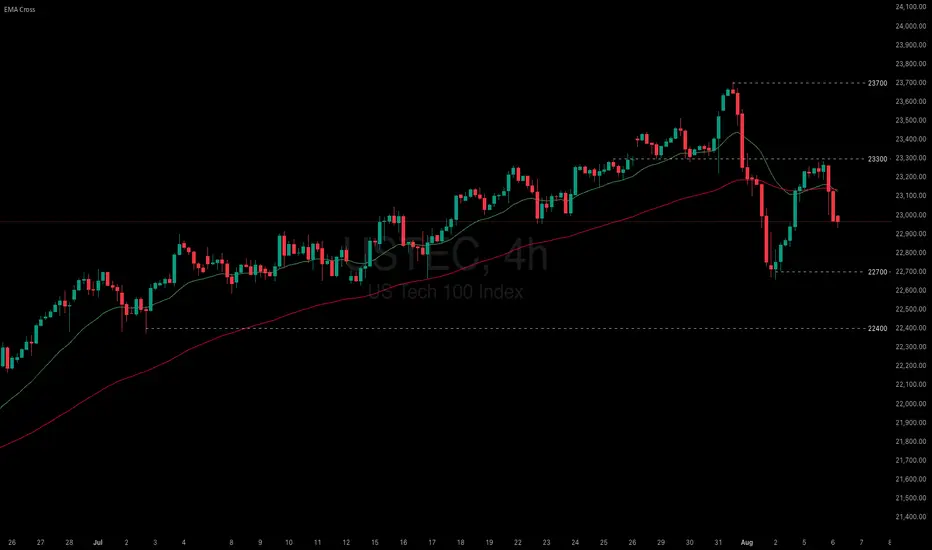
USTEC briefly tested 23300 before breaking below both EMAs. The widening gap between EMA21 and EMA78 suggests a potential shift toward bearish momentum. If USTEC fails to break above the resistance at 23300, the index could decline further toward 22700. Conversely, if USTEC breaks above both EMAs and 23300, the index may gain bullish traction toward 23700.
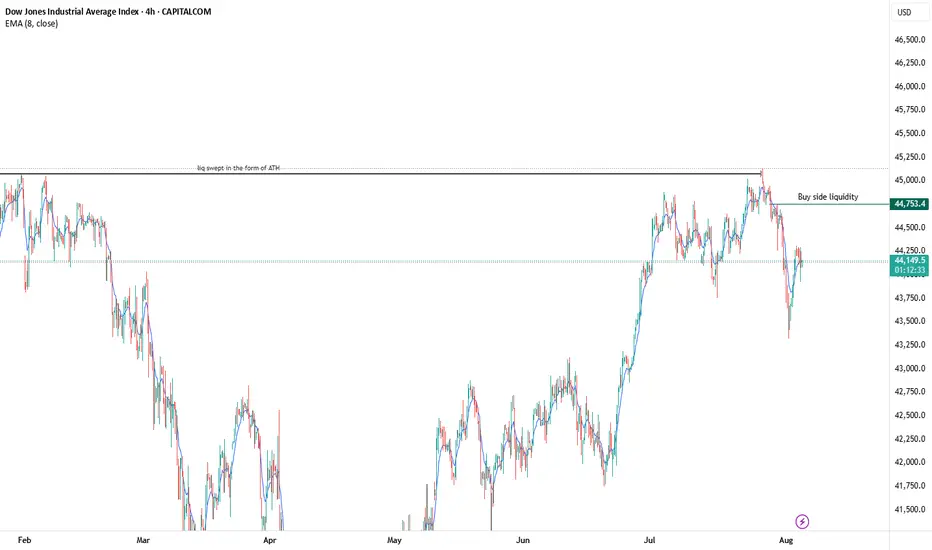
US30 Sell offmajor move to the downside coming up, once we get the buyside liquidity sweep ill be looking for a heavy short position. Liquidity has already been sept in the form of equal high at the area of all time high. the internal liquidity is what I'm looking for to get swept, then its all down hill from there. I will be holding this until it reaches a daily or monthly demand zone
NAS100 vs AUS200 ShortThis ratio measure is not net short on the regression break.
It indicates there is mis-pricing of risk and you should take cation in the coming weeks.

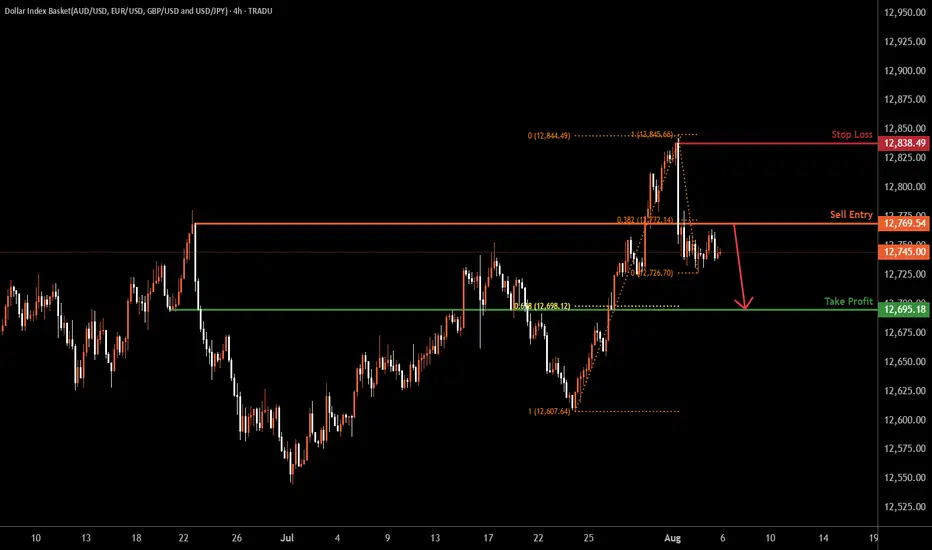
USDOLLA H4 | Bearish dropBased on the H4 chart analysis, we can see the price rise to the sell entry which is a pullback resistance and could drop from this level to the take profit.
Sell entry is at 12,769.54, which is a pullback resistance that lines up with the 38.2% Fibonacci retracement.
Stop loss is at 12,838,49, which is a swing high resistance.
Take profit is at 12,695.18, which is a pullback support that aligns with the 61.8% Fibonacci retracement.
High Risk Investment Warning
Trading Forex/CFDs on margin carries a high level of risk and may not be suitable for all investors. Leverage can work against you.
Stratos Markets Limited (tradu.com ):
CFDs are complex instruments and come with a high risk of losing money rapidly due to leverage. 65% of retail investor accounts lose money when trading CFDs with this provider. You should consider whether you understand how CFDs work and whether you can afford to take the high risk of losing your money.
Stratos Europe Ltd (tradu.com ):
CFDs are complex instruments and come with a high risk of losing money rapidly due to leverage. 66% of retail investor accounts lose money when trading CFDs with this provider. You should consider whether you understand how CFDs work and whether you can afford to take the high risk of losing your money.
Stratos Global LLC (tradu.com ):
Losses can exceed deposits.
Please be advised that the information presented on TradingView is provided to Tradu (‘Company’, ‘we’) by a third-party provider (‘TFA Global Pte Ltd’). Please be reminded that you are solely responsible for the trading decisions on your account. There is a very high degree of risk involved in trading. Any information and/or content is intended entirely for research, educational and informational purposes only and does not constitute investment or consultation advice or investment strategy. The information is not tailored to the investment needs of any specific person and therefore does not involve a consideration of any of the investment objectives, financial situation or needs of any viewer that may receive it. Kindly also note that past performance is not a reliable indicator of future results. Actual results may differ materially from those anticipated in forward-looking or past performance statements. We assume no liability as to the accuracy or completeness of any of the information and/or content provided herein and the Company cannot be held responsible for any omission, mistake nor for any loss or damage including without limitation to any loss of profit which may arise from reliance on any information supplied by TFA Global Pte Ltd.
The speaker(s) is neither an employee, agent nor representative of Tradu and is therefore acting independently. The opinions given are their own, constitute general market commentary, and do not constitute the opinion or advice of Tradu or any form of personal or investment advice. Tradu neither endorses nor guarantees offerings of third-party speakers, nor is Tradu responsible for the content, veracity or opinions of third-party speakers, presenters or participants.
GER40 – Rebounds Into 23,950 ResistanceFollowing a sharp selloff, GER40 found support near 23,400.00, triggering a strong recovery. Price is now reacting to the 23,950.00 resistance zone, a prior structure level.
Support at: 23,794.52 🔽 | 23,400.00 | 23,025.25
Resistance at: 23,950.00 🔼 | 24,200.00 | 24,300.00 | 24,652.29 (ATH)
🔎 Bias:
🔼 Bullish: Break and close above 23,950.00 opens room for 24,200.00 and higher.
🔽 Bearish: Failure to hold 23,794.52 may expose 23,400.00 and 23,025.25.
📛 Disclaimer: This is not financial advice. Trade at your own risk.

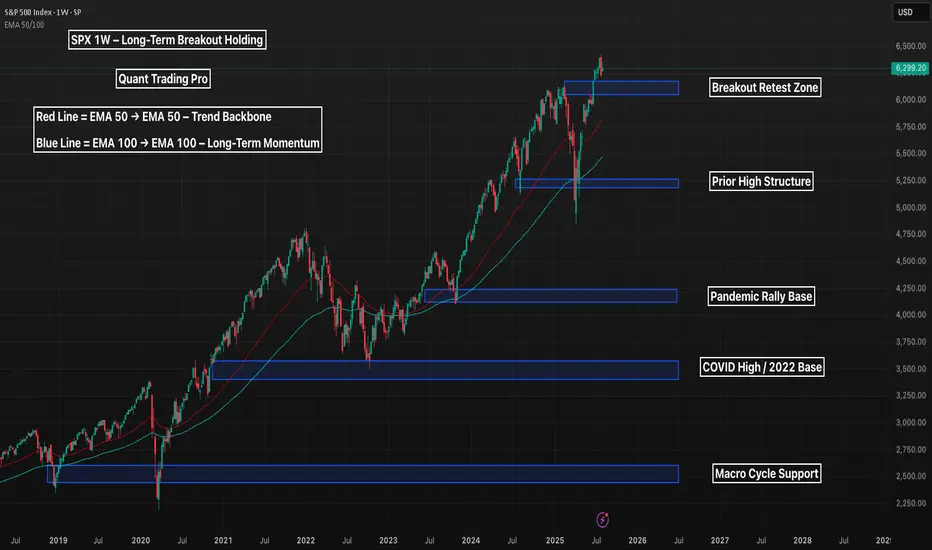
SPX 1W – Long-Term Breakout Holding, Can the Rally Sustain?The S&P 500 just printed a weekly breakout above historical highs, tapping into uncharted territory above 6,300 — but now the question is whether the trend can sustain or if a deeper retest is on the horizon.
🔹 Macro Structure
Multiple clean support levels exist below, each marking prior macro pivots — from the 2020 breakout to the 2022 base.
The most immediate zone of interest is 6,100–6,200, which could act as a bullish retest zone if this breakout is valid.
Deeper downside remains structurally healthy unless 4,250 or below is breached.
🔹 Trend Health
Price remains well above the EMA 50 and 100, showing no signs of structural weakness.
Pullbacks into the EMAs historically triggered trend continuation — and bulls will likely treat those zones as reload points.
🔹 Big Picture
As long as SPX holds above 5,400, the macro bull trend remains intact.
A drop to retest lower zones wouldn’t necessarily break the uptrend — but it would shake sentiment and invite reaccumulation.
Is this the beginning of a new macro leg — or the last shake before a deeper correction?
Let’s chart it out 👇
DXY 8H – Rejected Key Resistance, Can the Dollar Bounce Back?The U.S. Dollar Index (DXY) just got rejected off a key 8H supply zone near the psychological 100 level — failing to reclaim a level that previously acted as major support. With EMAs flattening and macro uncertainty rising, the dollar’s next move will have big implications across global markets.
🔹 Price Structure
The $100–$101.50 zone acted as support for months before breaking — and DXY just got rejected on its first retest.
The next resistance levels are stacked at $104, $108, and $110, each tied to prior breakdown points and macro peaks.
If DXY can't reclaim $100, a slide toward EMA support at ~$98 or even new lows remains in play.
🔹 EMA Signals
Price currently hovers between the EMA 50 and EMA 100 — an indecision zone often preceding trend continuation or reversal.
A breakdown below both EMAs would confirm momentum is stalling, while a reclaim of $100 could reignite the bullish push.
🔹 Implications for Risk Assets
If the dollar weakens from here, we could see renewed upside in crypto and equities.
Conversely, a reclaim and surge toward $104+ would likely pressure risk-on markets.
Is the DXY topping out — or just gearing up for another leg higher?
Let’s talk macro 👇

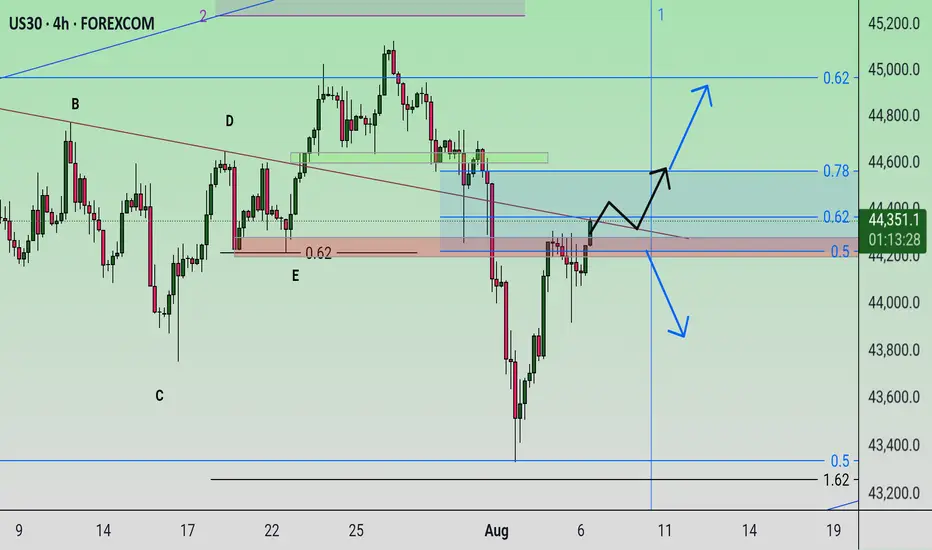
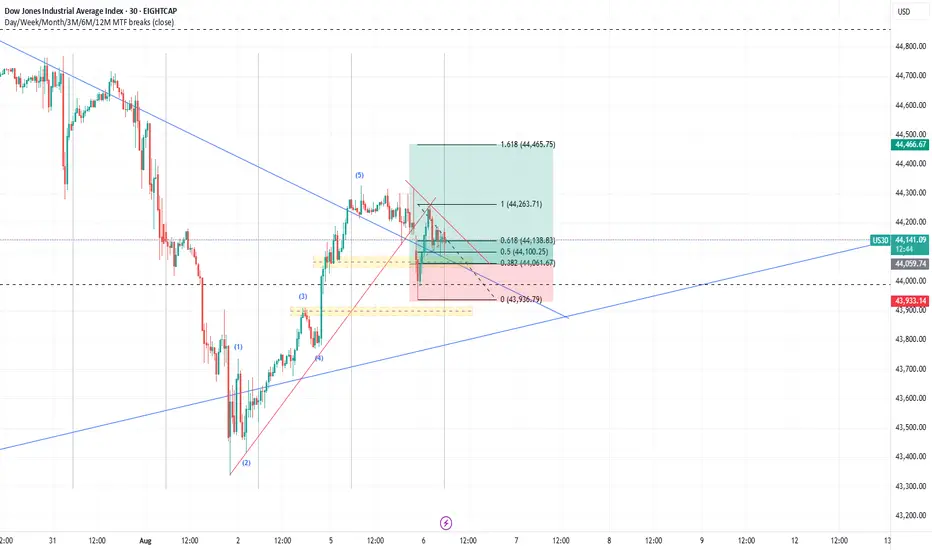
Dow Jones Potential DownsidesHey Traders, in today's trading session we are monitoring US30 for a selling opportunity around 44,300 zone, Dow Jones is trading in a downtrend and currently is in a correction phase in which it is approaching the trend at 44,300 support and resistance area.
Trade safe, Joe.


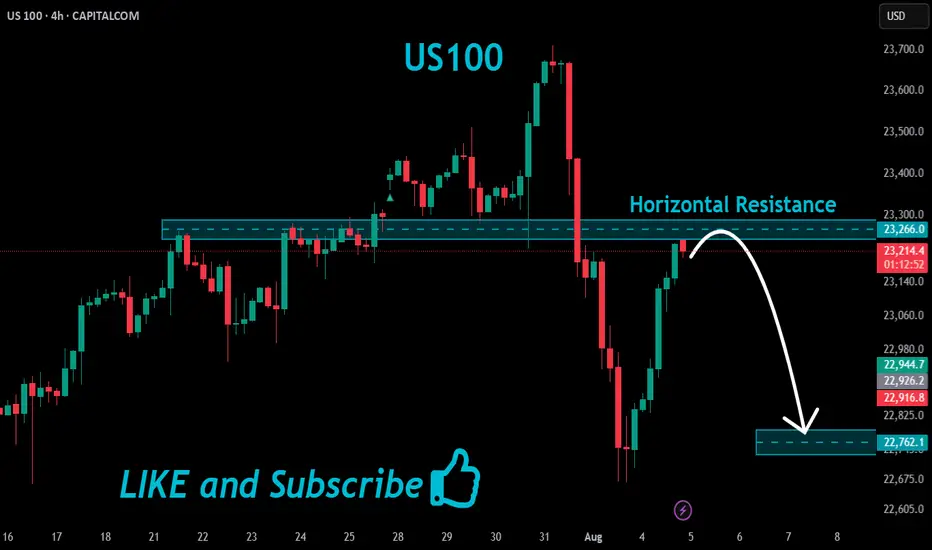
US100 Local Short!
HI,Traders !
#US100 made a retest
Of the horizontal resistance
Of 23266.0 and we are already
Seeing a bearish reaction and
We will be expecting a further
Bearish move down !
Comment and subscribe to help us grow !