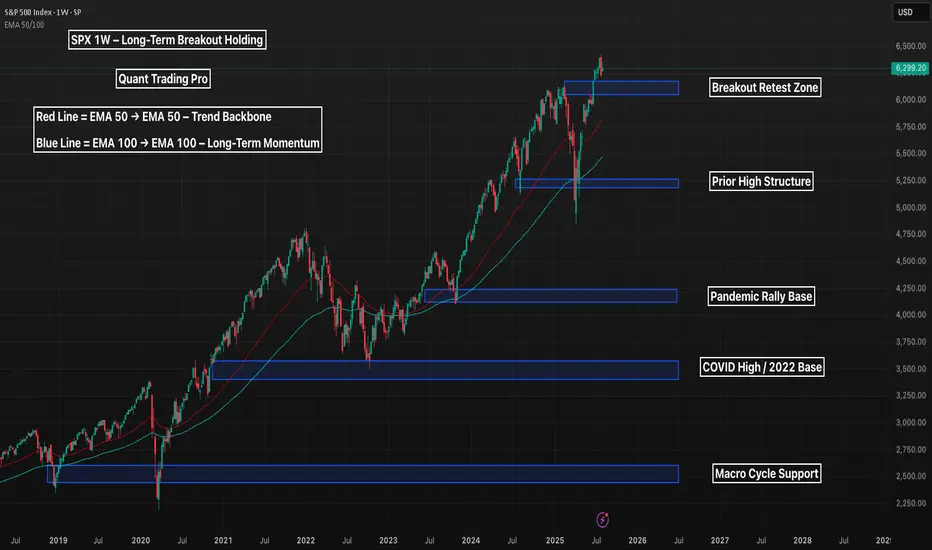
SPX 1W – Long-Term Breakout Holding, Can the Rally Sustain?The S&P 500 just printed a weekly breakout above historical highs, tapping into uncharted territory above 6,300 — but now the question is whether the trend can sustain or if a deeper retest is on the horizon.
🔹 Macro Structure
Multiple clean support levels exist below, each marking prior macro pivots — from the 2020 breakout to the 2022 base.
The most immediate zone of interest is 6,100–6,200, which could act as a bullish retest zone if this breakout is valid.
Deeper downside remains structurally healthy unless 4,250 or below is breached.
🔹 Trend Health
Price remains well above the EMA 50 and 100, showing no signs of structural weakness.
Pullbacks into the EMAs historically triggered trend continuation — and bulls will likely treat those zones as reload points.
🔹 Big Picture
As long as SPX holds above 5,400, the macro bull trend remains intact.
A drop to retest lower zones wouldn’t necessarily break the uptrend — but it would shake sentiment and invite reaccumulation.
Is this the beginning of a new macro leg — or the last shake before a deeper correction?
Let’s chart it out 👇
Market indices
DXY 8H – Rejected Key Resistance, Can the Dollar Bounce Back?The U.S. Dollar Index (DXY) just got rejected off a key 8H supply zone near the psychological 100 level — failing to reclaim a level that previously acted as major support. With EMAs flattening and macro uncertainty rising, the dollar’s next move will have big implications across global markets.
🔹 Price Structure
The $100–$101.50 zone acted as support for months before breaking — and DXY just got rejected on its first retest.
The next resistance levels are stacked at $104, $108, and $110, each tied to prior breakdown points and macro peaks.
If DXY can't reclaim $100, a slide toward EMA support at ~$98 or even new lows remains in play.
🔹 EMA Signals
Price currently hovers between the EMA 50 and EMA 100 — an indecision zone often preceding trend continuation or reversal.
A breakdown below both EMAs would confirm momentum is stalling, while a reclaim of $100 could reignite the bullish push.
🔹 Implications for Risk Assets
If the dollar weakens from here, we could see renewed upside in crypto and equities.
Conversely, a reclaim and surge toward $104+ would likely pressure risk-on markets.
Is the DXY topping out — or just gearing up for another leg higher?
Let’s talk macro 👇

Dow Jones Potential DownsidesHey Traders, in today's trading session we are monitoring US30 for a selling opportunity around 44,300 zone, Dow Jones is trading in a downtrend and currently is in a correction phase in which it is approaching the trend at 44,300 support and resistance area.
Trade safe, Joe.


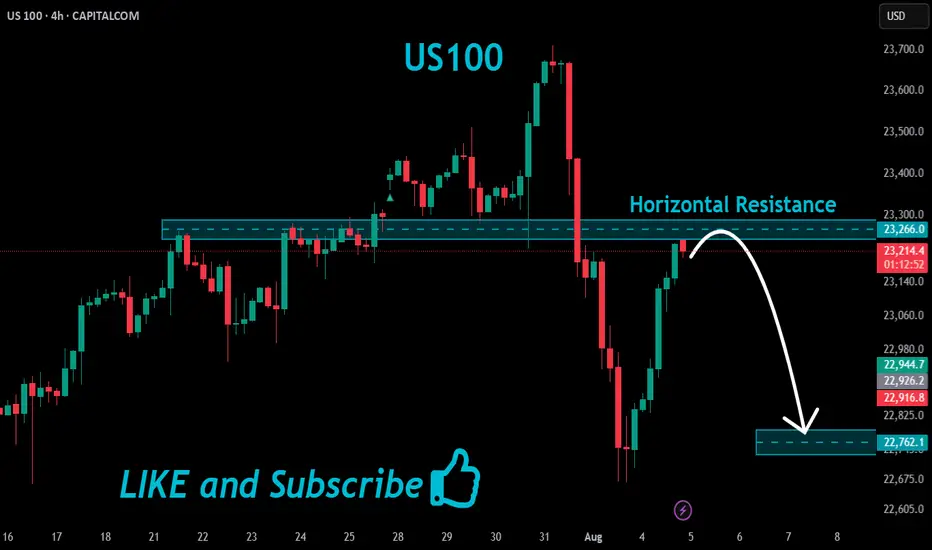
US100 Local Short!
HI,Traders !
#US100 made a retest
Of the horizontal resistance
Of 23266.0 and we are already
Seeing a bearish reaction and
We will be expecting a further
Bearish move down !
Comment and subscribe to help us grow !
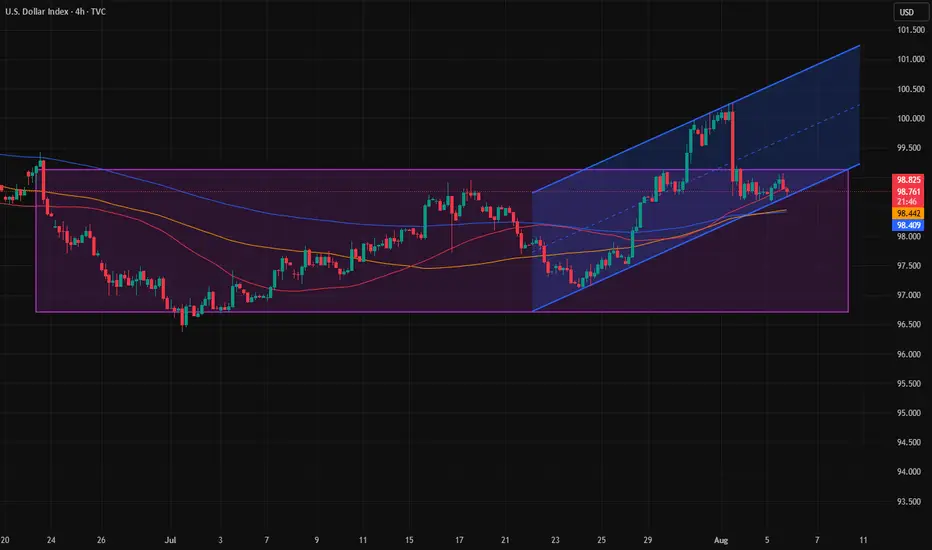
Breakout from the channel again?After a long period of ranging, the DXY finally managed to break the range's ceiling last week and even gave us a channel confirmation afterward. But if you remember, there were several major news events last week, with the last one on Friday causing the price to fall back into the range. Now we can see that an ascending channel has formed inside the range, and the price is currently at the bottom of that channel. If it manages to break out of the channel again, there’s a chance that this time the trend might truly reverse.
Targets achieved ni NIFTY 50 THE RESULT
Follow for more Simple And accurate swing analysis on Indices, Currency, Commodities.
Targets Achieved in NIFTY 50 THE RESULT
Follow for more Simple And accurate swing analysis on Indices, Currency, Commodities.

In the middle of IndecisionIf we can close the 4h-Candle above 23,409 or 23220 level, then we are extremely bullish and might break above the recent high of 23715. If not, we might see a pullback towards 50% retracement at 22176 and even further.

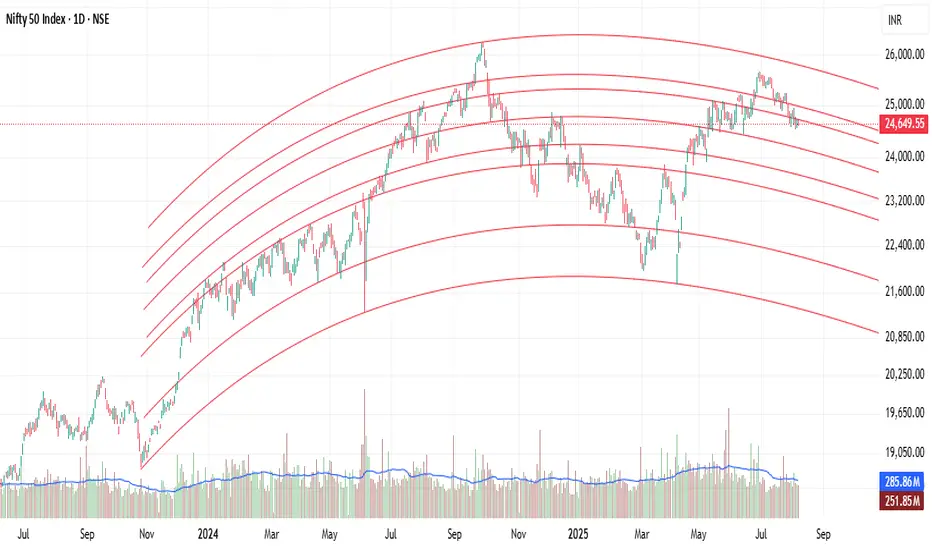
BANKNIFTYThe movement slope of the chart is constantly over the time therefore it is not possible to find the next tops by using the simple trend lines.
Thus it may be a better idea to use curved lines instead of straight lines.
Now we draw again. by doing it this way, we were able to find the exact location of the next 2-3 Tops or Bottoms in the chart.

How curved line gives better ideaThe momentum slope of the chart changes constantly over time, so it is not possible to find the next top using simple trend lines.
So it may be a better idea to use curved lines instead of straight lines.
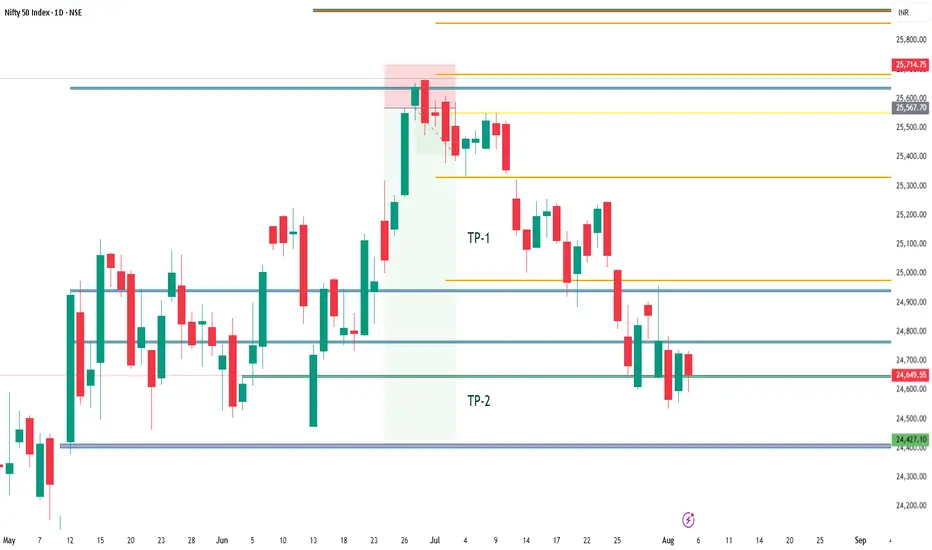
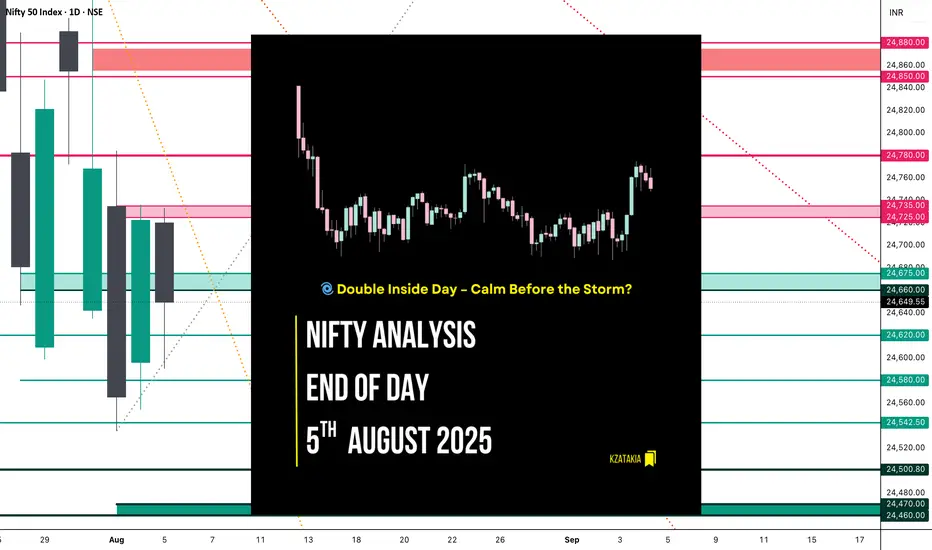
Nifty Analysis EOD – August 5, 2025 – Tuesday 🟢 Nifty Analysis EOD – August 5, 2025 – Tuesday 🔴
🌀 Double Inside Day – Calm Before the Storm?
📊 Nifty Summary
In the wind of negative news, yet Nifty starts neutral at the resistance zone of 24,725 ~ 24,735 but was unable to hold there and fell 140 points within the first 45 minutes.
After this initial sell-off, Nifty found support around 24,590, which coincided with yesterday's Fib 0.786 level, R1, and Previous Week Low (PWL).
These levels were well-defended throughout the session. Near the end, the index recovered ~80 points and closed at 24,649.55, close to yesterday’s Fib 0.5.
Can we consider today's move a retracement or a pullback of yesterday's move?
Same as Monday, today’s action stayed inside the previous session’s range, forming an Inside Bar. Now it appears as a Double Inside Bar on the daily chart.
📉 5 Min Time Frame Chart with Intraday Levels
📉 Daily Time Frame Chart with Intraday Levels
🕯 Daily Candle Breakdown
Open: 24,720.25
High: 24,733.10
Low: 24,590.30
Close: 24,649.55
Change: −73.20 (−0.30%)
Candle Structure Breakdown:
🔴 Red Candle (Close < Open):
24,720.25 − 24,649.55 = 70.70 points
🔼 Upper Wick:
24,733.10 − 24,720.25 = 12.85 points
🔽 Lower Wick:
24,649.55 − 24,590.30 = 59.25 points
Interpretation:
After a flat open, the index tried to move higher but faced resistance near 24,730, then reversed.
Buying interest was seen near the 24,590 zone, but sellers remained in control.
It closed below the open with a decent lower wick, indicating some buying support but overall weakness.
Candle Type:
🕯 A pullback candle with a moderate real body and long lower wick – suggests buyers attempted to support the fall, but sellers dominated.
🛡 5 Min Intraday Chart
⚔️ Gladiator Strategy Update
ATR: 202.71
IB Range: 139.95 → 🟠 Medium
Market Structure: Balanced
Trade Summary:
❌ No entry triggered by system
📌 Support & Resistance Levels
🔼 Resistance Zones:
24,725 ~ 24,735
24,780 ~ 24,795
24,860 ~ 24,880
🔽 Support Zones:
24,675 ~ 24,660
24,620
24,542 ~ 24,535
24,500
24,470 ~ 24,460
🧠 Final Thoughts
Today's double inside bar structure signals contraction and indecision — markets are waiting for a decisive breakout.
“The tighter the coil, the bigger the breakout.”
Keep an eye on these tight ranges. Patience before power!
✏️ Disclaimer
This is just my personal viewpoint. Always consult your financial advisor before taking any action.
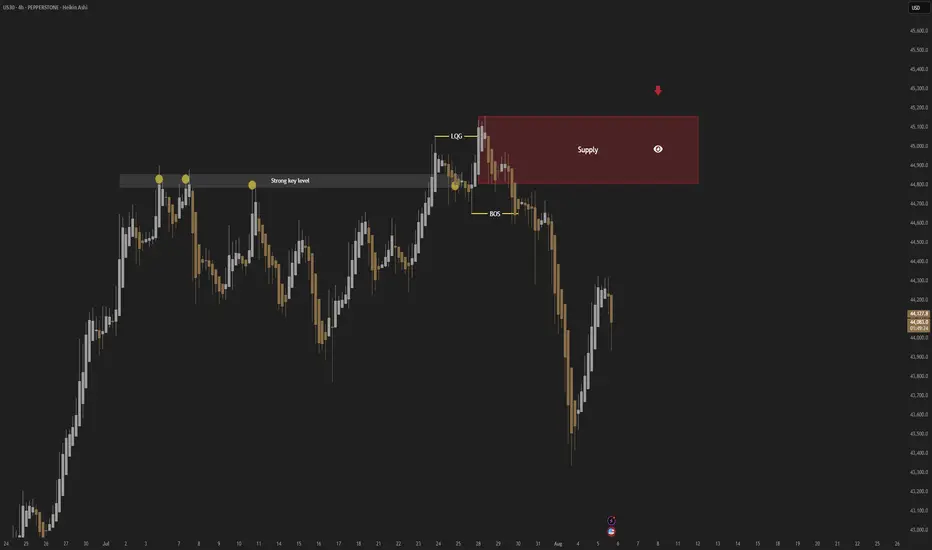
US30; Heikin Ashi Trade Idea📈 Hey Traders!
Here’s a fresh outlook from my trading desk. If you’ve been following me for a while, you already know my approach:
🧩 I trade Supply & Demand zones using Heikin Ashi chart on the 4H timeframe.
🧠 I keep it mechanical and clean — no messy charts, no guessing games.
❌ No trendlines, no fixed sessions, no patterns, no indicator overload.
❌ No overanalyzing market structure or imbalances.
❌ No scalping, and no need to be glued to the screen.
✅ I trade exclusively with limit orders, so it’s more of a set-and-forget style.
✅ This means more freedom, less screen time, and a focus on quality setups.
✅ Just a simplified, structured plan and a calm mindset.
💬 Let’s Talk:
💡Do you trade supply & demand too ?
💡What’s your go-to timeframe ?
💡Ever tried Heikin Ashi ?
📩 Got questions about my strategy or setup? Drop them below — ask me anything, I’m here to share.
Let’s grow together and keep it simple. 👊

ISM Report Causes Big red candle🚨 News Candle - ISM report lower than expected 50.5, Actual 50.1 . Big red candle in USTECH / NASDAQ
#ustech #nasdaq #ism

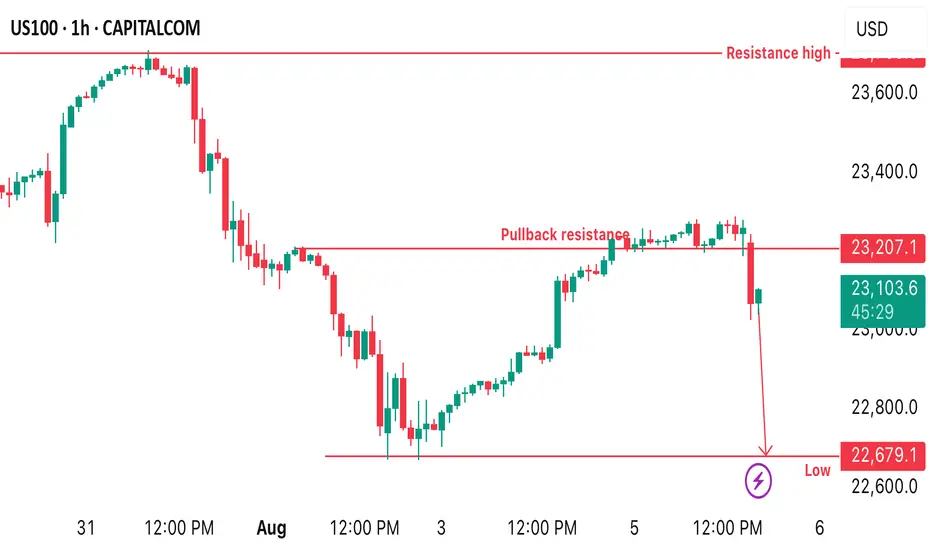
US100 reacts at pullback resistance US100 price reacts nicely at a pullback resistance with a strong rejection which supports the idea of selling from the current price. Therefore, a sell opportunity is envisaged from the current market price.
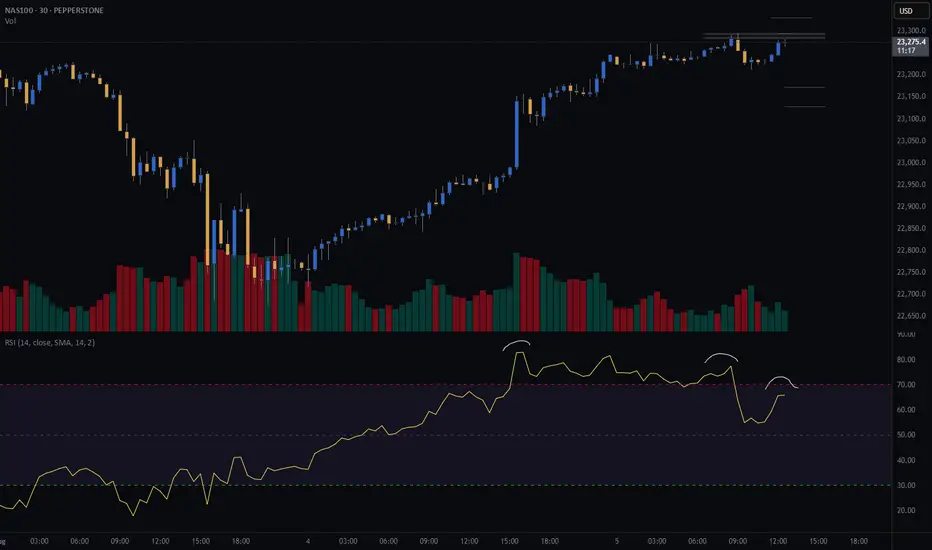
NAS100 (CASH100) Short - Double top 30minThe 15min head and shoulders setup got invalidated.
However, my double top variables are currently being met.
Still need confirmation before entering trade.
Risk/reward = 2.7
Entry price = 23 284
Stop loss price = 23 331
Take profit level 1 (50%) = 23 173
Take profit level 2 (50%) = 23 129
What does everyone thing the NASDAQ is going to do today?
NIKKEI: Strong Bullish Momentum Driven by Favorable IndicatorsData analysis indicates a "Bullish" bias for the NIKKEI, with a strong overall score. This positive outlook is supported by a confluence of factors, including Commitments of Traders (COT) data, retail positioning, seasonality, and trend. While some economic data points show neutrality or slight negativity, the overriding sentiment and key technical factors suggest a continued upward trajectory for the NIKKEI.
Key Supporting Factors (Bullish):
Strong Technicals/Momentum: The "Trend" and "Seasonality" scores of 2 each suggest strong underlying bullish momentum and favorable seasonal patterns for the NIKKEI.
COT & Retail Positioning: Positive scores in "COT" and "Retail Pos" (both 2) often indicate that institutional money and retail traders are aligned in a bullish direction, providing a strong foundation for upward movement.
GDP, SPMI, Retail Sales: These economic indicators, with scores of 1, are contributing positively to the overall bullish bias, indicating healthy economic activity.

Long entry ON 1min off of daily bullish retracemen going into exMy overall bias is bullish and on the daily price was retracing into a high volume node which I then zoom into the 1min to find an entry. that entry was in a smaller time frame palace zone which price purge and heading upwards. Final TP is at 16.18rr due to me be trying to pass a phase in a prop firm. The real tp is like 40rr if I wasn't doing a challange

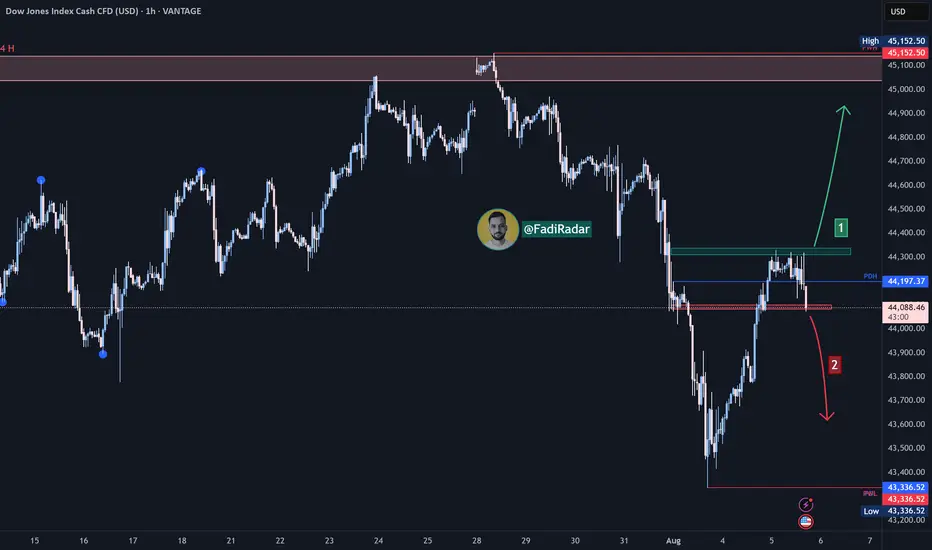
Dow Jones Index (US30) Technical Analysis:The Dow Jones is currently trading near $44,100, after a strong bullish move that failed to break through the $44,300 resistance zone.
🔹 Bearish Scenario:
If the price breaks below $44,000 and holds, it may head toward the $43,350 support level.
🔹 Bullish Scenario:
If bullish momentum returns and the price breaks above $44,300, the next target may be around $45,100.
⚠️ Disclaimer:
This analysis is not financial advice. It is recommended to monitor the markets and carefully analyze the data before making any investment decisions.
Rob the DAX! GER40 Bullish Mission Begins Now!🏴☠️GER40 Bullish Vault Heist! Target: 25400 🎯💼
🚨Mission Briefing: Robbery in Progress - DE40 / Germany40 Index Heist!
🎯 Plan: Bullish
🗂️ Asset: DE40 / GER40 “Germany40” Index
📦 Strategy: Thief’s signature Layered Limit Orders 🧱 (Multi-entry precision loading)
🔑 Entry Point:
"The vault is open 24/7! Thief goes in anytime 🔓💰"
Place multiple buy limit orders at recent swings / lows on the 15m-30m chart.
📲 Tip: Set alerts at breakout zones. Be early. Be greedy.
🚨 Stop Loss:
🎯 SL at 23,300 🔐 – beneath 4H structure (swing low wick-based).
Adjust SL based on lot size and number of active entries.
🏆 Escape Point (Target):
💼 25,400 = Target stash 💰
🔥 Use Trailing SL and ride the wave – exit before the trap if market hesitates!
📈 Scalpers / Swingers Alert:
💎 Only Long-side loot allowed!
💸 Small capital? Join the swing team 🚀
💰 Big capital? Front-run the breakout!
🎯 Trailing SL = Smart thieves protect profits.
🧠 Why Bullish?
The index is warming up after consolidation. Neutral bias flipping bullish 🔄 due to:
📰 Weakening macro shock absorbers
💣 Risk appetite reviving
💡 Institutional positioning + COT shift
🔄 USD reaction + EU equity flow
💼 Check all macro + intermarket juice for full confidence 📊🔗
⚠️ Risk Management Tips for Robbers:
🕰 Avoid news hour trades
🔄 Use Trailing SL always
📉 Don't chase… let the market come to you
👀 Eyes on economic calendar and VIX movement
❤️ Support the Robbery Crew!
💥 Hit that BOOST button if you love making money the Thief Way 🏴☠️
🎯 Help us grow the robbery empire & take over the charts 📈💰
🧨 Another Heist Plan coming soon! Stay sneaky, stay funded 🤑🐱👤💼
#ThiefTrader #GER40Plan #IndexHeist #LayeredLoot #MarketRobbery #FTSEStyleRobbery

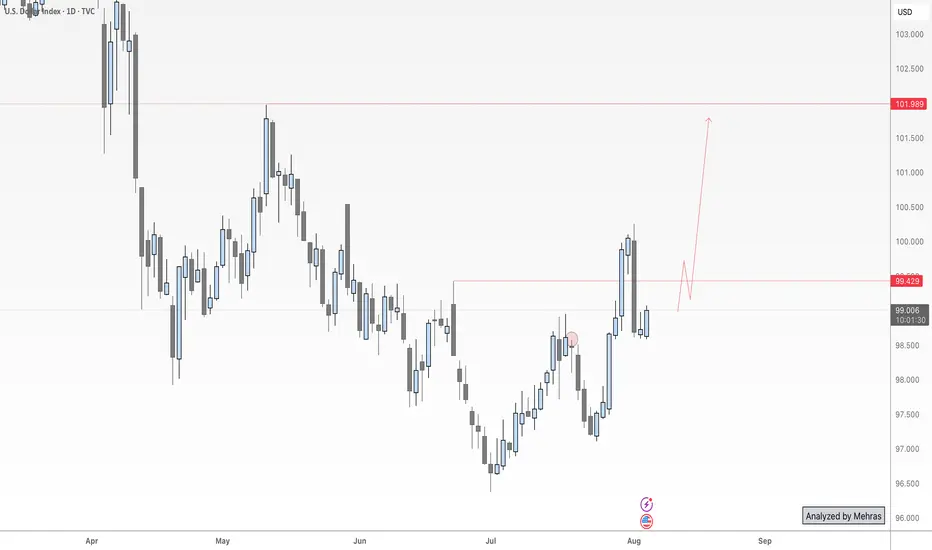
Dollar Index Update – Holding Gains After NFP Data📈 DXY Outlook – Ready for the Next Leg Up?
Last Friday, as NFP data hit the market, I published an analysis highlighting this exact move—and so far, price has respected the roadmap perfectly.
Now, with momentum building and structure aligning, the Dollar Index looks poised to continue its bullish run—first toward the 101 zone and potentially higher toward 102.
But here’s the key point for swing traders and risk-conscious setups:
🔍 If we’re aiming for higher targets with minimal drawdown, tonight’s daily candle close will be crucial.
A bullish close above yesterday’s high would not only confirm strength, but significantly reduce entry risk for long positions.
So, whether you’re already in the trade or waiting for confirmation, patience tonight could pay off.
Let’s see if the bulls can seal the deal with a strong daily close.
🔁 This analysis will be updated whenever necessary.
Disclaimer: This is not financial advice. Just my personal opinion.
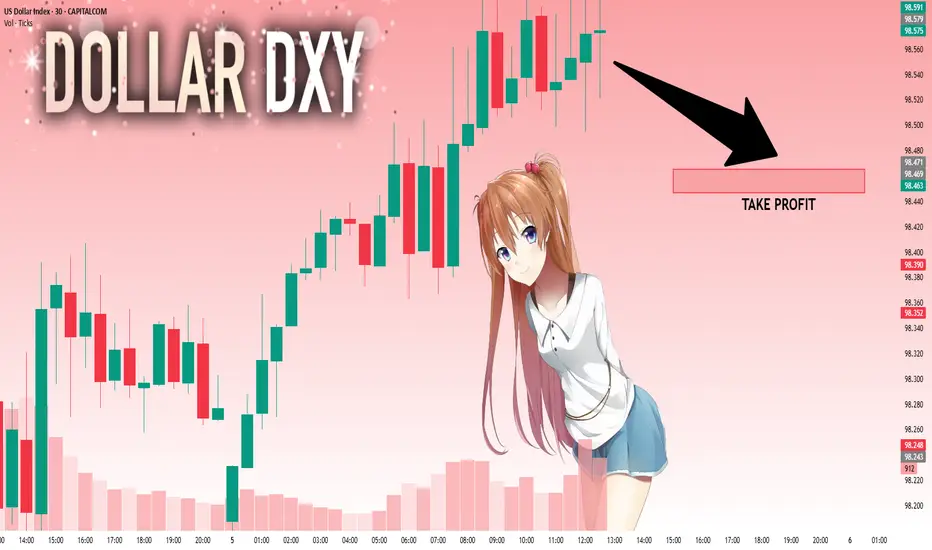
DXY: Absolute Price Collapse Ahead! Short!
My dear friends,
Today we will analyse DXY together☺️
The market is at an inflection zone and price has now reached an area around 98.553 where previous reversals or breakouts have occurred.And a price reaction that we are seeing on multiple timeframes here could signal the next move up so we can enter on confirmation, and target the next key level of 98.471.Stop-loss is recommended beyond the inflection zone.
❤️Sending you lots of Love and Hugs❤️