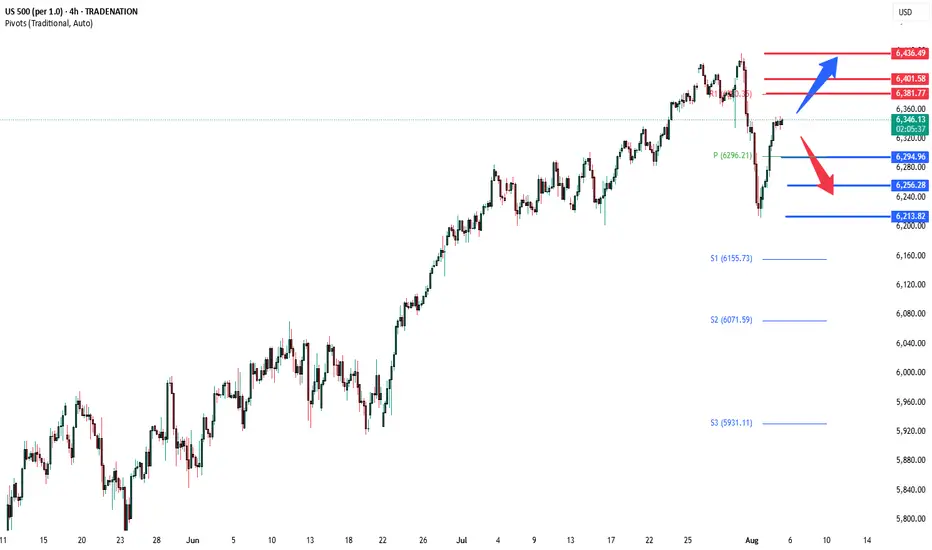
S&P500 at pivot zone Stocks are climbing higher, with S&P 500 futures up on hopes for interest rate cuts and solid company earnings. The outlook is positive, especially in the finance world—bankers, hedge funds, and asset managers are expected to get higher bonuses this year, reflecting stronger market conditions.
On the global front, the US is looking to tighten control over chip exports to China by adding better tracking in semiconductors. At the same time, Taiwan’s TSMC reported a possible leak of trade secrets, which led to arrests.
Trade talks are also heating up. Japan and Switzerland are sending officials to the US to push for lower tariffs, while India’s government is heading to Moscow just after criticism from the US over its Russian oil purchases.
Conclusion for S&P 500:
The rally has strong backing from earnings and rate-cut hopes, but investors should be alert. Rotation into small-cap stocks could continue, while tech and chip sectors may face headwinds from new trade and security pressures.
Key Support and Resistance Levels
Resistance Level 1: 6380
Resistance Level 2: 6400
Resistance Level 3: 6436
Support Level 1: 6295
Support Level 2: 6256
Support Level 3: 6214
This communication is for informational purposes only and should not be viewed as any form of recommendation as to a particular course of action or as investment advice. It is not intended as an offer or solicitation for the purchase or sale of any financial instrument or as an official confirmation of any transaction. Opinions, estimates and assumptions expressed herein are made as of the date of this communication and are subject to change without notice. This communication has been prepared based upon information, including market prices, data and other information, believed to be reliable; however, Trade Nation does not warrant its completeness or accuracy. All market prices and market data contained in or attached to this communication are indicative and subject to change without notice.
Market indices
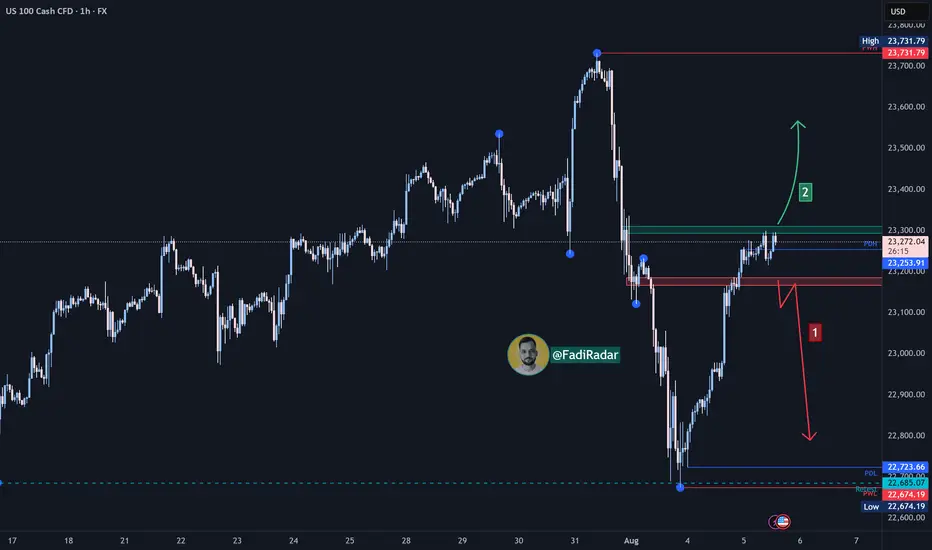
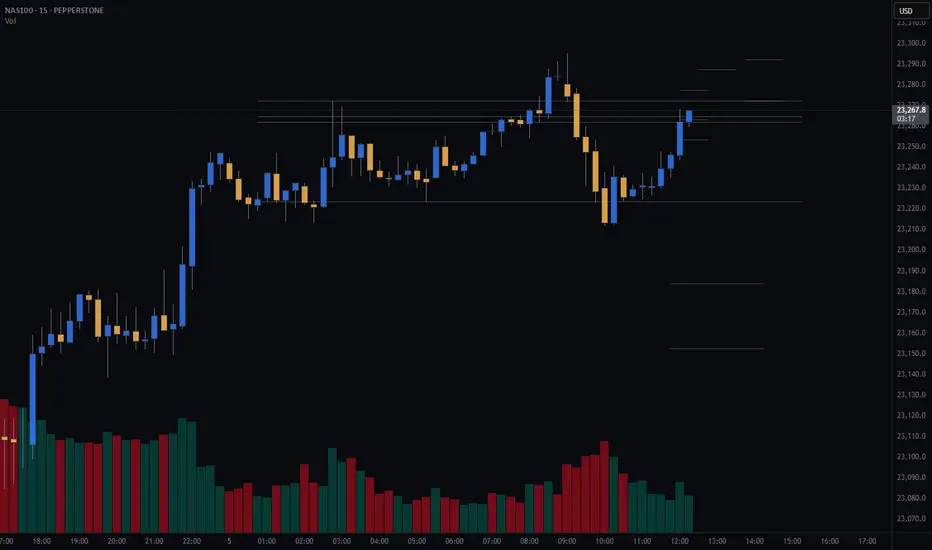
Nasdaq Index (US100 / NASDAQ) Technical Analysis:The Nasdaq Index showed improvement at the market open today and is currently trading near the $23,300 level, with price action building at a key resistance zone.
🔹 Bearish Scenario:
If the price retraces to $23,170 and breaks below it, a move toward $22,970 could follow as the next support target.
🔹 Bullish Scenario:
If the price breaks above $23,300 and holds, bullish momentum could drive the index toward $23,600.
⚠️ Disclaimer:
This analysis is not financial advice. It is recommended to monitor the markets and carefully analyze the data before making any investment decisions.
SHORT ON US30US30 Has given us a nice CHOC (Change of Character) to the downside.
This indicates a huge potential of US30 dropping more after it pulls back into the supply zone that created the change.
Dollar news is also a catalyst today for this play. If news comes out good for PMI and makes the dollar rise... US30 could fall almost 3000 points over the next few days.
Take Advantage.

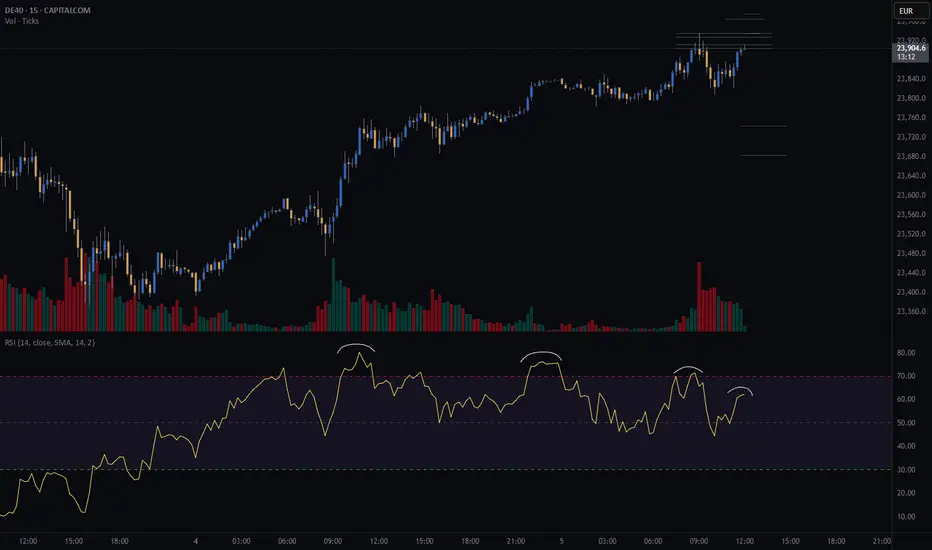
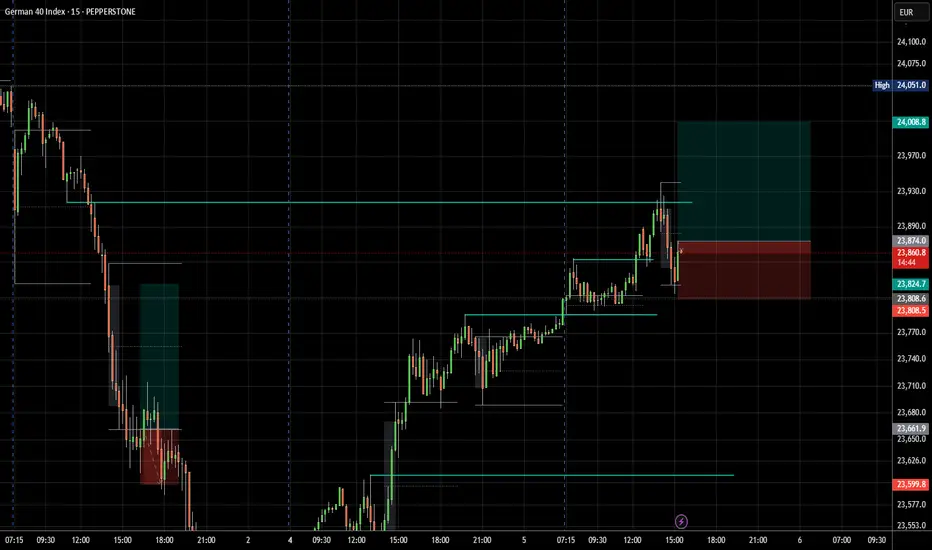
GER40 (DE40) SHORT - Double top 15minPotential short on GER40 with a double top on the 15min.
There is negative rsi divergence which is one of the indicators I use to look for double tops.
Still waiting on further confirmation before I take the trade.
Risk/reward = 3.2
Entry price = 23 905
Stop loss price = 23 965
Take profit level 1 (50%) = 23745
Take profit level 2 (50%) = 23684
What do you guys and girls think the GER40 is going to do from here?
Nifty : Bearish EMA Crossover Loading… Watch Out...The 20 EMA is inching dangerously close to crossing below the 50 EMA on the daily chart — a key technical zone that often signals the start of a short-term downtrend.
📉 What this setup could mean:
Momentum is fading, and bulls are losing grip.
A confirmed crossover may invite fresh selling pressure.
Price structure already showing signs of weakness.
🔍 What to watch:
A clear 20 EMA < 50 EMA crossover with a bearish candle close.
Increased volume on red days could validate the move.
Retest of key support zones if crossover plays out.
⚠️ This is a high-probability setup, but not a confirmation yet. Keep alerts set — the next few candles could decide the trend!
📢📢📢
If my perspective changes or if I gather additional fundamental data that influences my views, I will provide updates accordingly.
Thank you for following along with this journey, and I remain committed to sharing insights and updates as my trading strategy evolves. As always, please feel free to reach out with any questions or comments.
Other posts related to this particular position and scrip, if any, will be attached underneath. Do check those out too.
Disclaimer : The analysis shared here is for informational purposes only and should not be considered as financial advice. Trading in all markets carries inherent risks, and past performance is not indicative of future results. It’s essential to conduct your own research and assess your risk tolerance before making any investment decisions. The views expressed in this analysis are solely mine. It’s important to note that I am not a SEBI registered analyst, so the analysis provided does not constitute formal investment advice under SEBI regulations.

Nifty 50 Present ViewsI am trying to publish my opinion about the BMI which is Nifty 50 based on my current understanding and knowledge of markets.
Assumptions are as follows:
Present running QTR is Jul 25 to Sep 25 and year on year comparison of Jul 24 to Sep 24. And the challange was by Apr 25 to Jun 25.
Considering present available data I have tried to highlight best possible scenarios.
Personal Views: Still expecting a consolidaton

How to prepare a session and generate ideas - Todays NY SessionIn this video i demonstrate how i prepare a session with my heat map analysis template, using SB Style signals, MTF approach and market profile. I go through the current price action and setup of DXY, Silver, Gold, WTI, NAS, S&P and DJ30

NASDAQ (CASH100) SHORT - head and shoulders 15minPotential short on nas100 (cash100) with head and shoulders on the 15min.
Still waiting for confirmation on some of my variables before I enter.
Risk/reward = 3.3
Entry price = 23 262
Stop loss price = 23 287.3
Take profit level 1 (50%) = 23 184
Take profit level 2 (50%) = 23 153
What do you guys and girls think the nasdaq is going to do?
JP Morgan warns the S&P is due a retracement!🚨 Alert 🚨
JP Morgan and Deutsche Bank are the latest to warn that the S&P is due for a correction.
I'm short with a small position size, as the price could move higher yet... Judging by experience, it's near impossible to predict tops. It's best to close long positions or enter smaller-sized short positions with large stops.
VANTAGE:SP500 PEPPERSTONE:US500 ICMARKETS:US500 OANDA:SPX500USD

SPX500 Technical Setup – Eyes on 6365 and 6399 TargetsSPX500 – Overview
The price has stabilized above the key pivot level at 6341, maintaining a bullish bias. As long as the price holds above this level, the upward momentum is expected to continue toward 6365 and potentially 6389 or 6399.
However, a 1H close below 6323 would signal a possible trend reversal, opening the door for a deeper correction toward 6283.
🔹 Pivot: 6341
🔹 Resistance: 6365, 6399, 6427
🔹 Support: 6323, 6283

US30 Holding Above Key Pivot – More Upside Ahead?US30 – Overview
The price has stabilized within the bullish zone after holding above the key pivot level at 44170, indicating continued upside momentum. As long as the price remains above this level, we expect a move toward the next resistance at 44360, with potential for an extension toward 44610. A confirmed breakout above 44610 on the 1H timeframe could open the path toward the next resistance at 44730.
However, a 1H close below 44170 may trigger a short-term correction toward 43960.
A break below 43960 would shift the bias to bearish, with further downside likely toward 43785 and potentially 43630.
Resistance: 44360, 44610, 44730
Support: 43960, 43785, 43630

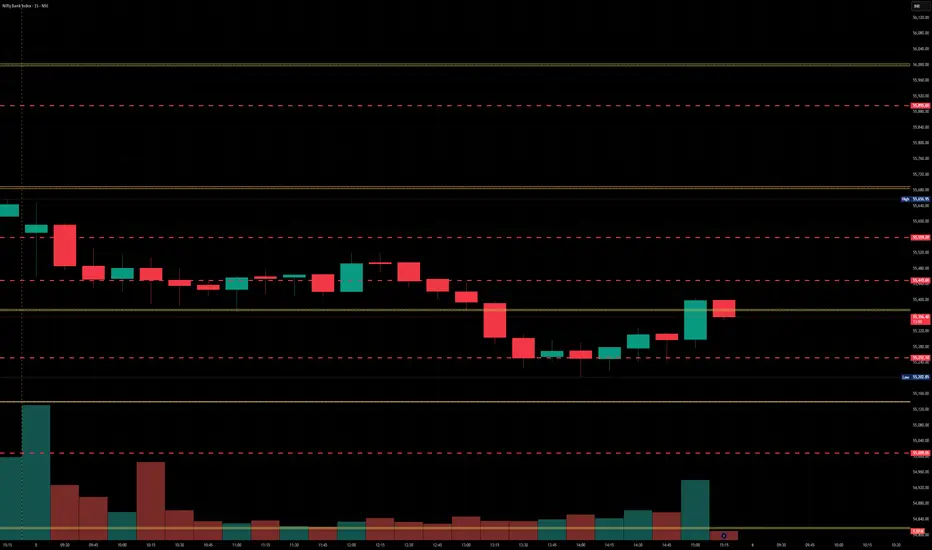
BankNifty levels - Aug 06, 2025Utilizing the support and resistance levels of BankNifty, along with the 5-minute timeframe candlesticks and VWAP, can enhance the precision of trade entries and exits on or near these levels. It is crucial to recognize that these levels are not static, and they undergo alterations as market dynamics evolve.
The dashed lines on the chart indicate the reaction levels, serving as additional points of significance. Furthermore, take note of the response at the levels of the High, Low, and Close values from the day prior.
We trust that this information proves valuable to you.
* If you found the idea appealing, kindly tap the Boost icon located below the chart. We encourage you to share your thoughts and comments regarding it.
Wishing you successful trading endeavors!
Nifty levels - Aug 06, 2025Nifty support and resistance levels are valuable tools for making informed trading decisions, specifically when combined with the analysis of 5-minute timeframe candlesticks and VWAP. By closely monitoring these levels and observing the price movements within this timeframe, traders can enhance the accuracy of their entry and exit points. It is important to bear in mind that support and resistance levels are not fixed, and they can change over time as market conditions evolve.
The dashed lines on the chart indicate the reaction levels, serving as additional points of significance to consider. Furthermore, take note of the response at the levels of the High, Low, and Close values from the day prior.
We hope you find this information beneficial in your trading endeavors.
* If you found the idea appealing, kindly tap the Boost icon located below the chart. We encourage you to share your thoughts and comments regarding it.
Wishing you success in your trading activities!

Nasdaq 100 Analysis: Index Rebounds After Friday’s DeclineNasdaq 100 Analysis: Index Rebounds After Friday’s Decline
The release of disappointing US labour market data on Friday unsettled both stock market participants and the President of the United States:
→ Donald Trump promptly dismissed Erica McEntarfer, Commissioner of the Bureau of Labor Statistics, accusing her of falsifying employment data.
→ Stock indices accelerated their decline, with the Nasdaq 100 Index falling below its 16 June low.
However, US stock indices staged a strong recovery on Monday. According to Reuters, yesterday marked the largest daily percentage gain since 27 May.
Why Did Stock Indices Rise?
Possible reasons include:
→ Buyers were attracted by the falling share prices of companies that, for the most part, had delivered strong quarterly earnings;
→ Market participants are betting on a potential rate cut by the Federal Reserve in September (a move strongly advocated by Trump), which could support both the economy and the stock market.
Technical Analysis of the Nasdaq 100 Chart
In our earlier analysis of the Nasdaq 100 Index, we:
→ Identified a primary ascending channel (marked in blue);
→ Highlighted that the price had risen above the upper boundary of the channel (a sign of excessive optimism);
→ Anticipated a potential correction towards the 23,020 level.
However, the correction turned out to be more substantial than initially expected.
As a result of the price movements on Friday and Monday:
→ The blue channel was widened twofold;
→ The price found support at its new lower boundary and reversed upwards;
→ As of today, the Nasdaq 100 index is trading near the median line.
This can be interpreted as the market aggressively digesting recent corporate earnings reports and the prospects of a rate cut in light of a deteriorating labour market. Demand and supply may reach a new equilibrium, potentially leading to a consolidation phase around the median of the widened channel.
It is also possible that the area marked in orange—where the price previously rallied strongly, indicating a buyer-driven imbalance—may now act as support. Resistance levels might include:
→ Former support at 23,320;
→ 23,440 – the level at which bears broke through the purple channel.
This article represents the opinion of the Companies operating under the FXOpen brand only. It is not to be construed as an offer, solicitation, or recommendation with respect to products and services provided by the Companies operating under the FXOpen brand, nor is it to be considered financial advice.

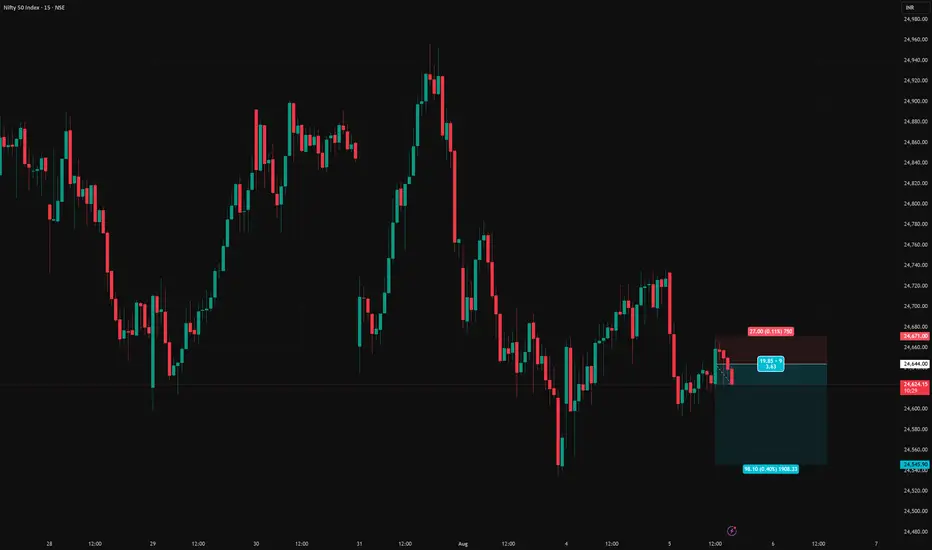
NIFTY short setupNifty short setup
Entry - 24644.00
Stop loss - 24671.00
Target - 24545.90
Risk Reward - 1:3.6
NASDAQNASDAQ is showing strength as price reacts from a key weekly support zone, aligning with the latest COT report indicating increased institutional long positions. This confluence supports a continued bullish outlook.
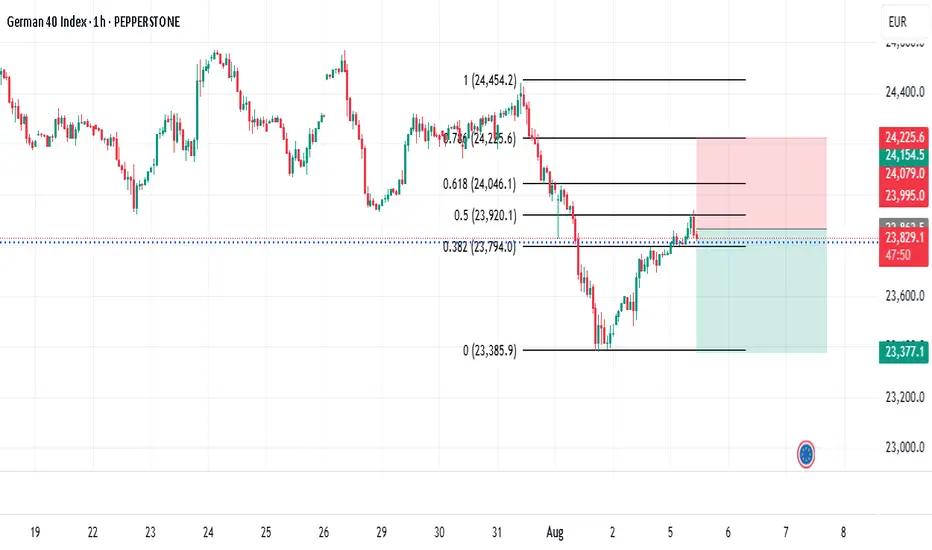
DAX40 Pivotal trading zone at 23900The DAX remains in a neutral trend, with recent price action showing signs of a corrective pullback within the broader uptrend.
Support Zone: 23375 – a key level from previous consolidation. Price is currently testing or approaching this level.
A bullish rebound from 23375 would confirm ongoing upside momentum, with potential targets at:
23900 – initial resistance
24215 – psychological and structural level
24430 and 24620 – extended resistance on the longer-term chart
Bearish Scenario:
A confirmed break and daily close below 23375 would weaken the bullish outlook and suggest deeper downside risk toward:
23195 – minor support
23035 – stronger support and potential demand zone
Outlook:
Neutral bias remains intact while the Dax trades around pivotal 23900 level. A sustained break below or above this level could shift momentum.
This communication is for informational purposes only and should not be viewed as any form of recommendation as to a particular course of action or as investment advice. It is not intended as an offer or solicitation for the purchase or sale of any financial instrument or as an official confirmation of any transaction. Opinions, estimates and assumptions expressed herein are made as of the date of this communication and are subject to change without notice. This communication has been prepared based upon information, including market prices, data and other information, believed to be reliable; however, Trade Nation does not warrant its completeness or accuracy. All market prices and market data contained in or attached to this communication are indicative and subject to change without notice.

S&P500’s Bullish Island Turns Risky: Elliott Wave Says “Top”The S&P500 Index( SP:SPX ) started to rise and even created a new All-Time High(ATH=$6,428) with the help of the Bullish Long Island Pattern , as I published in my previous idea on May 14, 2025 .
The S&P500 Index is currently moving near the Potential Reversal Zone(PRZ) , upper line of the ascending channel , the Important Resistance line , and the Yearly Resistance(1) .
In terms of Elliott Wave theory , the S&P500 Index appears to be completing microwave 5 of microwave 5 of the main wave 5 .
Also, we can see the Regular Divergence(RD-) between Consecutive Peaks .
I expect the S&P500 Index to correct at least -4% and fall to the lower line of the ascending channel .
First Target: $6,233
Second Target: $6,033
Note: Stop Loss(SL) $6,513
Do you think S&P500 Index can create a new ATH above $6,500 !?
Please respect each other's ideas and express them politely if you agree or disagree.
S&P 500 Index Analyze (SPX500USD), Daily time frame.
Be sure to follow the updated ideas.
Do not forget to put a Stop loss for your positions (For every position you want to open).
Please follow your strategy and updates; this is just my Idea, and I will gladly see your ideas in this post.
Please do not forget the ✅' like '✅ button 🙏😊 & Share it with your friends; thanks, and Trade safe.

Nasdaq and S&P500 Short: A multi-factor analysisIn this long video, I go through why I think the equity markets are going to crash in August.
Here are the important points:
1. I talk about the stealth liquidity which is the reverse repo balance being drawn down and almost emptied.
2. The risk-off asset classes rising: Gold, Japanese Yen.
3. The risk-on asset classes falling: Nasdaq, Bitcoin, Ethereum.
Here's my outlook for the markets from now till September FOMC:
1. The equity markets, USDJPY, Bitcoin, and Ethereum will crash.
2. 3-month treasury yield will fall below 4.25% and even below 4%.
3. Fed will cut target rates to be within the 3-month treasury yield.
As usual, good luck in your trading and keep your risks tight!

Sensex long setupSensex long setup
Entry - 80651
Stop loss - 80528.00
Target - 81093
Risk Reward - 1:3.6

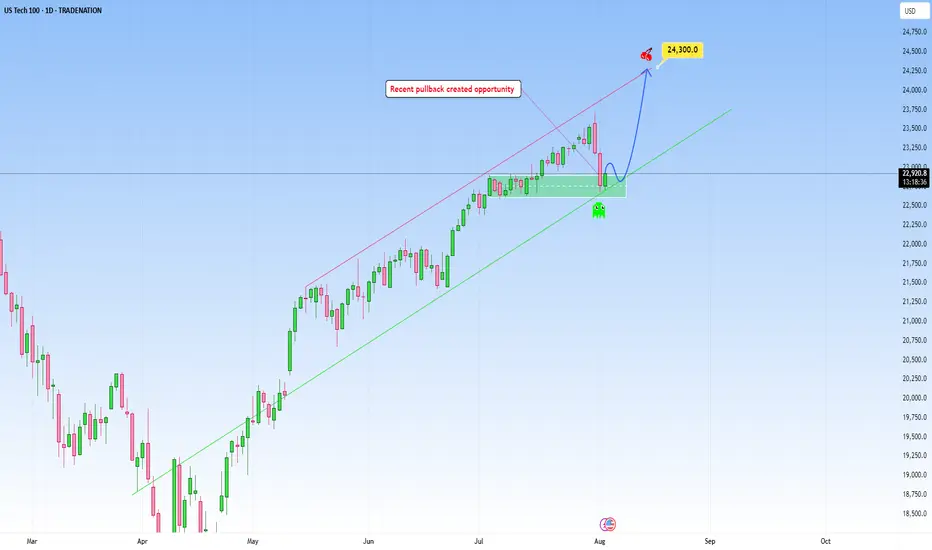
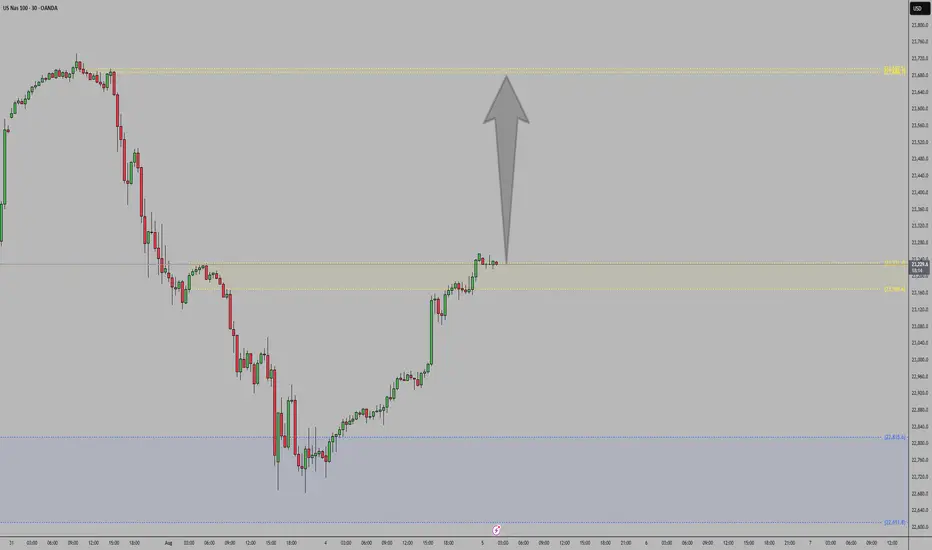
USTEC: Likely continuation following pullbackNAS100 climbed a steep uptrend and my expectation is for a continuation as marked on my chart, with an upside target at around 24,300.
This area here is where it can become a decision point, either price finds support and bounces, or it breaks below, and that’s when we might see the move start to extend lower.
If I were to take a side here, I would definitely choose more upside, but again only price action should determine next move.
But if price breaks below the trendline with conviction, it would invalidate the bullish scenario, suggesting that the uptrend may pause or could even reverse short-term.
Just sharing my thoughts for the charts, this isn’t financial advice. Always confirm your setups and manage your risk properly.
Disclosure: I am part of Trade Nation's Influencer program and receive a monthly fee for using their TradingView charts in my analysis.