DXY: Weekly OutlookWeekly DXY Outlook
On the weekly chart, the US Dollar Index (DXY) has reached a critical zone that was last tested in February 2022.
While a rebound is not guaranteed, the fact that the DXY has declined nearly 12% over just six months—despite a resilient U.S. economy—suggests the potential for renewed strength in the dollar.
I think the index could begin a recovery toward key levels at 100.00, 101.97, and possibly 106.00/
It’s worth noting that the broader bearish trend began with the trade tensions initiated during the Trump administration, which strained relations with several major trading partners.
Given that this is a weekly chart, it should be used more as a reference point rather than a trading signal.
You may find more details in the chart!
Thank you and Good Luck!
Market indices

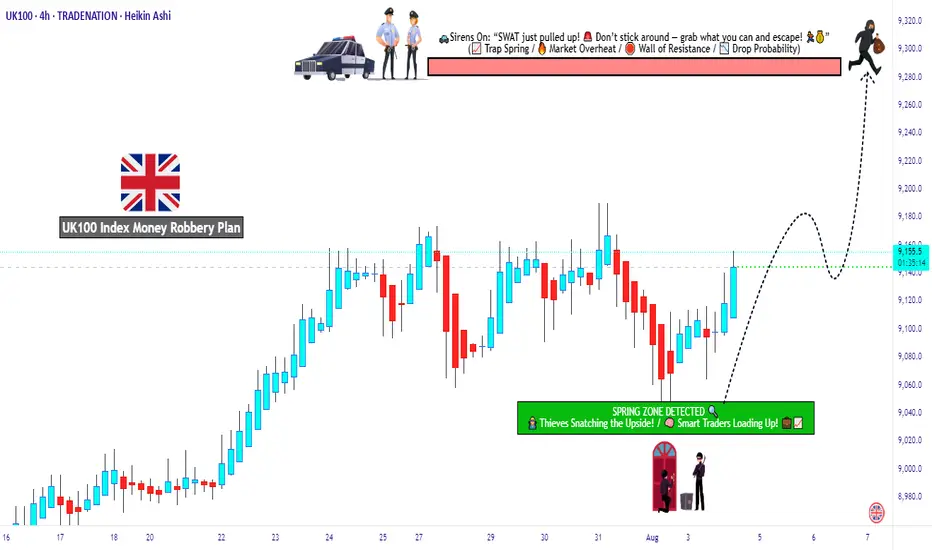
Is UK100 Setting Up the Cleanest Bull Robbery This Week?🏴☠️💹“UK100 Bullish Bank Job Heist 🧠💰” – Thief Trader Limit Order Operation 🚨📊
📢 Calling all stealthy traders, market pirates, and strategic looters! The vault is open, and the FTSE100 (UK100) index is now under our radar for a planned bullish extraction. This ain’t no regular trade — this is a Thief-Style Layered Entry Operation™.
🎯 Plan of Attack:
Asset: UK100 / FTSE100
Bias: Bullish
Entry: Any price level — we layer like legends (multiple limit orders across price zones)
Stop Loss: 9040.0 (vault protection level 🔐)
Target: 9280.0 (loot zone confirmed 🎯)
🧠 Thief Strategy Breakdown:
🔎 Why Bullish?
The setup is showing signs of accumulation + macro support, with strong risk-to-reward potential. Market exhaustion and liquidity traps are visible — it’s time to slip in quietly and stack long orders like a silent thief in the night.
📈 Execution Plan:
🔹 Use limit orders below current price (layer across price pockets)
🔹 DCA-style entries for better average and flexibility
🔹 Risk small, aim large
🔹 Always watch for market traps or surprise bear moves
🛡️ Stop-Loss Logic:
Below structure zones or 4H support – ~9040.0
Don't get greedy — protect the bag at all times.
🚪 Target the Escape:
Primary TP set at 9280.0
Optional: secure partials earlier using trailing SL once price breaks above 9200 zone.
📊 Trader Alerts:
⚠️ Avoid new positions during high-impact UK news
📅 Check for BOE surprises or global market shocks
🔁 Trail stops — don’t let profits vanish like a clumsy thief
📌 Notes from the Underground Vault:
🔐 This trade idea is based on market structure + liquidity flow
📌 Not financial advice — always rob with your own blueprint
💼 Trade light. Think sharp. Escape clean.
🔥 Join the Robbery Squad
Smash the idea boost 💥 if you're running this setup too.
💬 Drop a “HEIST LOADED” in the comments if you're in. Let’s loot this market the smart way — layered, patient, and untraceable. 🏴☠️💸
Precision Instruments - Quote | Chart & Forecast SummaryKey Indicators On Trade Set Up In General
1. Push Set Up
2. Range Set Up
3. Break & Retest Set Up
Notes On Session
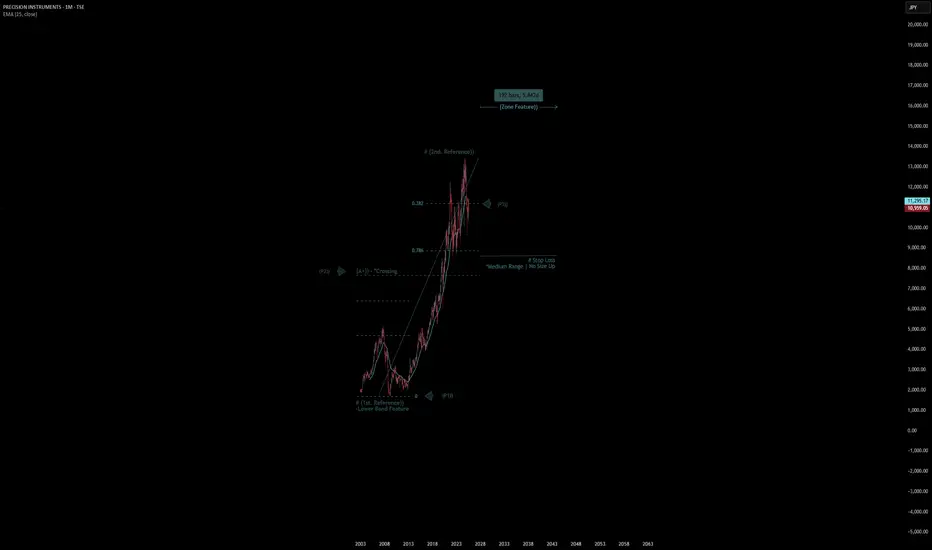
# Precision Instruments - Quote
- Double Formation
* # (1st. Reference)) - *Lower Band Feature | Subdivision 1
* (A+)) - *Crossing | Completed Survey
* 192 bars, 5.842d | Date Range Method - *(Uptrend Argument))
- Triple Formation
* (P1)) / (P2)) & (P3)) | Subdivision 2
* Weekly Time Frame | Trend Settings Condition | Subdivision 3
- (Hypothesis On Entry Bias)) | Indexed To 100
* Stop Loss Feature Varies Regarding To Main Entry And Can Occur Unevenly
- Position On A 1.5RR
* Stop Loss At 425.00 JPY
* Entry At 540.00 JPY
* Take Profit At 700.00 JPY
* (Uptrend Argument)) & No Pattern Confirmation
- Continuation Pattern | Not Valid
- Reversal Pattern | Not Valid
* Ongoing Entry & (Neutral Area))
Active Sessions On Relevant Range & Elemented Probabilities;
European-Session(Upwards) - East Coast-Session(Downwards) - Asian-Session(Ranging)
Conclusion | Trade Plan Execution & Risk Management On Demand;
Overall Consensus | Buy
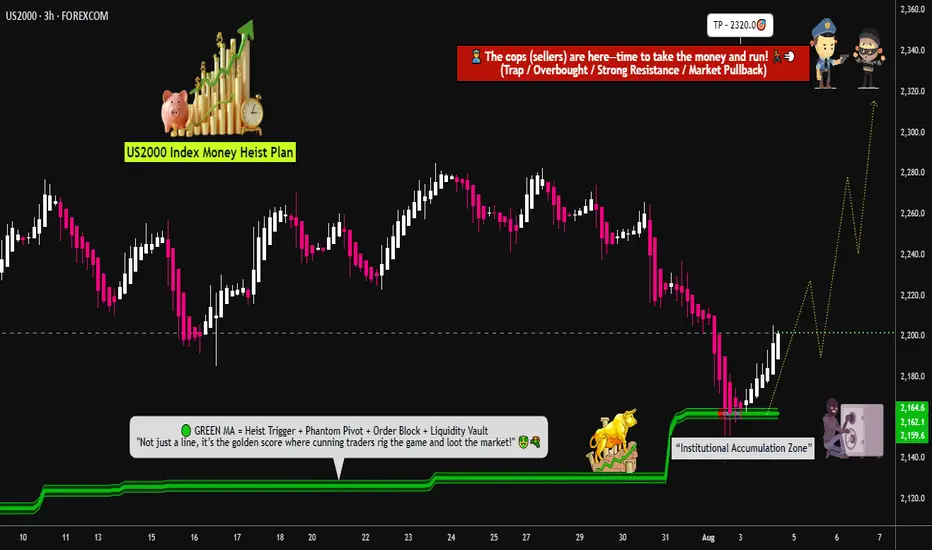
Russell 2000 Bullish Attack – Vault Break-In Loading🚨US2000 / Russell 2000 Heist Plan – Bullish Loot Incoming!🚨
🤑 Dear Robbers of the Market Vault,
The Russell 2000 is showing cracks in the bear walls—time for a bold bullish break-in! 🔓📈
The Thief has eyes everywhere, and right now, the loot sits between 2140.0 & 2320.0. Let's steal it!
📌 Asset: US2000 / Russell 2000
📍 Plan: Bullish (Heist Mode: ON)
🧲 Method: Layering entries like a smooth criminal 🎯💣
💵 Entry: Any price – the vault door’s open, rob at your timing!
🛡️ Stop Loss: 2140.0 (Guarded exit in case the heat gets too strong)
🎯 Target: 2320.0 (The gold bars are stacked here)
🧠 Robbery Blueprint (Strategy Notes):
Use multiple buy limit orders 🔄
Structure entries near swing lows in 15m/30m charts
Wait for dips, snatch the momentum—we rob during weakness!
Always place alerts to spot intraday cracks in the defense lines 📳📊
Don’t chase; we trap the trap!
💥Risk Alert & Protection Plan:
News events = 🔥 volatility bombs.
❌ No fresh trades during high-impact news
✅ Use trailing SL to lock in the loot
🔐 Protect your gains like the vault guards protect gold!
⚔️ Scalpers & Swing Thieves Note:
Scalp only on the long side
💸 Small capital = DCA entry + trail
💰 Big pockets = Straight breakout sniper shot
Stay light, stay fast, stay rich!
📢 Final Words from the Mastermind:
Boost this heist if you love the thrill of the steal 💥
Trade with precision, exit with profits, and never let the market catch you!
The next robbery plan drops soon... be ready, robbers 🐱👤🚨📈
It is LET'S GO ALL IN time! 100 WEMA on midcap 100Deep red portfolios, bearish sentiments, uncertainity in geopolitics: Something similar to what happened in previous corrections (2022).
One can bet on smallcap, midcap companies near 100 WEMA - High Risk-Reward Trade

USD, DXY rejected at 100 but can bulls hold a higher-low?You find out the true test of a trend during the counter-trend episodes. Do buyers show up to hold higher-lows? Or does fear and skepticism cause them to take a back seat as sellers continue to dominate. If that's the case, then supports are vulnerable and there could be motive for continued selling. But, if bulls do stand up and hold a higher-low, that can be a sign that the market is still harboring longer-term oversold dynamics after a heavy one-sided move drove for so long.
That's where we're at with the US Dollar.
The USD finished July as its strongest month in more than three years. And it followed that up with its largest sell-off in three months as multiple factors hit the greenback on Friday. There was the NFP report, with massive revision to the headline number for the prior two months. And then Trump fired the head of the BLS and then towards the end of the session, the resignation of a Fed governor which will allow Trump to appoint a more-dovish FOMC member about six months earlier than expected.
Collectively this served to push up rate cut expectations in September and that's what hit the USD so hard. And at this point markets are widely-expecting that next cut in September to a current 87.8% probability as of right now per CME Fedwatch.
But will these dynamics lead to a more dovish Fed? Powell didn't sound as though he was ready to cut rates on Wednesday and he said it was the unemployment rate that the Fed will be watching - and that came in right at the expected 4.2%, which is very close to the 'full employment' level. There's also the Core PCE report from Thursday, which showed inflation is still moving higher - even without a Fed rate cut, and that follows a similar reading of CPI from earlier in the month.
The big question here is whether that can all allow for the USD to sink down to fresh lows and from the daily chart, there's a big spot of support potential around the April and early-June swing lows, spanning from 97.60-97.92. - js

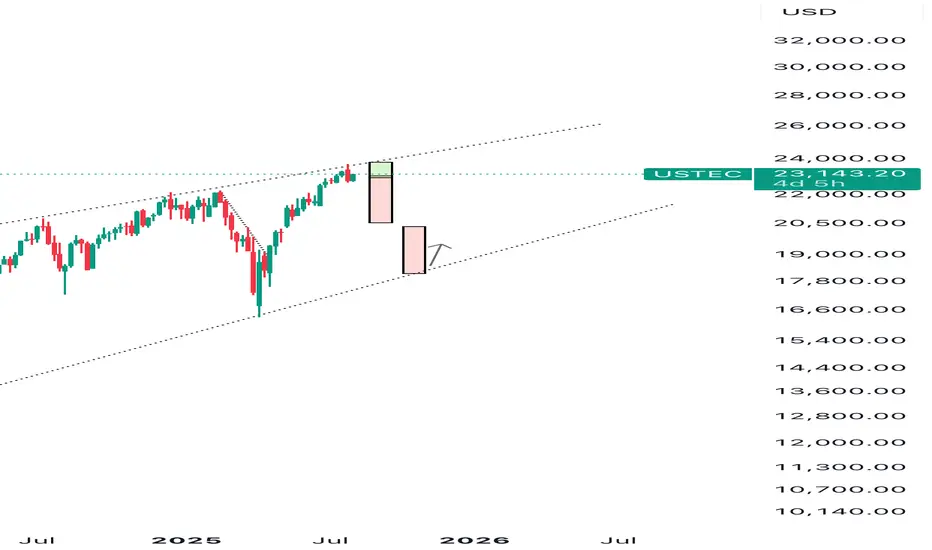
Is the NASDAQ Vault Open for a Full Bullish Heist?🧠 NASDAQ Heist Masterplan: Thieves Eye on 24,500 🎯💰
🚨 Asset: NASDAQ100 / US100 / NDX
📊 Plan: Bullish | 🔁 Layering Strategy
🎯 Target: 24,500
🛑 Stop Loss: 22,600
📍 Entry: Any level – the vault’s wide open!
💼 Thief Trader's NASDAQ High-Stakes Robbery Is LIVE! 🤑📈
Welcome, money bandits & market looters! 💼💰
The time has come to launch a full-scale bullish raid on the NASDAQ fortress. We’re not just taking entries — we’re stacking them like a pro with our layered limit order strategy across swing zones. 🔫📉➡️📈
🔓 Entry:
Pick any price! We break in anytime, anywhere.
🔁 Stack your buy limits on 15m–30m swing lows.
🔔 Set your alerts – don’t let the opportunity slip.
🛑 Stop Loss:
Guard your loot at 22,600.
Risk management is the bulletproof vest in this raid. 🎯
Adjust your SL based on lot size and order volume. 📏🔐
🎯 Profit Target:
Thieves retreat at 24,500.
But hey – smart robbers use trailing SL to squeeze every last drop of gold! 🏆💸
💡 Scalpers & Swingers:
Stick to the long side only.
If your pockets are deep – full-send mode ON.
If not, tag along with swing entries. Patience pays big! 💎⏳
📢 Heads Up, Heist Crew:
News drops = landmines. Step carefully.
🚷 No new entries during major announcements.
🛡️ Use trailing SL to defend your profit bags.
🚨 Daily Reminder:
This market isn’t a playground. It’s a battlefield.
Use COT data, macro reports, sentiment scans, and index-specific triggers to fortify your robbery blueprint. Stay smart, stay updated! 📊🧠
💥 Boost Our Loot Crew 💥
Hit that LIKE ❤️ to support the Thief Army!
Stronger visibility = Bigger Loots = More Victory Runs.
See you at the next robbery – we move in silence, but the market hears us loud! 🐱👤💸🔥🚀

SP500 reinforcing a bearish short-term trendThe S&P 500 retreated in the final session of July, weighed down by renewed tariff concerns and ongoing uncertainty surrounding the Fed’s next policy move. Despite the late pullback, the index remains positive for the month overall.
From a technical perspective, the index has declined approximately 2.5% since yesterday, reinforcing a bearish short-term trend. The bearish outlook remains valid as long as the price stays below 6220.
Immediate Support: 6220 – A break below this level could lead to further downside. Next Downside Target: 6150 – If the bearish momentum continues past 6220. if price closes above this, 6250 short-term bullish momentum may build. 6300 – A major resistance; a close above this would invalidate the current bearish outlook.
we have Some Tips about SO500 But Trading range is small Traders.
Ps; Support with like and comments for more analysis.

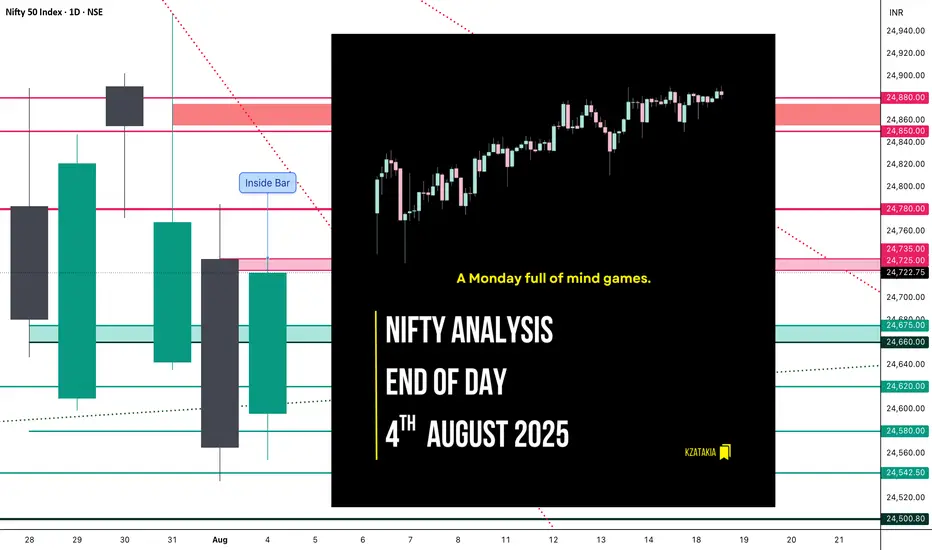
Nifty Analysis EOD – August 4, 2025 – Monday🟢 Nifty Analysis EOD – August 4, 2025 – Monday 🔴
A Monday full of mind games.
Nifty opened with a slight positive gap and immediately tested the TC of CPR, but that optimism didn’t last long — sharp rejection took it to day’s low (24,554). What followed was a rollercoaster: a 100-point recovery, a 50-point pullback — all within 10 minutes. This wild price action defined the rest of the day.
Throughout the session, Nifty remained trapped within the CPR zone. Both sides experienced multiple fakeouts, especially around initial balance (IB) zones. Even when prices nudged toward R1, repeated failed attempts to break above reflected the market’s indecisiveness. The day finally closed near the high, but conviction was still lacking.
Many option buyers likely struggled due to deceptive shadows and unexpected fractal breakouts. The entire price action stayed within Friday’s range — forming an Inside Bar structure on the daily chart. This suggests a potential range breakout trade tomorrow.
The market faced resistance near the Fibonacci 0.618–0.786 retracement of the prior fall — aligning with 24,740–24,780 zones. A close above 24,780 tomorrow could shift momentum back in the bulls’ favour. If not, bears still hold the upper ground.
📈 5 Min Time Frame Chart with Intraday Levels
📉 Daily Time Frame Chart with Intraday Levels
📊 Daily Candle Breakdown
Open: 24,596.05
High: 24,736.25
Low: 24,554.00
Close: 24,722.75
Change: +157.40 (+0.64%)
Candle Type:
🟢 Bullish Marubozu-like — reflects a strong control by buyers after early weakness.
Structure Breakdown:
Real Body: 126.70 pts (Bullish)
Upper Wick: 13.50 pts (Minor resistance near close)
Lower Wick: 42.05 pts (Early dip got bought aggressively)
Key Insight:
Closed near the high of the day — positive bias for tomorrow
Inside Bar formed – Expect a breakout trade
24,780+ closing will turn sentiment bullish
🛡 5 Min Intraday Chart
⚔️ Gladiator Strategy Update
ATR: 209.36
IB Range: 115.95 → Medium
Market Structure: Balanced
Trade Summary:
🕚 11:30 AM – Long Entry → SL Hit
🕛 12:30 PM – Long Entry → SL Hit
🕐 13:10 PM – Short Entry → SL Hit
Tough day — strategy got chopped in noise-heavy moves.
🔍 Support & Resistance Levels
Resistance Zones:
24,725 ~ 24,735
24,780 ~ 24,795
24,860 ~ 24,880
Support Zones:
24,675 ~ 24,660
24,620
24,542 ~ 24,535
24,500
24,470 ~ 24,460
💭 Final Thoughts
"Markets love to test your patience before they reward your conviction."
Today was a lesson in restraint — avoid overtrading when structure lacks clarity. Inside bar gives us a clean slate for tomorrow. Let price lead.
✏️ Disclaimer
This is just my personal viewpoint. Always consult your financial advisor before taking any action.
S&P 500 ETF & Index– Technicals Hint at a Possible Correction📉📊 S&P 500 ETF & Index at Resistance – Technicals Hint at a Possible Correction 🔍⚠️
Everything here is pure technicals— but sometimes, the market whispers loud and clear if you know how to listen. 🧠📐
The VOO ETF, which tracks the S&P 500 , has now reached the upper boundary of a long-term ascending channel, once again brushing against resistance near 590.85. This zone has consistently led to major pullbacks in the past.
On the right panel, the US500 Index mirrors this move—pushing toward all-time highs, right as broader sentiment turns euphoric. Technically, both charts are overextended and pressing into key zones.
👀 Potential Path:
🔻 Rejection from current zone ➝ Down toward 526.17, then 465.72 (green support channel)
🔁 Possible bounce after correction — trend still intact long term
And while we’re keeping it technical, it’s worth noting that the Buffett Indicator (Stocks-to-GDP) i s currently screaming “overvaluation.” This doesn't predict timing—but it adds macro context to an already overheated chart setup.
The lesson? Price respects structure. Whether or not the fundamentals are in agreement, the charts are warning that now may not be the time to chase.
History doesn’t repeat, but it often rhymes. Stay sharp, stay technical. 🎯
One Love,
The FX PROFESSOR 💙
ps. the beauty of these levels? Tight Stop loss- excellent R/R
Disclosure: I am happy to be part of the Trade Nation's Influencer program and receive a monthly fee for using their TradingView charts in my analysis. Awesome broker, where the trader really comes first! 🌟🤝📈

DAX: Bulls Are Winning! Long!
My dear friends,
Today we will analyse DAX together☺️
The market is at an inflection zone and price has now reached an area around 23,755.89 where previous reversals or breakouts have occurred.And a price reaction that we are seeing on multiple timeframes here could signal the next move up so we can enter on confirmation, and target the next key level of 23,976.72.Stop-loss is recommended beyond the inflection zone.
❤️Sending you lots of Love and Hugs❤️
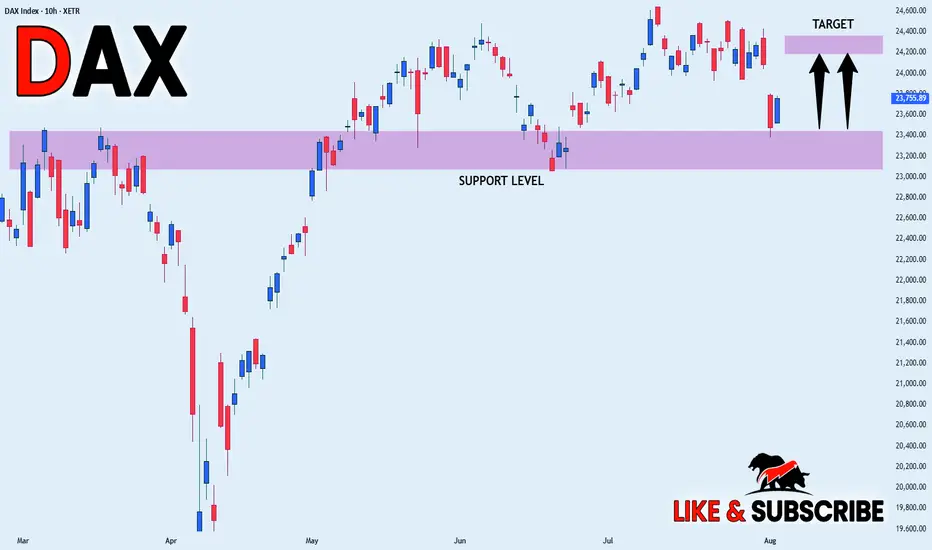
DAX WILL GROW|LONG|
✅DAX is trading in an
Uptrend and the index made
A bullish rebound from the
Horizontal support of 23,400
Which reinforces our bullish
Bias and we will be expecting
A further bullish move up
LONG🚀
✅Like and subscribe to never miss a new idea!✅
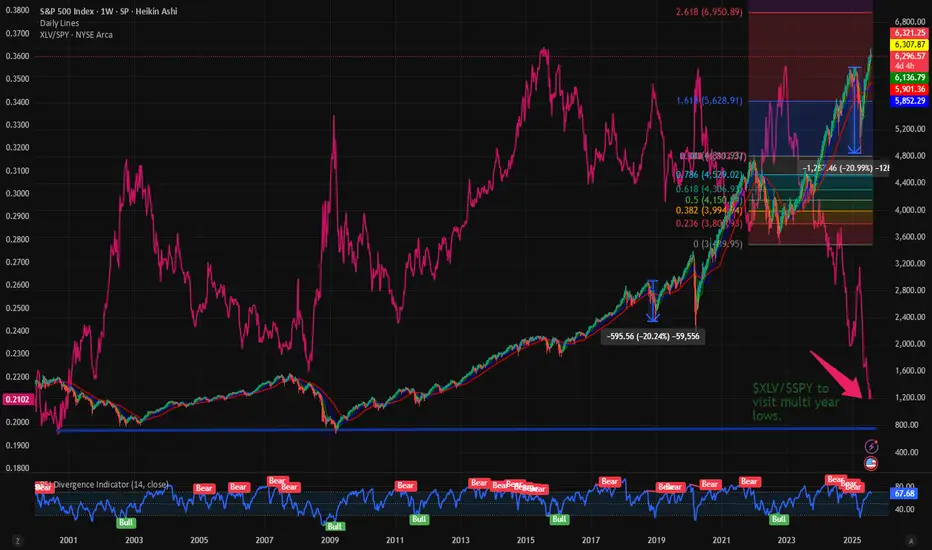
$XLV vs $SPY at multi year low. Is more downside expected? In this space we talk a lot about the market outperformance and how this has resulted in indexes at ATH. The SP:SPX and NASDAQ:NDX and their corresponding ETFs: NASDAQ:QQQ and AMEX:SPY have also made ATHs. But if peel under the surface we can observe that very few sectors have consistently outperformed the S&P 500. The Technology sector represented by AMEX:XLK has consistently outperformed the $SPY. The $XLK/ AMEX:SPY is in a upward channel depicted by the purple line. The SPDR select sector Technology sector has consistently increased its weightage on AMEX:SPY and the ratio $XLK/ AMEX:SPY is currently at 0.41 which is an ATH.
But the same cannot be told about the SPDR Healthcare Sector. The ratio between $XLV/ AMEX:SPY is making multi year low. With the ratio currently at 0.21 it is approaching its multi-year lows of 0.1975. The ratio was so low last in Sept 2000. Hence the question comes what should we expect the AMEX:XLV which is making new lows against the AMEX:SPY ? Will we visit the lows of 0.1975? If it happens then can we expect a upward momentum from his double bottom situation?
In my estimate in this bull market and Tech sector outperforming the AMEX:XLV will make new lows vs AMEX:SPY and the ratio will revisit the 2000 lows. But if on the macro front we have weak jobs numbers and recession risk rising then the AMEX:XLV can in fact draw inflows and outperform the index. Hence my estimate $XLV/ AMEX:SPY will sweep the multi-year low and then bounce back into 2026.
Verdict: Still more downside possible in $XLK/$SPY. Go long AMEX:XLV when the ratio is @ 0.1975 and into 2026.
Nasdaq faces a possible down 5-10/20% downturn.Overconfidence will foreshadow a correction. Risk posed by slowing growth in jobs, trade disputes and high valuations in growth focused companies in the index.
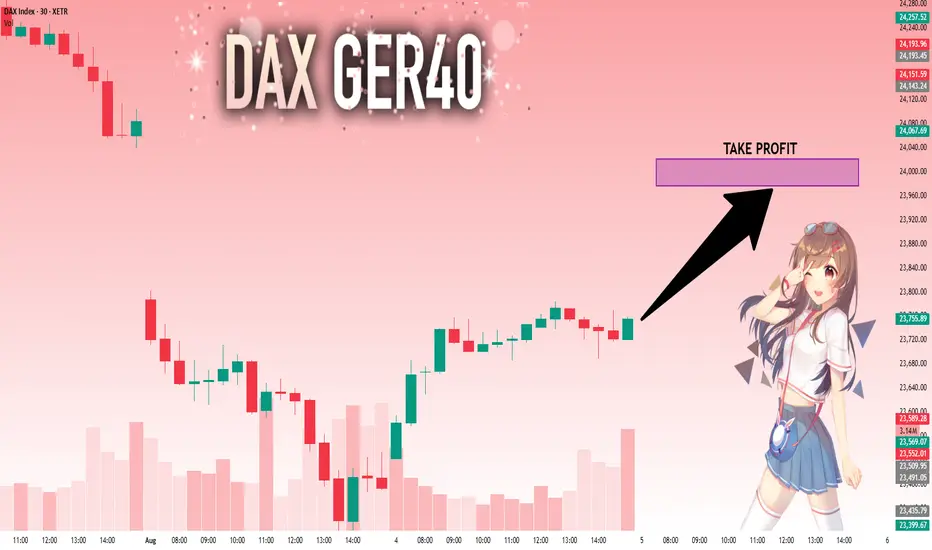
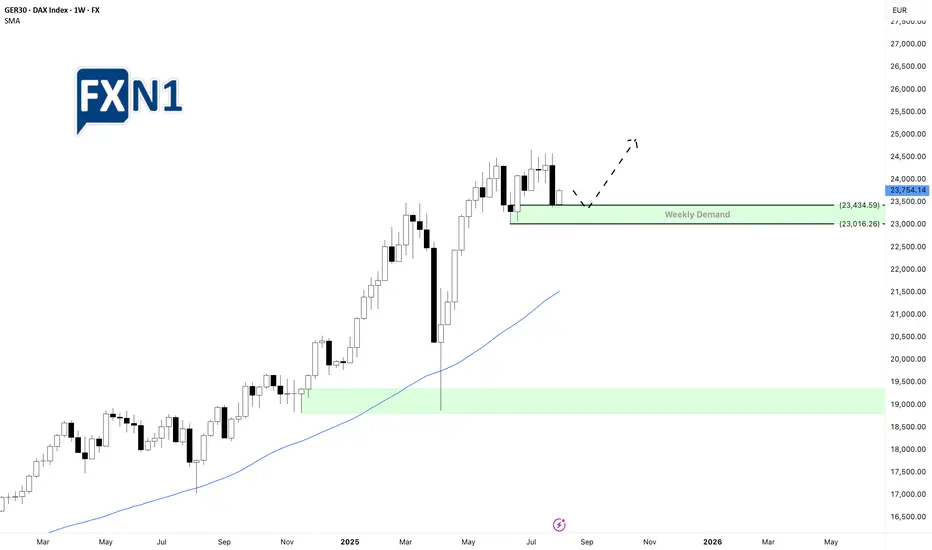
DAX Futures Rebound Amid Shifting US Economic SentimentThe DAX futures are showing a more optimistic tone today, shifting from concerns over weak US labor market data—which initially signaled economic trouble—to a more hopeful outlook that this might prompt the Federal Reserve to consider cutting interest rates, a move that investors see as positive. This shift in sentiment has provided some reassurance as the new week begins.
Following a brief decline on Friday, the market experienced a rebound today, supported by a weekly demand zone. We’re now watching for a retest of key levels within this zone, which could serve as a potential entry point for long positions, aiming for a continuation of the upward momentum driven by the weekly support area.
✅ Please share your thoughts about GER30 in the comments section below and HIT LIKE if you appreciate my analysis. Don't forget to FOLLOW ME; you will help us a lot with this small contribution.
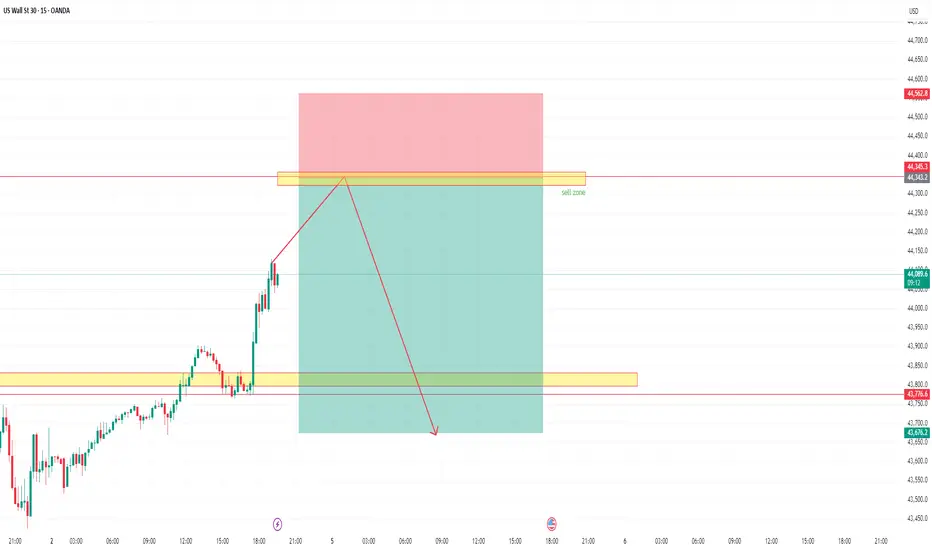
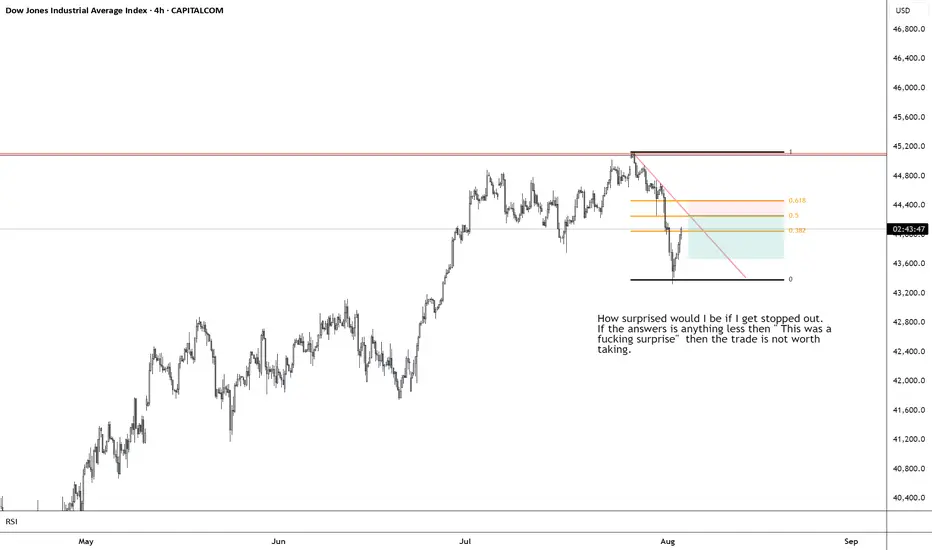
US30 TRADE IDEA 4 AUGUST 2025The US30 (Dow Jones Industrial Average) is showing signs of a near-term bearish bias after breaking down from its rising daily channel and rejecting at the 44,700–45,100 supply zone, which coincides with a key former support level now acting as resistance. From a Smart Money Concepts perspective, this zone represents a recent order block where institutional selling pressure originated, making it a high-probability area to look for short entries if price retests with bearish confirmation, such as a daily bearish engulfing candle, a long rejection wick, or a clear lower-high formation. The first major downside target lies around 43,062, aligning with an intermediate demand zone, with an extended target toward 42,500, where deeper demand and prior consolidation converge. Stops should be placed above 45,150 to invalidate the bearish setup. Conversely, if price drops into the 42,800–43,000 demand zone and shows strong bullish reversal patterns, there is scope for a tactical countertrend long back toward 44,700–45,100, provided that geopolitical and macro conditions turn supportive. Fundamentally, the market remains caught between optimism over potential Federal Reserve rate cuts later this year and uncertainty stemming from the Fed’s cautious, data-dependent stance. Geopolitical risks—particularly heightened tensions in the Middle East and ongoing U.S.–China trade friction—are adding to volatility and could weigh on global risk sentiment, especially if oil prices spike and inflation concerns reemerge. These risks, combined with political uncertainty in the U.S., favor selling into rallies until there is a clear shift in macro direction. Key events to monitor include upcoming Fed communications, developments in Middle East conflicts, and any major U.S.–China trade headlines, all of which could either reinforce the short bias or trigger a sentiment-driven reversal. For now, the preferred approach is to sell into strength near the supply zone with defined risk, manage positions closely around the 43,000 demand area, and remain flexible to flip bias if price action and fundamentals align for a reversal.

US 30 -Short -TGT 43682US30 to fall to the levels of 43682. The Index expected to hit the levels of 44343 before the fall.
Technical Analysis WeeklyGermany 40 is now in a range-bound environment, currently trading at 23,630, below its VWAP of 24,150 and close to StdDev #2 Lower. RSI at 43 reflects weakening momentum. Support lies at 23,630 and resistance is seen at 24,740
UK 100 continues its bullish trend, undergoing a small pullback. Price is at 9,102, just above its VWAP at 9059. RSI at 61 indicates steady bullish interest. Support is at 8,906 and resistance is at 9,212
Wall Street remains bullish but is now in a corrective phase. Price has dropped to 43,786, below its VWAP of 44,407. The RSI of 43 highlights growing downside pressure. Support is at 43,580, and resistance is at 45,253.
Brent Crude continues in a choppy range, albeit with lower volatility, trading at 6,932, right at its VWAP. The RSI at 50 confirms the lack of directional bias. Support sits at 6,631 and resistance at 7,198.
Gold continues to consolidate in a broad triangle pattern - keeping it in a neutral range, with price at 3,357, nearly equal to its VWAP. The RSI at 53 shows a balanced outlook. Support is at 3,280 and resistance at 3,416.
EUR/USD holds a bullish trend but is correcting. The pair trades at 1.1565, slightly below the VWAP of 1.1635. RSI at 45 reflects subdued buying pressure. Support is at 1.1435 and resistance at 1.1834.
GBP/USD has potentially entered a new bearish trend in a quick reversal from the prior uptrend. It trades at 1.3275, below the VWAP of 1.3404. The RSI of 36 signals fresh bearish momentum. Support is at 1.3204 and resistance at 1.3604.
USD/JPY remains neutral and in a range phase but is possibly building a new uptrend with its recent drop back from range resistance. Price is 147.95, aligned with the VWAP. RSI at 53 suggests a balanced tone. Support is near 145.95 and resistance stands at 149.88.
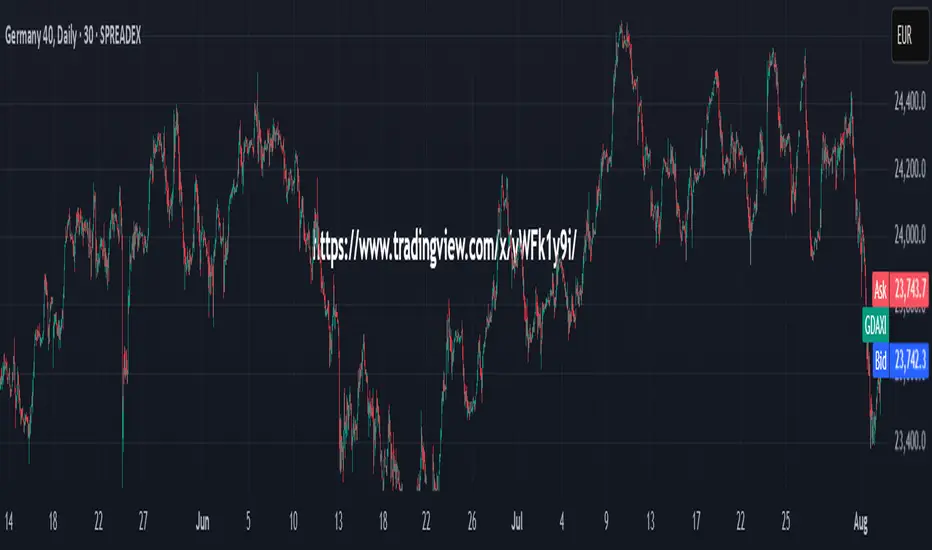
Dax short medium termBearish till 21.800 which is an important retest. SL on a daily close above 24.000

Netherlands Indice NL25 will hit 900.000 this weekOANDA:NL25EUR Long trade, with my back testing of this strategy, NL25EUR need to touch 9000.00
This is good trade, don't overload your risk like Greedy, be disciplined trader.
Use proper risk management
Looks like good trade.
Lets monitor.
Use proper risk management.
Disclaimer: only idea, not advice

US Stocks on Watch as Momentum ShiftsAfter a resilient summer run, US equities are now facing a new wave of pressure. Friday’s slide was more than just a reaction to headlines, it may be the first sign of a deeper shift in sentiment.
Jobs Data Disappoints as Tariff Tensions Rise
Friday’s US jobs report was a jolt. Just 73,000 nonfarm payrolls were added in July, well short of the 110,000 expected. But the real gut punch came from the revisions. June’s figure was slashed from 147,000 to just 14,000 and May’s total was lowered by another 125,000. Taken together, that is over a quarter of a million fewer jobs than previously reported. The softening labour market has now pushed the probability of a September rate cut to 66%, as traders start to price in a more cautious Fed response.
If that was not enough, President Trump added fresh fuel to the fire by announcing a new round of tariff hikes. Imports from Canada will now face a 35% levy, up from 25%, while goods routed through third countries to avoid duties will be hit with a 40% charge. These measures come at a time when the global economy is already under strain, and investors wasted no time in pulling back. Tech and financials bore the brunt, with Amazon and JPMorgan among the hardest hit.
Short Term Momentum Breaks Down
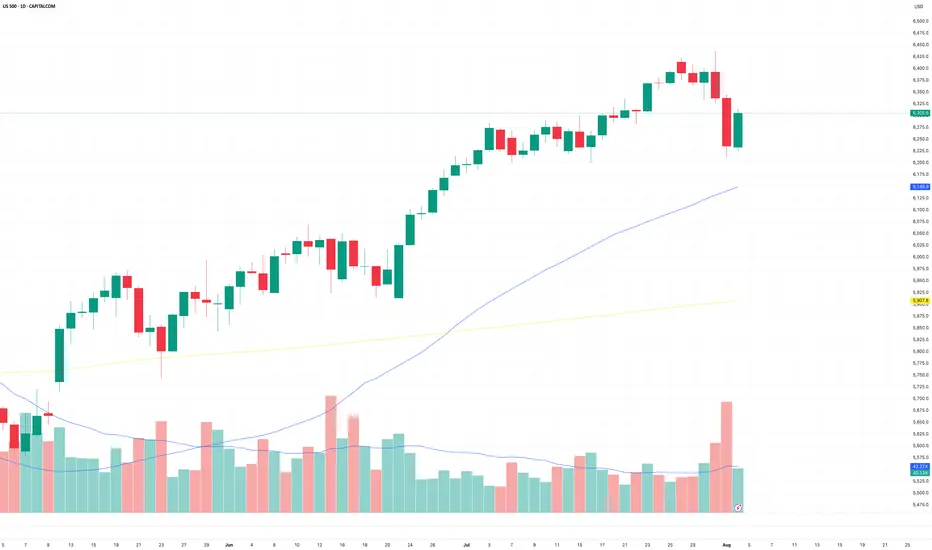
Last week’s price action marked a clear change in tone. The S&P 500 attempted to break to fresh highs on Thursday but was met with a wave of selling on increased volume, forming a bearish engulfing candle. That move was followed by a sharp decline on Friday after the jobs data landed. This two-day drop, coming on elevated volume, stands out as a clean reversal in short term momentum and is most visible on the hourly chart.
That kind of shift raises an important question about timeframes. If you're a short-term trader focused on hourly candles and below, you will likely be watching for bearish continuation patterns. That could mean looking for brief pauses in the selling, flags or consolidations, before another leg lower.
Longer term traders will be reading the chart differently. While short term momentum has clearly turned, the longer-term structure is still intact. The market is now pulling back into a key zone of former resistance from earlier in the year. This cluster of highs, once broken, now acts as support, and just so happens to line up with the 50-day moving average. For those taking a wider lens, this is the kind of area where trend followers could look to reload.
US500 Daily Candle Chart
Past performance is not a reliable indicator of future results
US500 Hourly Candle Chart
Past performance is not a reliable indicator of future results
Disclaimer: This is for information and learning purposes only. The information provided does not constitute investment advice nor take into account the individual financial circumstances or objectives of any investor. Any information that may be provided relating to past performance is not a reliable indicator of future results or performance. Social media channels are not relevant for UK residents.
Spread bets and CFDs are complex instruments and come with a high risk of losing money rapidly due to leverage. 85.24% of retail investor accounts lose money when trading spread bets and CFDs with this provider. You should consider whether you understand how spread bets and CFDs work and whether you can afford to take the high risk of losing your money.
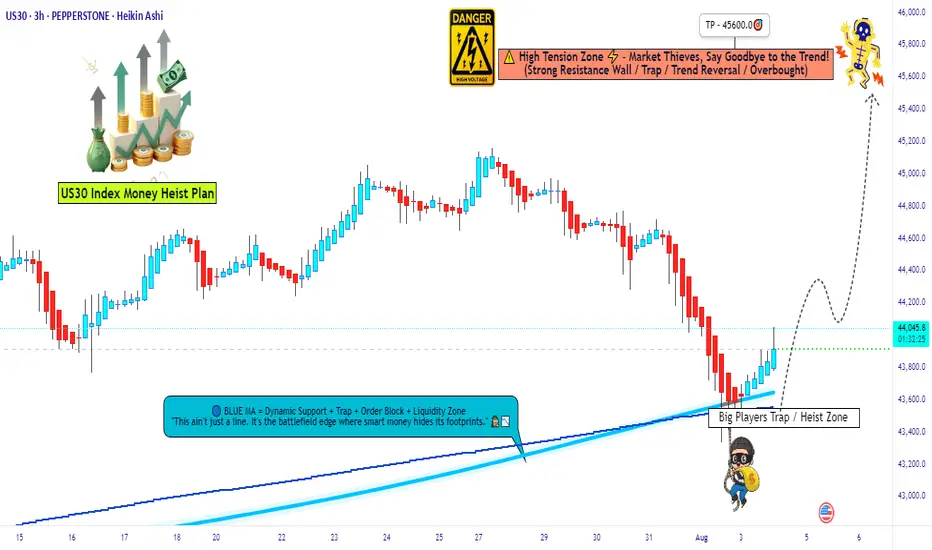
Heist Alert: Dow 30 Bullish Surge Incoming – Lock In Targets🦹♂️💎 “US30 Gold Vault Heist” – Thief’s Bullish Break-In Plan! 🚨📈
(Brought to you by Thief Trader – Layered Entry. Zero Mercy. Big Bags.)
🌍 Welcome to the Heist Floor, Global Market Bandits!
🎯 US30 is the next vault on the hitlist – and we’re going in loud but calculated.
💣 The Setup: Bullish Raid in Progress!
The Thief has eyes on Wall Street's armored vault — US30 Index — gearing up for a multi-layered bullish assault.
💼 Using limit orders like C4 on the door hinges, we’re stacking precise entries for maximum loot extraction. This isn’t gambling — this is organized market crime.
🔓 Entry Protocol – Any Price Level Is Breachable
🪜 Layered Limit Orders: Entry at any market level, multiple orders spread like a thief’s toolkit.
No sniper candle required — we work the shadows and stack with precision.
(Use the 15m-1H TF to tighten your strike zone.)
🛑 Stop Loss – The Getaway Hatch
📍 SL parked at 43300.0 – if the mission fails, we vanish clean.
No chasing losses — the next heist awaits.
📈 Take Profit – The Loot Vault
🎯 Target: 45600
That’s the gold room, the top floor, the getaway car location.
Use trailing SLs to secure the bag mid-run if resistance agents start showing up.
🧠 Behind the Heist – What’s Fueling This Move?
Global risk-on tone? ✅
Dow futures resilience? ✅
Thief’s sentiment meter flashing GREEN? ✅
Index rebalancing & sector flow favoring bulls? ✅
We don’t just trade the chart. We rob the macro narrative.
🚫 News Caution – No Sudden Sirens
Avoid entering during red folder data drops or FOMC speeches.
Stay ghosted. Let the volatility settle, then strike. 🕵️♂️
💥 Smash the BOOST Button 💖 If You’re With the Crew!
Let’s run this like a proper cartel of information — share it, save it, tag your trader circle.
Every like supports the next robbery plan.
No signals. No fluff. Just pure market exploitation.
📌 Disclaimer: Educational analysis only. No financial advice. Manage your risk like a true thief — never expose the whole bag.
💼📊 Thief Trader Out — More heist maps coming soon.
🔐 Rob Smart. Stack Heavy. Run Fast. 🦹♂️💸📈