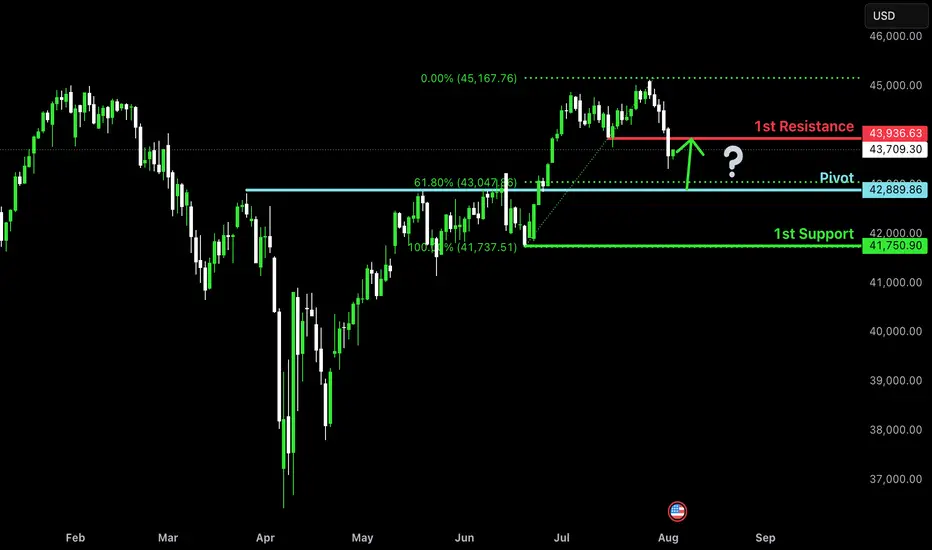
Falling towards pullback support?Dow Jones (US30) is falling towards the pivot and could bounce to the 1st resistance.
Pivot: 42,889.86
1st Support: 41,750.90
1st Resistance: 43,936.63
Risk Warning:
Trading Forex and CFDs carries a high level of risk to your capital and you should only trade with money you can afford to lose. Trading Forex and CFDs may not be suitable for all investors, so please ensure that you fully understand the risks involved and seek independent advice if necessary.
Disclaimer:
The above opinions given constitute general market commentary, and do not constitute the opinion or advice of IC Markets or any form of personal or investment advice.
Any opinions, news, research, analyses, prices, other information, or links to third-party sites contained on this website are provided on an "as-is" basis, are intended only to be informative, is not an advice nor a recommendation, nor research, or a record of our trading prices, or an offer of, or solicitation for a transaction in any financial instrument and thus should not be treated as such. The information provided does not involve any specific investment objectives, financial situation and needs of any specific person who may receive it. Please be aware, that past performance is not a reliable indicator of future performance and/or results. Past Performance or Forward-looking scenarios based upon the reasonable beliefs of the third-party provider are not a guarantee of future performance. Actual results may differ materially from those anticipated in forward-looking or past performance statements. IC Markets makes no representation or warranty and assumes no liability as to the accuracy or completeness of the information provided, nor any loss arising from any investment based on a recommendation, forecast or any information supplied by any third-party.
Market indices
#Nifty directions and levels for August 4th:Good morning, friends! 🌞
Here are the market directions and levels for August 4th:
The global market (based on the Dow Jones) has shown a moderately bearish sentiment,
while the local market continues to display a bearish tone. However, today, Gift Nifty indicates a positive opening.
What can we expect today?
In the previous session, both Nifty and Bank Nifty closed with a negative bias.
However, today’s market is indicating a gap-up start of around 80 points. Structurally, if this gap-up doesn't sustain,
we can expect the correction to continue, possibly with some consolidation.
On the other hand, if the gap-up sustains and breaks the 38% Fibonacci level with a solid candle or after some consolidation,
we can expect a pullback of at least 50% to 78% in the minor swing.
In this case, even if the market takes a pullback but fails to break the 38% Fibonacci level,
another round of correction may follow.

#Banknifty directions and levels for August 4th:
What can we expect today?
In the previous session, both Nifty and Bank Nifty closed with a negative bias.
However, today’s market is indicating a gap-up start of around 80 points. Structurally, if this gap-up doesn't sustain,
we can expect the correction to continue, possibly with some consolidation.
On the other hand, if the gap-up sustains and breaks the 38% Fibonacci level with a solid candle or after some consolidation,
we can expect a pullback of at least 50% to 78% in the minor swing.
In this case, even if the market takes a pullback but fails to break the 38% Fibonacci level,
another round of correction may follow.

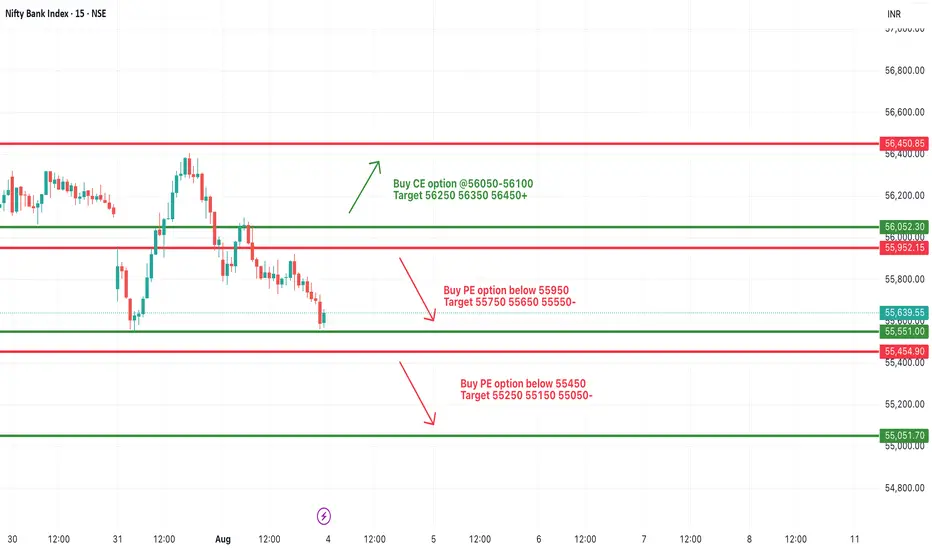
[INTRADAY] #BANKNIFTY PE & CE Levels(04/08/2025)Bank Nifty is expected to open flat or slightly gap up near the 55,600–55,650 zone. This zone could act as a critical decision point for today’s session, and price action around it will likely determine the trend for the day.
If Bank Nifty sustains above 55,950, a bullish reversal move may be triggered with potential upside targets at 56,250, 56,350, and 56,450+. A breakout above 56,050–56,100 will be essential to confirm bullish momentum.
On the downside, if Bank Nifty fails to hold above 55,950 and breaks below the 55,950–55,900 zone, a bearish continuation could unfold. Breakdown below 55,950 opens downside targets of 55,750, 55,650, and 55,550. A deeper fall can be expected if 55,450 is broken, with targets at 55,250, 55,150, and 55,050-.
Intraday traders should closely monitor price behavior around the 55,950–56,050 resistance zone.
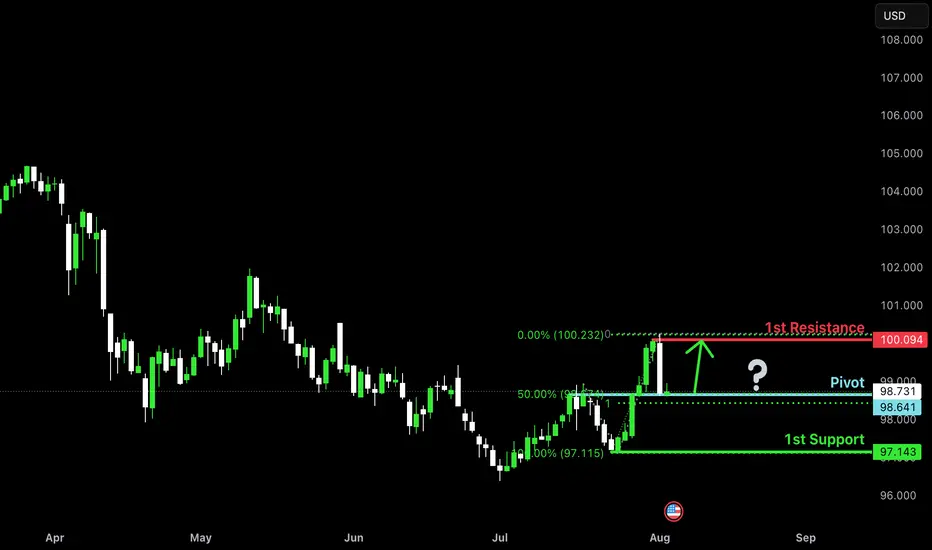
Bullish bounce off pullback support?The US Dollar Index (DXY) is reacting off the pivot, which is a pullback support that lines up with the 50% Fibonacci retracement and could bounce to the 1st resistance.
Pivot: 98.64
1st Support: 97.14
1st Resistance: 100.09
Risk Warning:
Trading Forex and CFDs carries a high level of risk to your capital and you should only trade with money you can afford to lose. Trading Forex and CFDs may not be suitable for all investors, so please ensure that you fully understand the risks involved and seek independent advice if necessary.
Disclaimer:
The above opinions given constitute general market commentary, and do not constitute the opinion or advice of IC Markets or any form of personal or investment advice.
Any opinions, news, research, analyses, prices, other information, or links to third-party sites contained on this website are provided on an "as-is" basis, are intended only to be informative, is not an advice nor a recommendation, nor research, or a record of our trading prices, or an offer of, or solicitation for a transaction in any financial instrument and thus should not be treated as such. The information provided does not involve any specific investment objectives, financial situation and needs of any specific person who may receive it. Please be aware, that past performance is not a reliable indicator of future performance and/or results. Past Performance or Forward-looking scenarios based upon the reasonable beliefs of the third-party provider are not a guarantee of future performance. Actual results may differ materially from those anticipated in forward-looking or past performance statements. IC Markets makes no representation or warranty and assumes no liability as to the accuracy or completeness of the information provided, nor any loss arising from any investment based on a recommendation, forecast or any information supplied by any third-party.
Nifty Extends Losing Streak: Is a Dead Cat Bounce Coming?The Nifty 50 dropped for the fifth week in a row, losing around 1.5%. Sectors like banks, IT, and consumer stocks are under pressure, and there are no big positive news to lift the market right now.
◉ Why is the Market Falling?
● Poor Q1 Results
Many big companies, especially in banking and IT, reported weaker-than-expected earnings. This disappointed investors and led to selling.
● U.S.–India Trade Trouble
The U.S. has added a 25% tax on Indian exports starting August 1. The two countries couldn’t agree on some trade issues, especially related to agriculture and dairy. This is bad news for export-focused companies.
● Weak Rupee
The rupee is near record lows against the U.S. dollar. This is because foreign investors are pulling money out of India. A weak rupee hurts sectors like IT and pharma, which earn in dollars.
◉ What the Charts Say?
The market has had a tough 5 weeks, but now it’s near a strong support level. This means a short-term bounce (dead cat bounce) is possible — a small recovery before another fall.
● Support at 24,500
There’s a large number of put option writers at this level. This means many traders are confident that Nifty won’t fall below 24,500 — so they’re willing to take that risk. This builds a strong support zone.
● Resistance at 24,700–24,800
There’s heavy call writing in this range. That means traders are betting Nifty won’t go above these levels. As a result, this area acts like a short-term ceiling or resistance.
Expect the Nifty to stay between these levels coming week unless some major news changes the game.
◉ Suggested Strategy
● For Traders: Stay cautious. Avoid aggressive long positions unless Nifty reclaims 25,000 decisively. Look for shorting opportunities near resistance zones with strict stop losses.
● For Investors: Stick to quality. Defensive pockets like FMCG, utilities, and select pharma may offer stability amid broader volatility.

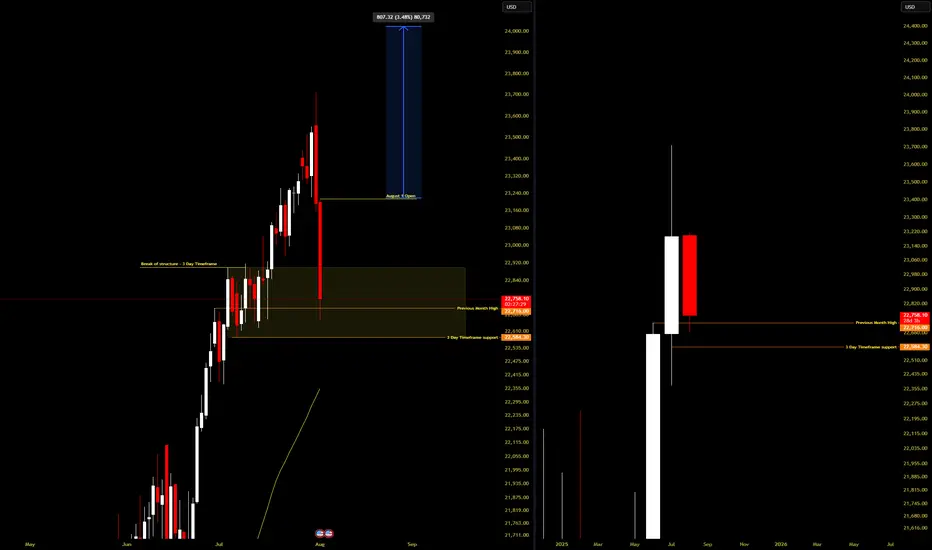
SWING TRADE NASDAQIs this another case of Trump moving the markets so his buddies can get better entries? 👀
Not saying anything... but July candles were way too friendly in that yellow box. Institutions were loading up like it was Black Friday.
I jumped in too—snagged a clean 10RR 😎📈
Now, with seasonality (August 3.5% average past 10 years) + Commitment of traders data backing me up( July COT is heavy longs), I’m risking light for a tiny 27RR setup.
Will it work? No clue.
Will I be dramatic about it? Absolutely. 🎭📉📈

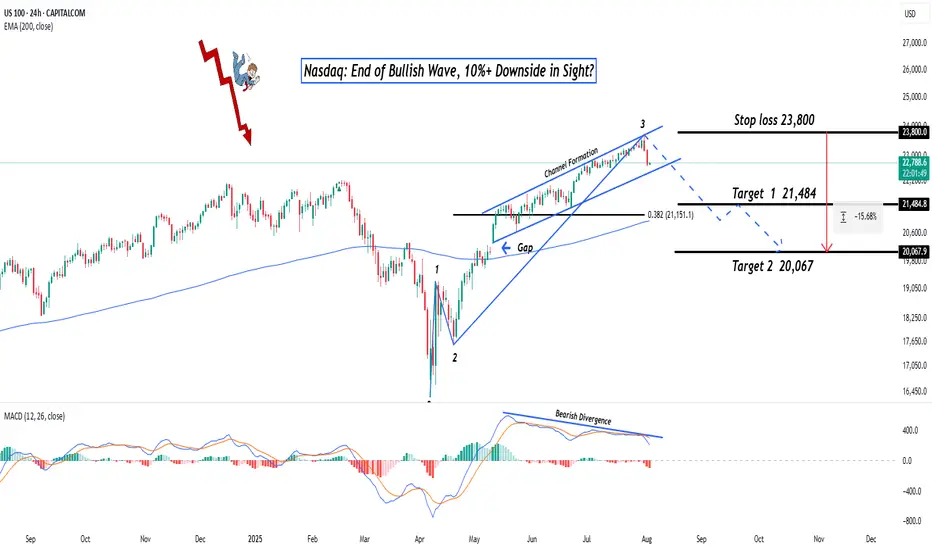
Nasdaq: End of Bullish Wave, 10%+ Downside in Sight?Hey Realistic Traders!
Has CAPITALCOM:US100 (Nasdaq) Finally Peaked? A Reversal Signal Just Flashed. Is This the Turning Point Toward a Deeper Pullback?
Let’s dive into the technicals to see what the chart is really telling us.
Technical Analysis
On the daily chart, the Nasdaq is starting to show signs of weakness. A bearish divergence has formed between the MACD and price movement , which is a classic signal that bullish momentum may be fading. This often indicates the potential for a trend reversal or a deeper correction.
A recent drop, confirmed by a strong bearish full-body candlestick, suggests that selling pressure is increasing. If this continues, we expect a breakdown from the current bullish channel.
In this scenario, the extended Wave 3 may have reached its peak. A correction could follow, with the first target at 21484, which lines up with the 0.382 Fibonacci retracement level. If the decline continues, the next downside target would be around 20067, where a previous gap may be filled.
This bearish outlook remains valid as long as the price stays below 23800 . A move above that level would invalidate the setup and return the outlook to neutral.
Support the channel by engaging with the content, using the rocket button, and sharing your opinions in the comments below.
Disclaimer: "Please note that this analysis is solely for educational purposes and should not be considered a recommendation to take a long or short position on Nasdaq.
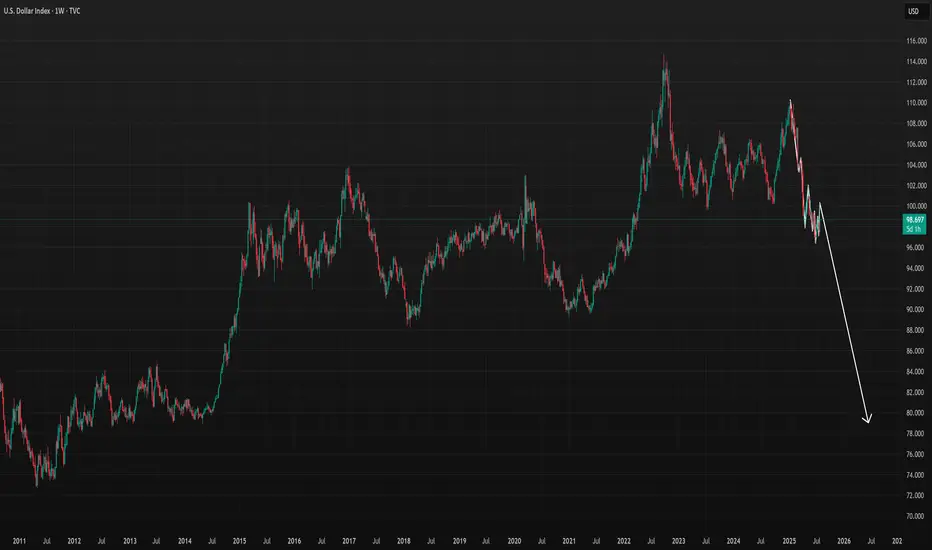
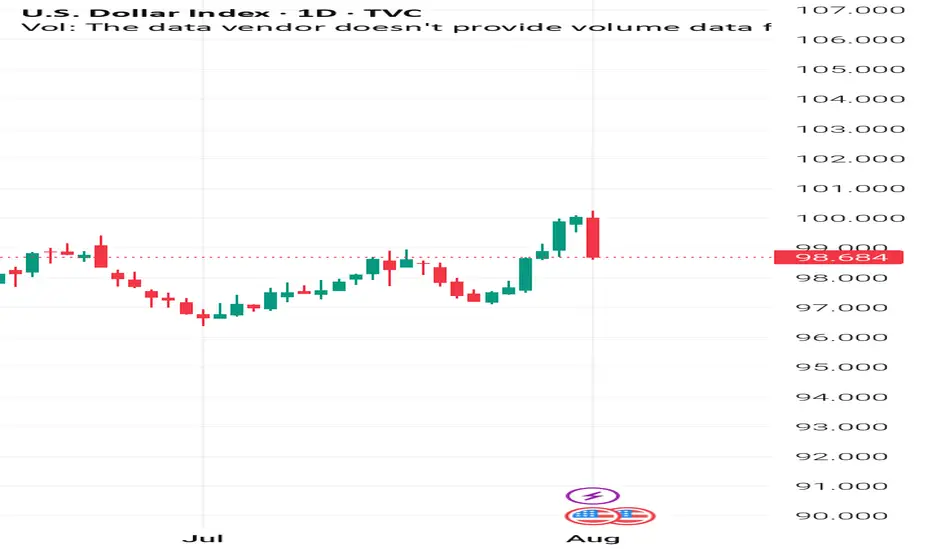
DXY to go extremely low due to Tariffs and Market ManipulationDXY to go extremely low due to Tariffs and Market Manipulation Reports
- The US Debt is almost over $38 Trillion in under 3 months
- Continue to monitor for weekly bearish signals on the chart
TVC:DXY
OANDA:USDCAD
OANDA:NZDUSD
AUS200 – Retest of 8,634.00 After Swing High RejectionAUS200 pulled back sharply after tagging the recent high at 8,784.83, now testing the 8,634.00 support zone which aligns with the 21 SMA. This level is acting as the immediate battleground.
Support at: 8,634.00 🔽 | 8,530.00 | 8,400.00
Resistance at: 8,784.83 🔼
🔎 Bias:
🔼 Bullish: If price stabilizes above 8,634.00 and reclaims bullish momentum, we could see another retest of the high at 8,784.83.
🔽 Bearish: A daily close below 8,634.00 puts 8,530.00 and 8,400.00 in play, especially if the 21 SMA fails to hold as dynamic support.
📛 Disclaimer: This is not financial advice. Trade at your own risk.

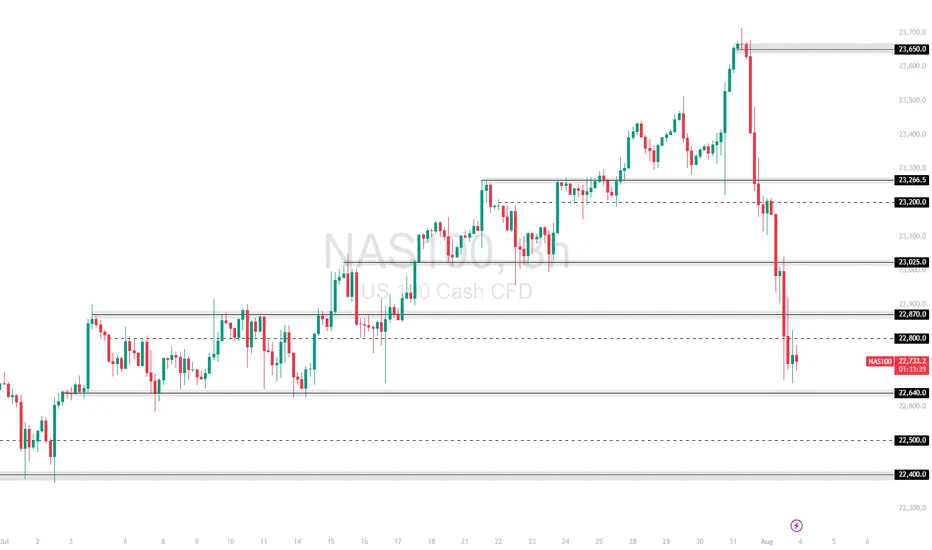
NAS100 Slammed by Fed Data and Trump Trade Remarks Can 22,640 ?The NAS100 plunged after strong US economic data fueled expectations of tighter Fed policy, and Trump's renewed push for aggressive trade deals rattled tech sentiment. After rejecting the 23,665 🔼 resistance, the index dropped sharply through multiple support levels.
Price is now consolidating just above the 22,640 🔽 zone, a key near-term support.
Support: 22,800 🔽, 22,640 🔽, 22,500 🔽
Resistance: 23,025 🔼, 23,277 🔼, 23,332 🔼
Bias:
🔽 Bearish: A breakdown below 22,640 could trigger a move toward 22,500. If that fails, 22,400 becomes the next target.
🔼 Bullish: A reclaim of 23,025 would be the first sign of bullish recovery.
📛 Disclaimer: This is not financial advice. Trade at your own risk.
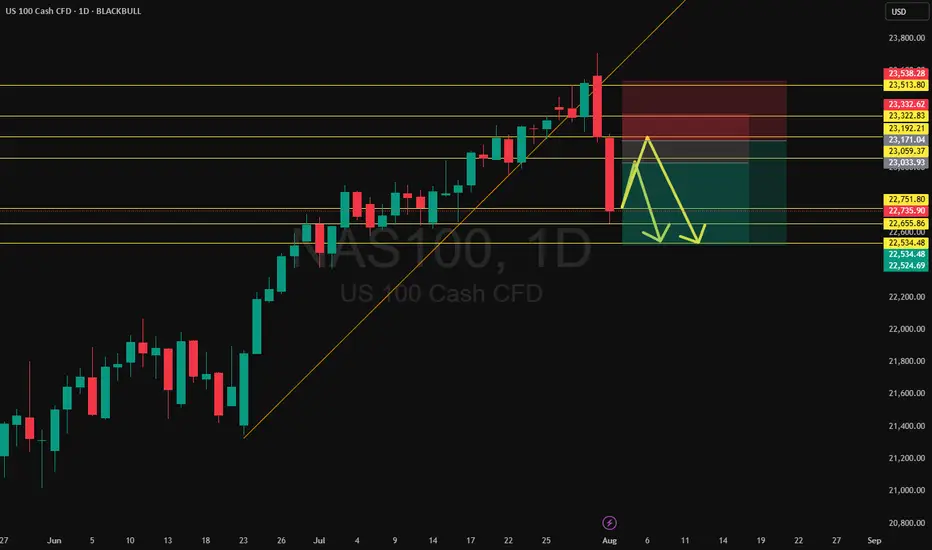
NASDAQ technical analyse.📉 NAS100 Technical Analysis – Potential Reversal Zone Identified (4H Chart)
Price has seen a strong bearish move, breaking through multiple support levels. Currently, it is approaching a key demand zone between 22,600 – 22,420, which previously acted as strong support in early July.
I'm watching two potential scenarios from this level:
🔹 Scenario A (Blue Path): A bullish reversal from the current zone, targeting the 23,400 area. This would require confirmation with bullish candlestick patterns or momentum divergence.
🔸 Scenario B (Red Path): A deeper dip into the demand zone (towards 22,420), followed by a stronger bounce. This could offer a better risk-to-reward long entry if bullish structure forms.
🔻 Invalid if price closes decisively below 22,400, breaking structure and invalidating the reversal setup.
Let me know your thoughts. Are you going long or still waiting for confirmation?

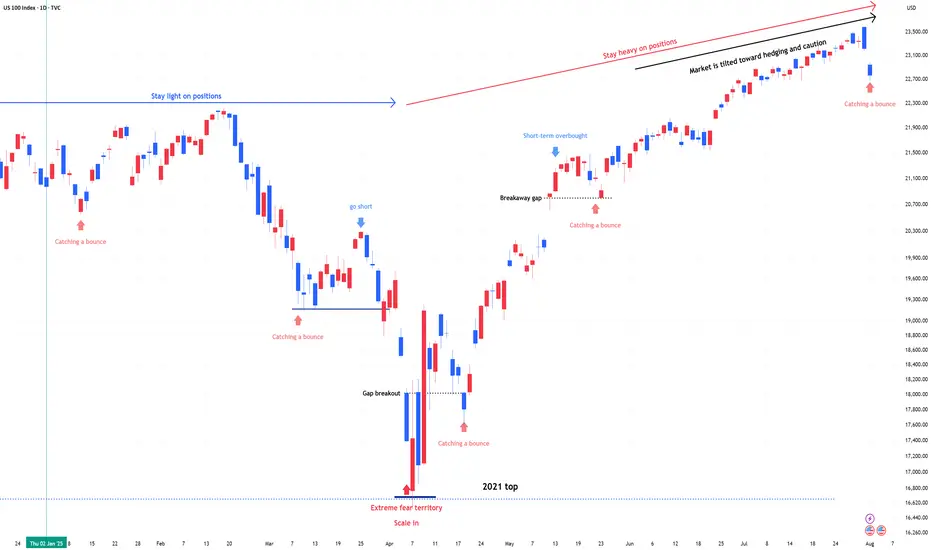
NDX & SPX , Stay heavy on positionsNDX & SPX , Stay heavy on positions (QLD, TQQQ)
Despite downside volatility, the trend remains intact. I’m maintaining the same view as before—this is still a zone to stay heavy.
S&P 500 Bullish Rounding Bottom in PlayS&P 500 continues its upward trajectory, supported by a clearly defined rounding bottom formation. Price has successfully broken above the neckline resistance, followed by a technical pullback which was met with a strong buy reaction, validating this zone as a key demand area.
This pullback area now acts as a critical structural base and the current bounce reinforces bullish continuation bias. The active plan is to accumulate within the buy-back zone and follow the path laid out in the chart towards the projected upside targets.
Drop your stock requests in the comments for a quick analysis, only US-listed stocks will be reviewed under this post.

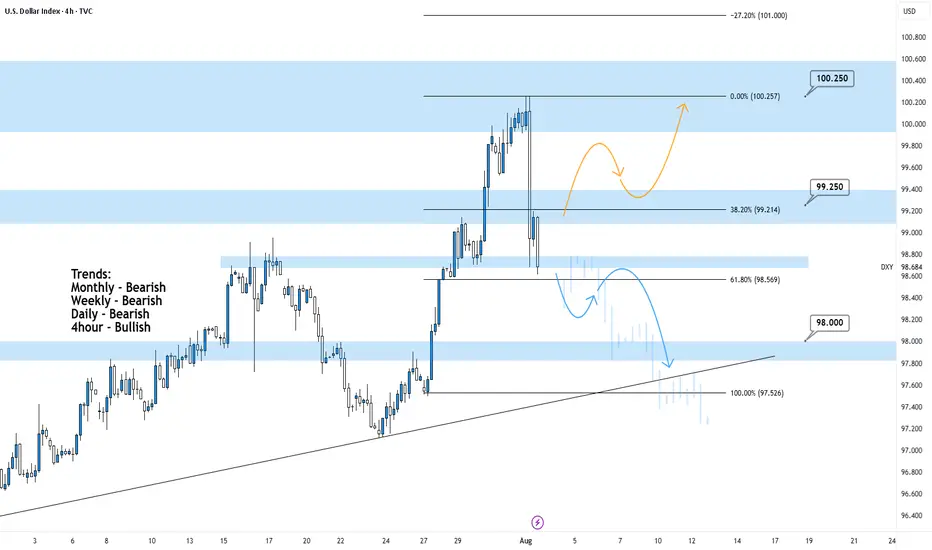
DXY 4Hour TF - August 3rd,2025🟦 DXY 4H Analysis Neutral idea
📅 August 3, 2025
🔹 Top-Down Trend Bias:
• Monthly – Bearish
• Weekly – Bearish
• Daily – Bearish
• 4H – Bullish
The dollar index is in a larger bearish cycle but just bounced from near-term resistance around 100.250. While the 4H shows temporary strength, we’re trading into major resistance and we may see it short lived.
🔍 Key Levels to Watch
• Support: 98.00
• Resistance Zones: 99.25 and 100.25
• 61.8% Fib: 98.57
Price is currently testing structure after rejecting from the 100.25 resistance zone. This area remains a strong ceiling unless the higher timeframe structure shifts.
✅ Scenario A: Bearish Continuation (Blue Path)
1. Bearish Structure confirmation below the current zone
2.If bearish rejection confirms, expect price to continue toward 98.00, possibly 97.50
3.Clean confluence with the higher timeframe trend
⚠️ Scenario B: Bullish Extension (Orange Path)
1.If price breaks and holds above 99.25, we may see a continuation toward 100.25
2.Short-term bullish strength, but against HTF bias
3.Must treat as a counter-trend idea unless confirmed with HTF structure shift
🧠 Final Notes
• 98.50 is the key decision zone, watch reaction closely
• Trend remains bearish on all major timeframes
• Don’t force the long, lean bearish unless structure proves otherwise
NAS100 Hits Monthly Level - Retrace or Reload?After a sharp leg down, NAS100 remains in a broader uptrend but is now reacting off a key monthly level. Expect a short-term retracement with the potential for a second leg lower. If bullish momentum returns, watch for an attempt to reclaim the level. Momentum is strong enough to challenge it again—traders should be ready for either a deep retrace or continuation move.
DAX Breaks Monthly Range - Double-Sided Opportunity AheadDAX has broken out to the downside from its monthly range, forming an expanding wedge. This creates two high-probability setups: a short back to the bottom of the range, and a long from the bottom toward the top - supported by the prevailing uptrend and strong confluence at range lows. Either way, the range is likely to hold for now, offering clear directional plays.

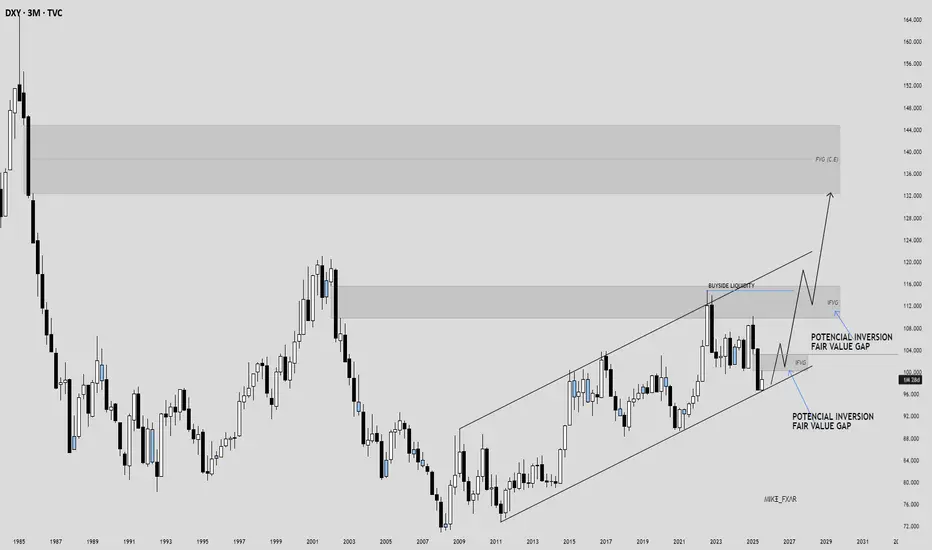
DOLLAR INDEX (DXY), Position Trade Bullish Point of ViewLooking at the DOLLAR INDEX (DXY), DXY might turn bullish after tapping the potential inversion fair value gap around 100.182 suggesting a macro continuation of the long-term uptrend, with price likely to retest the 103.197 IFVG (inversion fair value gap) area, break above 114.778 liquidity, and continue higher toward the 132.345 FVG from 1st of July 1985.
NASDAQ: Bears In Control! Sell it!Welcome back to the Weekly Forex Forecast for the week of Aug 4 - 8th.
In this video, we will analyze the following FX market:
NASDAQ (NQ1!) NAS100
The NAS 100 was weakened by bad job numbers, mixed earnings reports, and tariff wars. In the short term, it is bearish. Sell it down to the Weekly/daily +FVG for high probability buys from those levels.
Buying at current levels is not advised. Wait for a valid market structure shift to the upside before going long.
Enjoy!
May profits be upon you.
Leave any questions or comments in the comment section.
I appreciate any feedback from my viewers!
Like and/or subscribe if you want more accurate analysis.
Thank you so much!
Disclaimer:
I do not provide personal investment advice and I am not a qualified licensed investment advisor.
All information found here, including any ideas, opinions, views, predictions, forecasts, commentaries, suggestions, expressed or implied herein, are for informational, entertainment or educational purposes only and should not be construed as personal investment advice. While the information provided is believed to be accurate, it may include errors or inaccuracies.
I will not and cannot be held liable for any actions you take as a result of anything you read here.
Conduct your own due diligence, or consult a licensed financial advisor or broker before making any and all investment decisions. Any investments, trades, speculations, or decisions made on the basis of any information found on this channel, expressed or implied herein, are committed at your own risk, financial or otherwise.

USD to continue down?: Weekly Review/ fundamental analysis There was a lot of information to take in during the week starting Monday 28 July. A US / EUR trade deal announcement, US GDP, MICROSOFT earnings all contributed to positive market sentiment as the S&P continued to push all time highs. But in a reminder that anything can happen, a combination of NFP, AMAZON earnings and fresh TARIFF UNREST, ensured the week ended on a sour note.
The week got off to a good start with the US / EUR announcement. Although the news weakened the EUR as it appeared the US got the better end of the deal. And all of last weeks EUR positivity was unwound.
Despite the overall positive market mood at the beginning of the week, the currencies once again didn't quite correlate with the environment, as the USD and JPY both started the week particularly strong. Which could have been put down to 'EUR liquidity', meaning the USD and JPY benefited most from the weakness of the EUR. But, more likely, I suspected it was 'positioning' ahead of the important central bank interest rate meetings.
The meetings didn't disappoint, starting with the FOMC. The overall message was a continued reluctance to immediately cut interest rates. In a thinly veiled dig at the president, the line, "looking through inflation by not HIKING rates" sent the USD soaring as the probability of a September cut dropped to 40%.
A few hours later it was the BOJ'S turn. Although acknowledging inflation, a reluctance to immediately HIKE rates disappointed JPY bulls. And when added to positive MICROSOFT earnings, by Thursday's European session we had a peak JPY short opportunity.
But, alas, it wasn't long before disappointing Amazon earnings and the president stirring the tariff pot rocked the boat. And when Friday's NFP data 'surprised to the downside', the rot set in, the S&P dropped and in particular, sentiment for the USD crumbled. And the probability of a September rate cut significantly rose back up to 90%.
It's difficult to trade NFP at the best of times, but particularly when ISM data shortly follows. But I wouldn't argue with anyone who fancied a USD short on Friday.
I begin the new week with an open mind. I do think the S&P has a good chance of recovering (it's only natural for traders to use bad news as an excuse to take profits from all time highs). Sentiment for the USD could remain subdued, I suspect the US 10year will be a prominent part of the narrative.
On a personal note, outside of trading, drunk idiots smashing a bakery window and a member of staff leaving at short notice kept me busy. But I did manage one trade. A post BOJ 'short JPY'. It was coin toss between a post FOMC 'USD long' or a standard 'risk on AUD long'. I plumbed for the AUD. Ultimately, it wouldn't have mattered and the trade it profit.
Please feel free to offer thoughts questions, maybe you've spotted something I've not mentioned.
Results:
Trade 1: AUD JPY +1.3
Total = +1.3%
US30 _BUY RETRACEMENT-SELL CONTINUATION-HIGHER TIMEFRAME-FVGThe week of July 28th the market reacted off the resistance around the 45,097 level to the sellside creating a downward trend. On the Monthly and the weekly, the market has traded down into a higher timeframe FVG, possibly creating a buy model for the upcoming week. On the 4hour it's possible a continuation will occur to the sellside.

DOLLAR INDEX (DXY), Position Trade Bearish Point of ViewLooking at the DOLLAR INDEX (DXY), DXY might turn bearish after tapping the FVG above, potentially falling below the long-term ascending channel on the quarterly timeframe, suggesting a macro trend reversal, with price likely to break and retest 98.393 before continuing down toward the 84.464 FVG area.
