DOLLAR INDEX (DXY), Position Trade Bearish Point of ViewLooking at the DOLLAR INDEX (DXY), DXY might turn bearish after tapping the FVG above, potentially falling below the long-term ascending channel on the quarterly timeframe, suggesting a macro trend reversal, with price likely to break and retest 98.393 before continuing down toward the 84.464 FVG area.
Market indices

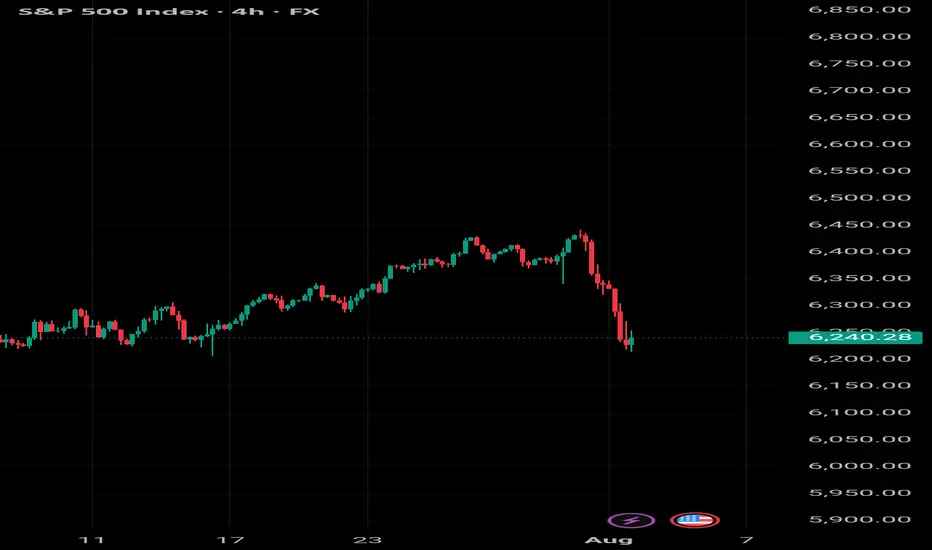
S&P 500: Bearish For The Short Term! Sell It!Welcome back to the Weekly Forex Forecast for the week of July 28 - Aug 1st.
In this video, we will analyze the following FX market for the week of Aug 4-8th:
S&P 500 (ES1!)
The S&P 500 rose Friday to fresh highs, following a busy week of tariff updates and earnings. The S&P ended the week with its fifth straight record close, its longest such streak in over a year.
No reason to consider selling. Wait for pullbacks to FVGs for high probability buys.
FOMC and NFP loom. Be careful to avoid new entries during news times.
Enjoy!
May profits be upon you.
Leave any questions or comments in the comment section.
I appreciate any feedback from my viewers!
Like and/or subscribe if you want more accurate analysis.
Thank you so much!
Disclaimer:
I do not provide personal investment advice and I am not a qualified licensed investment advisor.
All information found here, including any ideas, opinions, views, predictions, forecasts, commentaries, suggestions, expressed or implied herein, are for informational, entertainment or educational purposes only and should not be construed as personal investment advice. While the information provided is believed to be accurate, it may include errors or inaccuracies.
I will not and cannot be held liable for any actions you take as a result of anything you read here.
Conduct your own due diligence, or consult a licensed financial advisor or broker before making any and all investment decisions. Any investments, trades, speculations, or decisions made on the basis of any information found on this channel, expressed or implied herein, are committed at your own risk, financial or otherwise.

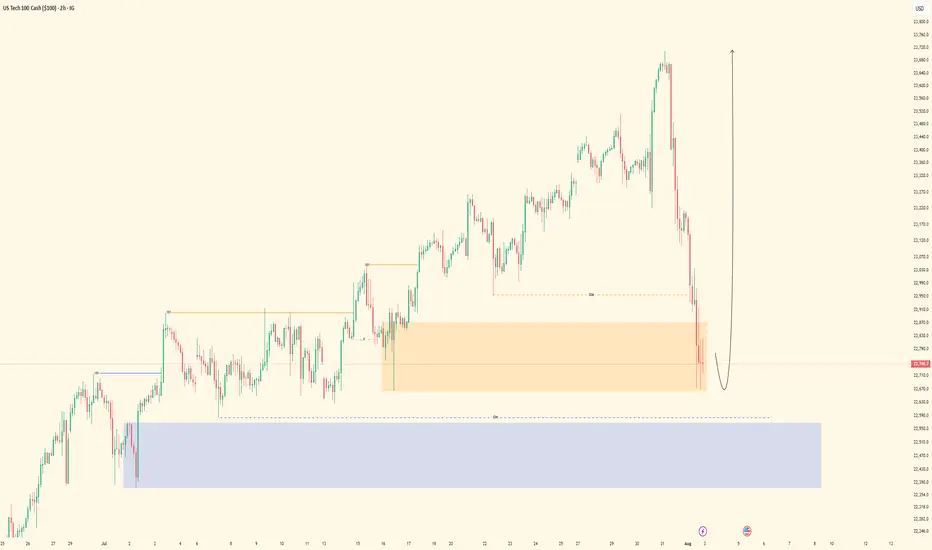
Nasdaq| Bullish Intent Maintained| Refined OB Reaction In Motion(Refined & Structured):
• Pair: Nasdaq (US100)
• Bias: Bullish / Buy
• 4H Overview: Bullish structure remains intact. Despite the congestion and noise, price maintained its upward trajectory. I refined the drop to mid timeframes for precision and clarity.
• 30M Structure: Refined bullish structure with clear intent. Price has mitigated a clean OB, setting the stage for further continuation.
• Entry Zone: Watching lower timeframes for confirmation to ride the wave higher.
• Targets: 5M to 30M structural highs depending on how price delivers.
• Mindset Note: Noise is just noise until structure filters it out. Precision comes from refining—this setup proves that. Stay focused, stay clean, let intent guide you.
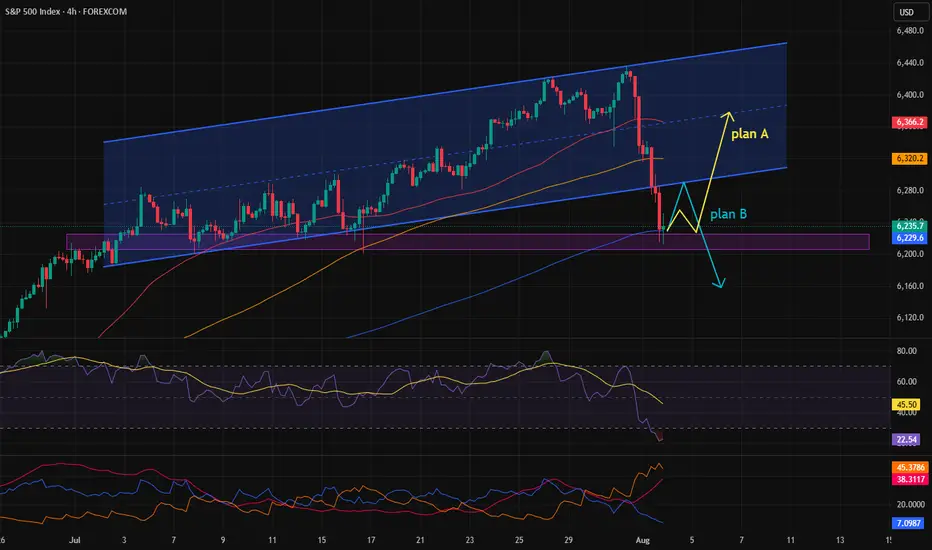
Possible return of the stock market downtrend.After a sharp drop due to last week's news, the S\&P stock index is now at a critical point.
Given the strong bullish trend it had previously, there’s a possibility we might see a return to the uptrend this week.
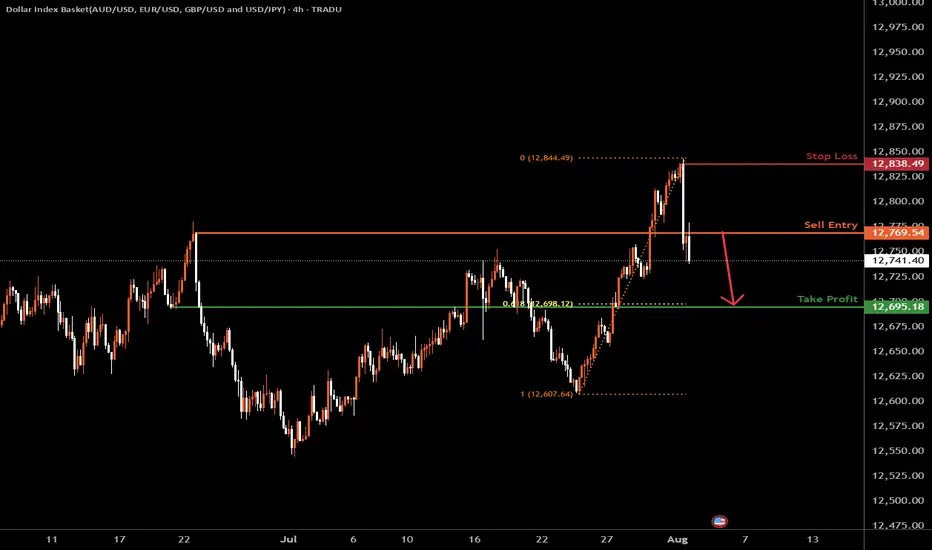
USDOLLAR H4 | Bearish dropBased on the H4 chart analysis, we could see the price drop lower from the sell entry, which is a pullback resistance and could drop to the downside.
Sell entry is at 12,769.54, which is a pullback resistance.
Stop loss is at 12,834.49, which is at 12,695.18, which is a pullback resistance.
Take profit is at 12,695.18, which is a pullback support that aligns with the 61.8% Fibonacci retracement.
High Risk Investment Warning
Trading Forex/CFDs on margin carries a high level of risk and may not be suitable for all investors. Leverage can work against you.
Stratos Markets Limited (tradu.com ):
CFDs are complex instruments and come with a high risk of losing money rapidly due to leverage. 65% of retail investor accounts lose money when trading CFDs with this provider. You should consider whether you understand how CFDs work and whether you can afford to take the high risk of losing your money.
Stratos Europe Ltd (tradu.com ):
CFDs are complex instruments and come with a high risk of losing money rapidly due to leverage. 66% of retail investor accounts lose money when trading CFDs with this provider. You should consider whether you understand how CFDs work and whether you can afford to take the high risk of losing your money.
Stratos Global LLC (tradu.com ):
Losses can exceed deposits.
Please be advised that the information presented on TradingView is provided to Tradu (‘Company’, ‘we’) by a third-party provider (‘TFA Global Pte Ltd’). Please be reminded that you are solely responsible for the trading decisions on your account. There is a very high degree of risk involved in trading. Any information and/or content is intended entirely for research, educational and informational purposes only and does not constitute investment or consultation advice or investment strategy. The information is not tailored to the investment needs of any specific person and therefore does not involve a consideration of any of the investment objectives, financial situation or needs of any viewer that may receive it. Kindly also note that past performance is not a reliable indicator of future results. Actual results may differ materially from those anticipated in forward-looking or past performance statements. We assume no liability as to the accuracy or completeness of any of the information and/or content provided herein and the Company cannot be held responsible for any omission, mistake nor for any loss or damage including without limitation to any loss of profit which may arise from reliance on any information supplied by TFA Global Pte Ltd.
The speaker(s) is neither an employee, agent nor representative of Tradu and is therefore acting independently. The opinions given are their own, constitute general market commentary, and do not constitute the opinion or advice of Tradu or any form of personal or investment advice. Tradu neither endorses nor guarantees offerings of third-party speakers, nor is Tradu responsible for the content, veracity or opinions of third-party speakers, presenters or participants.
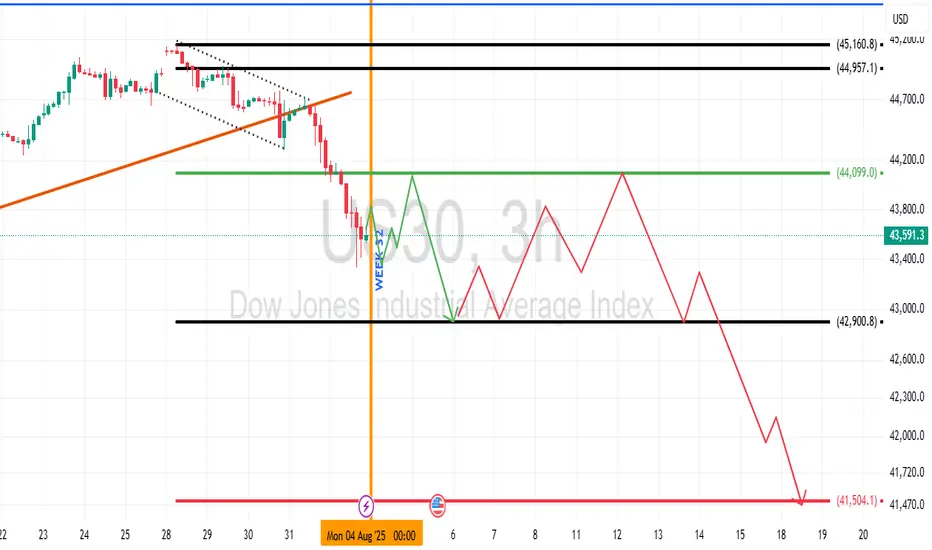
US 30 Dow Jones Industrial Average Week 32 OutlookUS 30, along with related indices, is likely to range for most of the week with early sells to confirm the support of interest. Best interest is in the bearish sentiment right now.
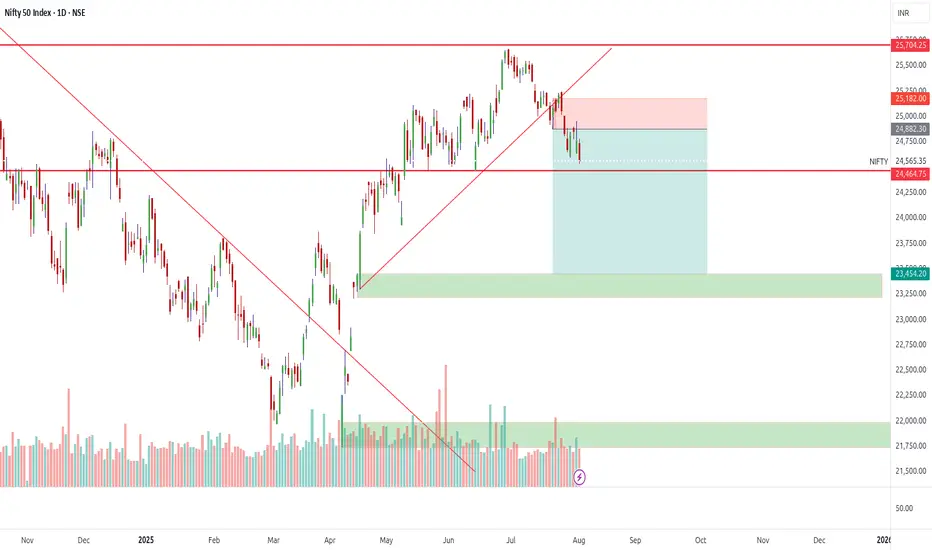
Nifty 50 Outlook and Derivatives Analysis — 04 Aug 2025
1. Market Snapshot — Nifty 50 on 01 Aug 2025
On Friday, 1 August 2025, the Nifty 50 opened at 24,734.90, surged to an intraday high of 24,784.15, hit a low of 24,535.05, and closed at 24,565.35 — a net decline of 203 points or approximately –0.82% from the prior close (~ 24,768.35). The session began cautiously, briefly challenging early resistances before turning lower amid broad profit-taking. Selling intensified in the latter half of the day, as weak global cues dragged indices, causing price to revisit intraday lows near 24,535. Despite bulls’ attempt to reclaim the 24,780–24,800 zone, they were swiftly pushed back. The closing fall erased mid-week gains, reflecting scattered sectoral weakness. Volume levels were steady but breadth remained negative, pointing to limited conviction from buyers. In summary, a mixed start followed by technical weakness allowed the index to close below the opening mark, reinforcing a mildly bearish bias ahead of the new trading week.
2. Top Gainers & Losers — 01 Aug 2025 (Nifty 50 Stocks)
• Top Gainers: Clean Science (SCIEN), G R Infraprojects (GRINFRA), HDFC Bank (HDFCBANK), Vodafone Idea (IDEA), and Tata Motors (TATAMOTORS) were identified among Nifty 50’s top gainers based on high relative strength and trading momentum. Exact open prices or point-by-point moves were not disclosed in publicly available platforms.
• Top Losers: Sun Pharma, Dr. Reddy’s, Adani Enterprises, Tata Steel, and Cipla were the largest decliners in the index, with losses ranging from –3% to –4.5% intraday. Sun Pharma led the downturn, falling approximately 4.5%, while Dr. Reddy’s and Tata Steel saw sharp cuts following weak results and sectoral headwinds.
Overall, sectors like pharma, metals, auto, and IT weakened sharply, whereas only PSU banks, select infra names, and defense-heavyweights displayed relative resilience. No Nifty stock posted gains above +3%; FMCG and life insurance stocks provided only modest support.
3. Support & Resistance for 04 Aug 2025 — OI & Range Analysis
• Max Call OI (Resistance): The ₹25,000 strike shows the highest open interest among call options for the upcoming weekly expiry, suggesting strong resistance and short interest around 24,900–25,000.
• Max Put OI (Support): The ₹24,500 put strike has the largest position buildup, implying a solid floor near 24,500.
• Trading Range: The implied trading band for Monday appears to be 24,500–25,000, within which price is expected to oscillate without fresh catalysts. A sustained break either below 24,500 (toward 24,200–24,300) or above 25,000 (toward 25,200–25,400) may reinforce directional momentum.
4. Technical Indicators & Timeframe Signals
▪ RSI (14 Day)
RSI is hovering around 40–42, indicating mild bearish pressure but not deeply oversold—implying limited momentum left for a sharp bounce.
▪ MACD
MACD remains negative with the MACD line below the signal line and shrinking red histogram bars, suggesting that while the downtrend persists, its momentum may be easing.
▪ Pivot Points (Classic Method)
Calculated from the previous session’s high, low, and close:
• Pivot ≈ 24,628,
• R₁ ≈ 24,721, R₂ ≈ 24,877,
• S₁ ≈ 24,472, S₂ ≈ 24,379.
Notably, R₂ (~24,877) aligns closely with OI resistance; S₁ (~24,472) is just below the key 24,500 support.
• A bullish demand zone exists around 24,500–24,550, where price consistently found buyers intraday—correlating with put OI at 24,500.
• A bearish supply zone forms near 24,900–25,000, where intraday rallies repeatedly failed—reinforced by high call OI at the 25,000 strike.
Traders may look for long entries near 24,550 with tight stops and consider trimming positions toward the high 24,900 levels.
5. Gann Outlook — Extended Support, Forecasted Resistance
Using Gann’s classic rules and midpoint levels:
• Midpoint of the 52 week range (≈ 26,277 high, ≈ 21,744 low) places a significant reference at ≈ 24,000, a level still respected as long as the index trades above it.
• Gann’s square of nine and angle methods highlight 25,000–25,100 as a natural resistance band—coincidentally matching the options-derived resistance zone.
• Downside remains capped near 24,000; below it, negative Gann-based extension targets emerge (e.g., approx. 23,800). Conversely, a hold above 24,500 could lead to a rebound toward 25,200–25,600, consistent with Gann-era time cycles and chart patterns.
Conclusion & Trading Outlook
As Nifty opens on 04 August 2025, it is snugly contained within a 24,500–25,000 trading channel. The index is attempting to stabilize near 24,565, down ~0.82% from Friday, while technical momentum tools (RSI, MACD) remain subdued. Support at ≈ 24,500 is anchored by strong put writing and order block demand; resistance at ≈ 25,000 is buttressed by call OI, pivot calculations, and Gann psychological significance.
With no breakout signals yet, expect range bound trading: dips should find support near 24,500, and rallies are likely to stall near 24,900–25,000 unless global triggers emerge. A breakdown below 24,500 may lead to 24,200–24,300; a clean break above 25,000 on volume could open pathways toward 25,200–25,400.
Suggested strategy:
• Consider shorts near 24,900–25,000 with tight stops just above 25,050.
• Explore longs near 24,500–24,550, with stops sub 24,450 targeting 24,700–24,800.
Traders should remain focussed on cues from U.S. markets, currency moves, FII flows, and commodity cycles—these often influence directional biases in the early part of each week. For now, the bias remains cautiously bearish, though technical oversold signals plus firming near term support may offer a tradable rebound setup if news flows improve.
Conclusion-
Disclosure: The publisher of this idea is not a SEBI registered analyst. The information shared here is solely for educational purposes and should not be interpreted as financial advice. Always consult with a qualified financial advisor before making any investment decisions. The publisher does not endorse social media shares on any platform.

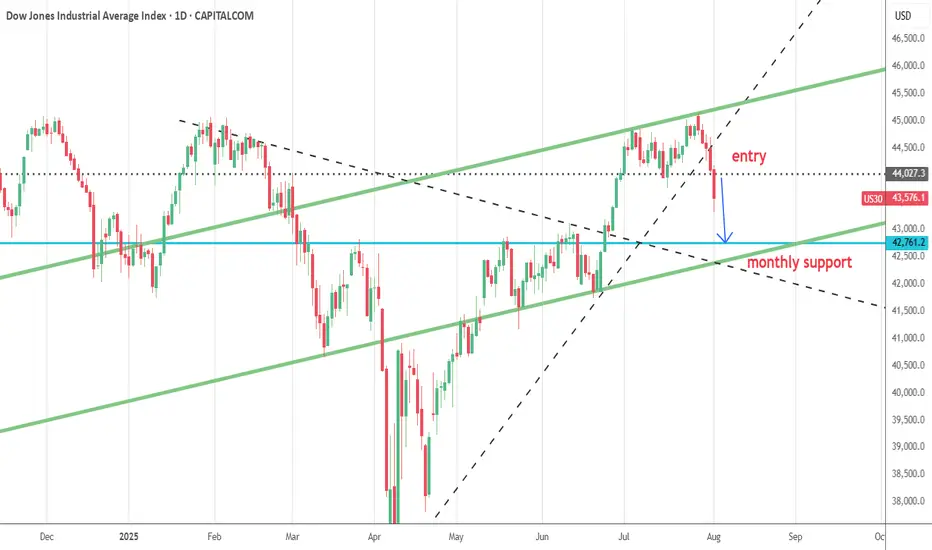
Anticipating DJIOn the daily timeframe, the current position of the Dow Jones Industrial Average (DJI) is projected to follow one of three possible scenarios:
Scenario 1 (Black Label):
DJI is currently in the process of forming Wave iv of Wave , implying that any short-term rebound is likely to be limited. The index may test the resistance area between 43,953–44,142, but remains vulnerable to further downside correction thereafter.
Scenario 2 (Red Label):
In this scenario, Wave 4 is considered complete, allowing DJI to resume its upward momentum. A breakout would signal the start of Wave 5, targeting the 45,324–46,465 range for a potential new higher high.
Scenario 3 (Blue Label):
Here, DJI is assumed to be in the midst of Wave 4 of Wave (5). A corrective move is expected first, potentially revisiting the support zone around 42,262–43,028, before continuing its bullish trend to form a new higher high.

DXY SHORT Well, the dollar index is in a descending channel. The expectation is that the price will fall from the channel ceiling to the channel floor.
This post will be updated.,

NIFTY Toot Sakta Hai?! | US-Russia War Impact ExplainedHey traders,
Serious geopolitical tension is brewing between the U.S. and Russia, and if things escalate, we could see a major shake-up in global markets — including our very own Nifty 50.
Here’s my view:
🔹 24,500 is the immediate level to watch.
If this breaks down with volume, 24,000 is next, and things could get ugly quickly.
🔻 In a worst-case escalation, Nifty may drop all the way to 23,500 – 21,000.
Yes — that deep. And it won’t be a straight line.
💡 My trading strategy?
I’m avoiding heavy longs
Hedging with puts
Staying in cash or safe sectors
Watching global cues, especially crude oil and the India VIX
📉 Protect capital first — opportunities will come later.
Like, comment your view, and don’t forget to subscribe for more real-time market updates. Stay sharp, stay safe!
#Nifty #StockMarketIndia #USRussiaWar #Geopolitics #NiftyAnalysis #TradingStrategy
Dow Jones August GameplanNow that the first trading day of August has printed, can one reliably forecast the possible month based on just the first day? I am inclined to believe that one can with a small amount of accuracy. Not perfect.
There are two types of monthly cycles when the first traded day is a bearish candle right from the open of the month.
Type 1 is a bearish trending cycle that trends lower and lower. It is then followed up by small number of bullish pullbacks halfway through the month before rolling back over and closing near the lows.
Type 2, more common, is when the first traded day is bearish right from the get-go as well, trades lower but reverses near the beginning of the month before trading higher than the open and forming a bullish bar.
So, in my opinion, there are only two probably outcomes for August.
Type 1:
Type 2:

3rd August 2025 Daily Analysis For DxyDAILY DXY ANALYSIS FOR 3RD AUGUST 2025. Looking to see this setup play out completely on DXY . Will be focused on selling Gu and EU when the DXY setup start playing out

What the Next CPI Print Could Do to the S&P500What the Next CPI Print Could Do to the S&P500
A technical and macro setup ahead of the inflation release
Next week’s CPI report could be one of the most important data points of the quarter, not just for the Fed, but for traders watching the S&P500 (SPX) at these elevated levels.
We’ve seen inflation data act like a volatility trigger in recent months, especially when it diverges from market expectations. And with the S&P flirting with key resistance, the stage is set for either a breakout or a reversal.
Let’s break down both the macro implications and the technical chart setup heading into the release.
Why CPI Matters?
If headline CPI comes in hot, markets may price in fewer Fed cuts this year. Yields spike and SPX often reacts with a sharp pullback.
If inflation cools faster than expected, the Fed may stay dovish. That typically gives SPX and risk assets broadly room to breathe higher.
Current expectations:
- Headline CPI: 3.2 percent
- Core CPI: 3.4 percent
Anything above those numbers is risk-off. Anything below supports the soft landing narrative.
Technical Setup on SPX
On the 4H and daily chart, here’s what we’re seeing:
- Price hovering around a key resistance zone between 5,660 and 5,680
- Rising wedge structure starting to form, typically a bearish sign near market tops
- Bearish RSI divergence on 1D chart
- Volume has been declining on recent pushes higher, showing lack of conviction
Key Levels
- Support: 5,615 and 5,575
- Breakout Target (if CPI is dovish): 5,750 to 5,770
- Downside Target (if CPI surprises hot): 5,500 to 5,480
Watch for a volatility spike on the release and be cautious about chasing the first move.
My Play
I’m personally staying flat heading into the data.
Too much chop, not enough conviction. But I’ll be watching for:
- A false breakout trap above 5,680 followed by reversal as a possible short setup
- Or a clear retest and hold above 5,700 with volume, which may confirm further upside
CPI has become the new FOMC. Be patient and reactive, not predictive.
Final Thought
CPI prints used to be background noise. Not anymore.
This one matters, and SPX is sitting in a technical pressure cooker.
Whatever side you lean toward, come in with a plan and don’t trade the first candle.
DXY Analysis todayHello traders, this is a complete multiple timeframe analysis of this pair. We see could find significant trading opportunities as per analysis upon price action confirmation we may take this trade. Smash the like button if you find value in this analysis and drop a comment if you have any questions or let me know which pair to cover in my next analysis.

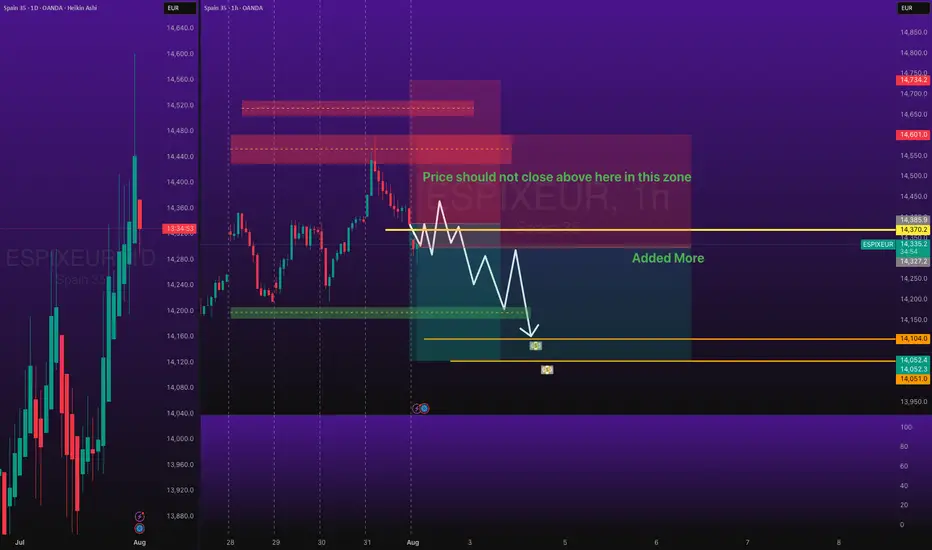
ESPIXEUR Short Trade with SL and TPOANDA:ESPIXEUR Short Trade - Low Risk, with my back testing of this strategy, it hits multiple possible take profits, manage your position accordingly.
Note: Manage your risk yourself, its risky trade, see how much your can risk yourself on this trade.
Use proper risk management
Looks like good trade.
Lets monitor.
Use proper risk management.
Disclaimer: only idea, not advice
#DAXDate: 01-08-2025
#DAX Current Price: 23680
Pivot Point: 24193.295 Support: 23822.409 Resistance:24566.692
Upside Targets:
🎯 Target 1: 24882.344
🎯 Target 2: 25197.995
🎯 Target 3: 25574.758
🎯 Target 4: 25951.520
Downside Targets:
🎯 Target 1: 23505.502
🎯 Target 2: 23188.595
🎯 Target 3: 22811.833
🎯 Target 4: 22435.070
#TradingView #Nifty #BankNifty #DJI #NDQ #SENSEX #DAX #USOIL #GOLD #SILVER
#BHEL #HUDCO #LT #LTF #ABB #DIXON #SIEMENS #BALKRISIND #MRF #DIVISLAB
#MARUTI #HAL #SHREECEM #JSWSTEEL #MPHASIS #NATIONALUM #BALRAMCHIN #TRIVENI
#USDINR #EURUSD #USDJPY
#SOLANA #ETHEREUM #BTCUSD #MATICUSDT #XRPUSDT
#Crypto #Bitcoin #BTC #CryptoTA #TradingView #PivotPoints #SupportResistance

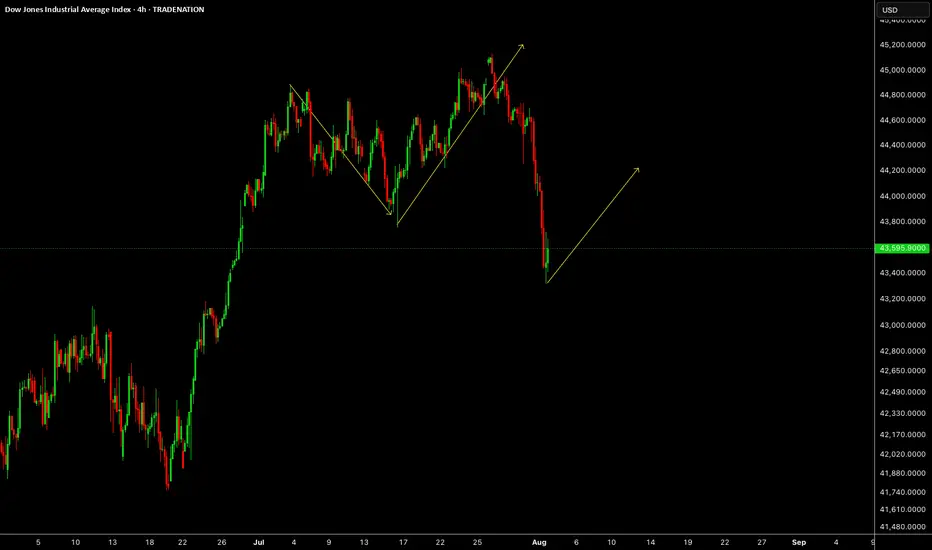
US30US30 was expected to drop last week which is what market has done. This week we need upside correction or impulse.
Disclosure: We are part of Trade Nation's Influencer program and receive a monthly fee for using their TradingView charts in our analysis.
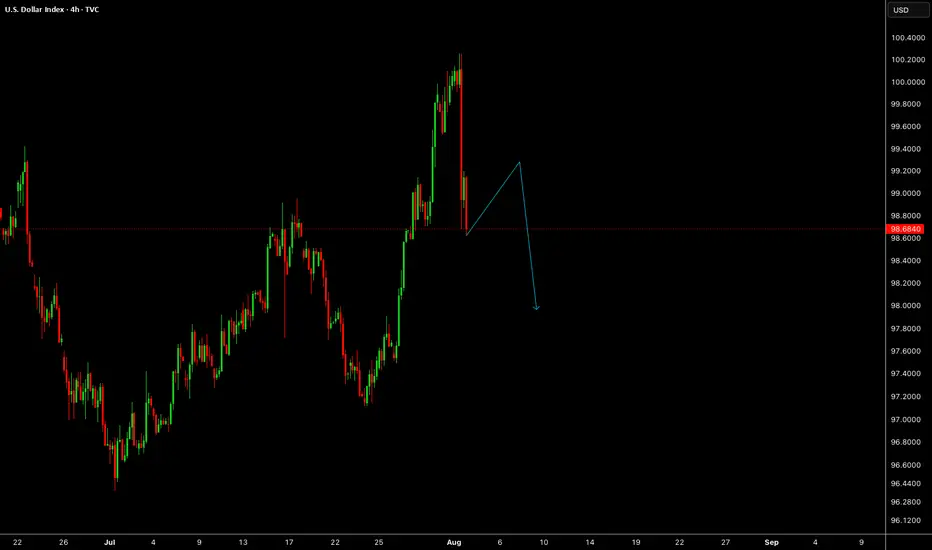
DXYDXY has given us a drop last week, lets wait for a correction to trade another drop.
Disclosure: We are part of Trade Nation's Influencer program and receive a monthly fee for using their TradingView charts in our analysis.
Germany 40DE40 Looks like doing this. It's going to retest an old area that was used bypassed while making an all time high.

UPDATEFriday we closed on the breakeven after that the price reached our 50% level of the trade, so our TP was raised to the breakeven.
Follow for more trades to catch up the next week!

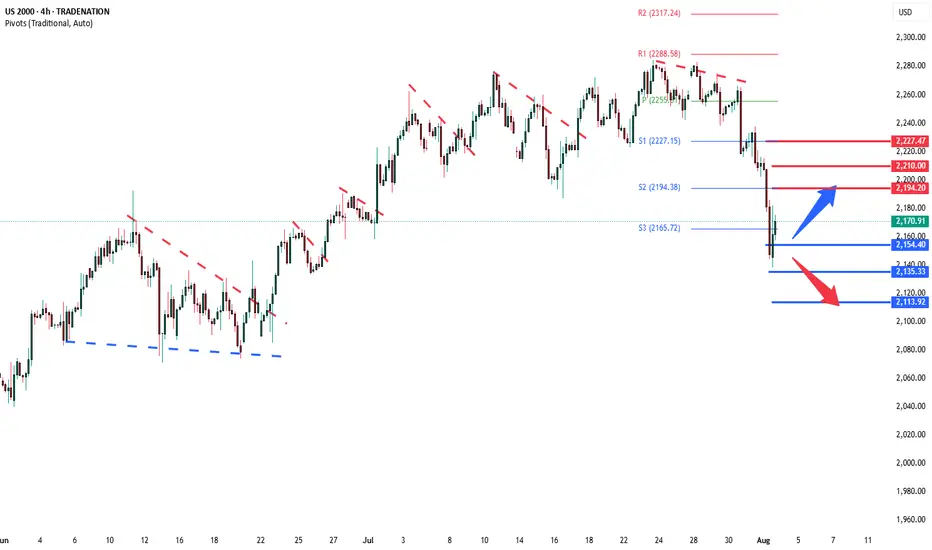
Russell2000 Key Trading levelsKey Support and Resistance Levels
Resistance Level 1: 2194
Resistance Level 2: 2210
Resistance Level 3: 2227
Support Level 1: 2154
Support Level 2: 2135
Support Level 3: 2113
This communication is for informational purposes only and should not be viewed as any form of recommendation as to a particular course of action or as investment advice. It is not intended as an offer or solicitation for the purchase or sale of any financial instrument or as an official confirmation of any transaction. Opinions, estimates and assumptions expressed herein are made as of the date of this communication and are subject to change without notice. This communication has been prepared based upon information, including market prices, data and other information, believed to be reliable; however, Trade Nation does not warrant its completeness or accuracy. All market prices and market data contained in or attached to this communication are indicative and subject to change without notice.
Stoxx50 sideways consolidation continuesKey Support and Resistance Levels
Resistance Level 1: 5464
Resistance Level 2: 5500
Resistance Level 3: 5580
Support Level 1: 5152
Support Level 2: 5097
Support Level 3: 5044
This communication is for informational purposes only and should not be viewed as any form of recommendation as to a particular course of action or as investment advice. It is not intended as an offer or solicitation for the purchase or sale of any financial instrument or as an official confirmation of any transaction. Opinions, estimates and assumptions expressed herein are made as of the date of this communication and are subject to change without notice. This communication has been prepared based upon information, including market prices, data and other information, believed to be reliable; however, Trade Nation does not warrant its completeness or accuracy. All market prices and market data contained in or attached to this communication are indicative and subject to change without notice.
