US30 Swing Short!
HI,Traders !
#US30 keeps falling down
And the index broke the
Key wide horizontal level
Around 43924.6 which is now
A resistance and the breakout
Is confirmed so we are very
Bearish biased and we will
Be expecting a bearish
Continuation on Monday !
Comment and subscribe to help us grow !
Market indices

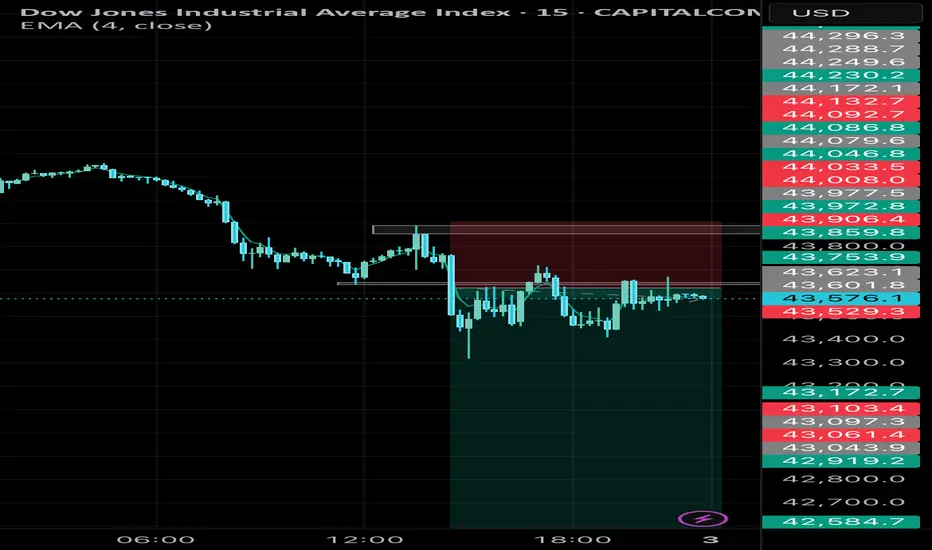
US30 (15M) – Bearish Reversal Setup, Short Opportunity📊 Analysis:
The US30 index on the 15-minute chart is showing signs of a bearish reversal after a recent upward push. Key technical observations:
1. Price Action & Structure
* US30 has been trading in a minor uptrend, but momentum is weakening.
* The latest 15M candles show lower highs forming near resistance, suggesting exhaustion in buying pressure.
2. Resistance Zone
* The price is rejecting a strong intraday resistance zone near 43641.90.
* Multiple failed attempts to break above this level reinforce it as a key barrier.
3. Target Levels
* First support target: 43206.96 – a minor support from previous structure.
* Secondary target: 41911.76.
4. Risk Management
* Suggested stop-loss: Above the recent swing high.
* Risk/reward ratio: Aim for at least 1:2 to ensure proper trade efficiency.
✅ Summary:
US30 on the 15-minute chart is showing a bearish setup.
⚠️ This analysis is for educational purposes only and not financial advice. Always use proper risk management.
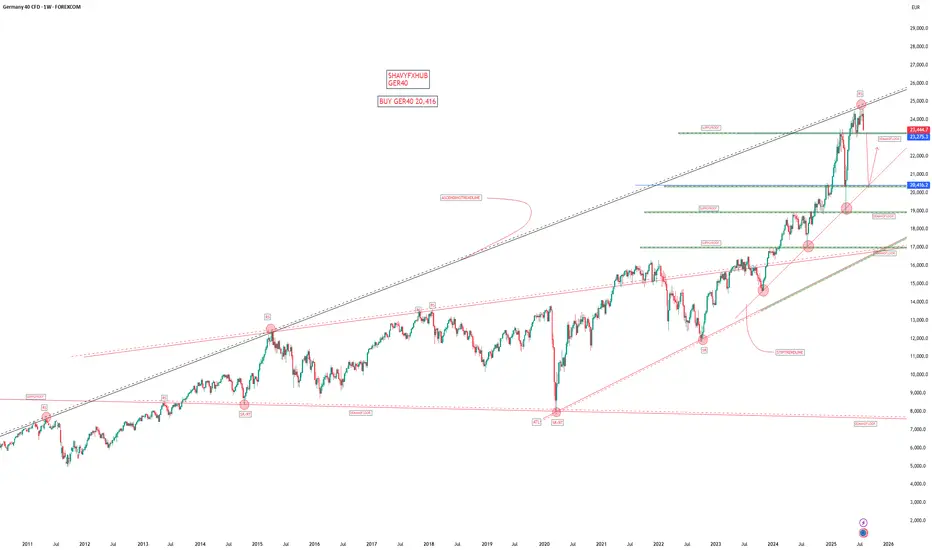
GER40 ATH LOADINGIt as not been an easy week for the market. But we move, here on these post, i made analysis on EIGHTCAP:GER40 , Using the combination of dailytf, H4 and H2, For further clarification, pls see the video. All the best.

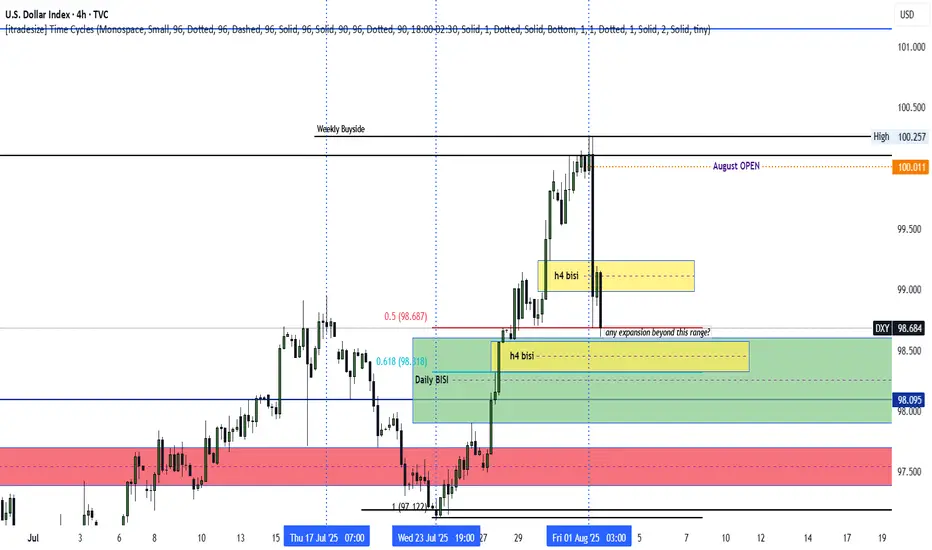
DXY bullish into AUGUSTThe dxy seems poised to rally following a rally above PMHs. The August OPEN decline could end up being nothing but a retracement as we rally high. Monday, Tuesday and Wednesday could range, while Thursday and the NFP push us above August's current highs. An expansion below Friday's New York AM lows (H4) could signal continued decline as we seek to establish weekly LOWS. Patience as the market unfolds is hand is ALWAYS key. Let's chat.
US100The US100, also known as the Nasdaq 100 Index, tracks the performance of the 100 largest non-financial companies listed on the Nasdaq Stock Exchange, primarily in the technology, consumer services, and healthcare sectors. It is a market-capitalization-weighted index and includes major corporations such as Apple, Microsoft, Amazon, NVIDIA, Meta, and Alphabet. As a tech-heavy index, the US100 is highly sensitive to changes in interest rates, innovation cycles, investor sentiment, and macroeconomic indicators, especially those related to inflation, employment, and monetary policy.
Over the past two decades, the Nasdaq 100 has experienced strong long-term growth, driven by the expansion of the digital economy, cloud computing, artificial intelligence, and e-commerce. After a steep correction in 2022 caused by inflation concerns and aggressive rate hikes by the Federal Reserve, the index rebounded in 2023 and 2024, supported by improving macroeconomic conditions, a stabilization in interest rates, and renewed investor confidence in tech and growth stocks. AI-driven investments, semiconductor breakthroughs, and tech-led productivity gains have further fueled its momentum.
As of August 2025, the US100 is trading at 22,747, marking a new historical high. This reflects strong earnings performance from major tech companies, continued innovation in AI and automation, and a more dovish outlook from the Federal Reserve, which has helped reduce pressure on growth equities. Despite its gains, the index remains vulnerable to volatility stemming from inflation surprises, geopolitical risks, and shifts in central bank policy. The Nasdaq 100 continues to be a key benchmark for growth-oriented investors and a barometer for the health of the global tech sector.

DXYThe DXY, or US Dollar Index, measures the value of the US dollar against a basket of six major world currencies: the euro (EUR), Japanese yen (JPY), British pound (GBP), Canadian dollar (CAD), Swedish krona (SEK), and Swiss franc (CHF). It is a weighted index, with the euro having the largest share, making movements in EUR/USD especially influential on the index. The DXY was created in 1973 by the US Federal Reserve to provide a clear benchmark for the dollar’s international strength after the collapse of the Bretton Woods system.
Since its inception, the DXY has served as a vital gauge of the dollar’s performance in global trade and financial markets. Historically, it reached its all-time high near 164.72 in 1985, during a period of aggressive US interest rate hikes and a strong economic expansion. Conversely, it hit its all-time low around 70.70 in 2008, at the peak of the global financial crisis, when confidence in the US economy sharply declined.
The index typically rises when investors seek safety in the US dollar, especially during global risk-off events or when US interest rates are relatively high. It also tends to strengthen during periods of US economic growth, reduced liquidity, or tightening by the Federal Reserve. On the other hand, the DXY weakens when the Federal Reserve cuts rates, inflation rises, or investor sentiment shifts toward riskier assets and other global currencies.
In the years following the COVID-19 pandemic, the DXY saw sharp movements. It rallied strongly in 2022 as the Federal Reserve raised interest rates aggressively to combat inflation, reaching levels above 114. This was followed by a pullback as inflation cooled and expectations of rate cuts emerged in 2023 and 2024. As of August 2025, the DXY stands at approximately 93.4, reflecting a weaker dollar compared to its recent highs, influenced by a more dovish Federal Reserve, growing US debt concerns, and rising investor interest in alternative assets such as gold and other currencies.
The DXY remains a key tool for traders, economists, and policymakers to assess the dollar’s position in the global economy. Its movements affect everything from commodity prices and trade balances to emerging market capital flows and inflation pressures worldwide.

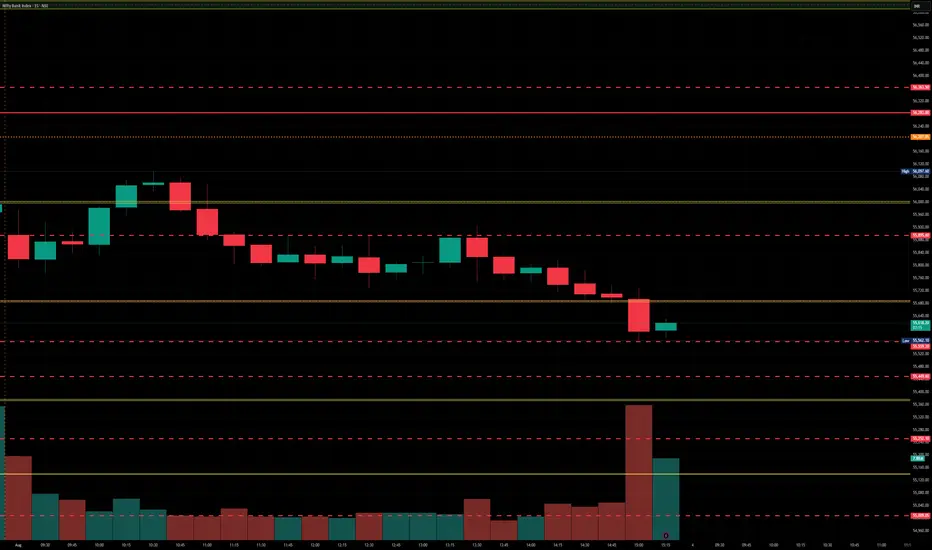
Banknifty August 1st week analysisBanknifty is looking uncertain and we can expect high volatility in banknifty in the upcoming week.If banknifty breaches 55400 on the downside then an important level to watch on downside would be 54876. On the upside if banknifty crosses and sustains above 55800-56014 then we can expect upside upto 55560-56700.
All levels are marked in the chart posted.

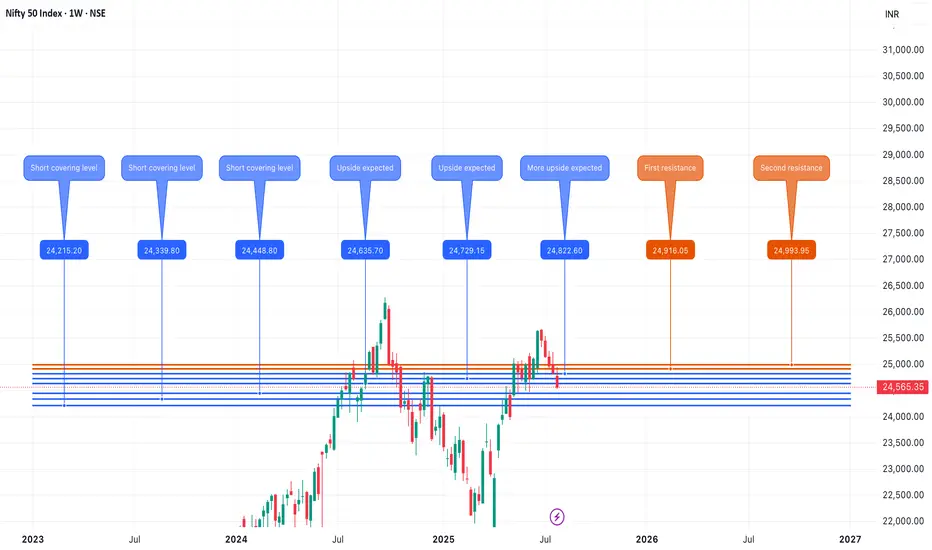
Nifty August 1st week analysisThe Nifty index looks positive for the upcoming week, despite global uncertainties and tariffs. This is a bold take, but my chart analysis supports it. The charts do not indicate a fall below 24,200 in the coming week. Three short-covering levels are marked: 24,448, 24,339, and 24,215. On the upside, a key level to watch is 24,635. If Nifty crosses and sustains above 24,635, we can expect upward momentum to continue toward 24,900–25,000. All levels are marked in the chart posted.
GER4O1. Head of the European Central Bank (ECB)
As of August 2025, Christine Lagarde is the President (head) of the European Central Bank (ECB). She is responsible for leading eurozone monetary policy, representing the ECB at global forums, and setting the tone for financial and economic policy across Europe.
2. Fundamental Drivers of the GER40 (DAX 40)
The GER40, also known as the DAX 40, is Germany's blue-chip stock market index. Its performance is driven by the following key fundamentals in 2025:
Corporate Earnings & Sector Leaders: Major companies like SAP, Siemens, Allianz, and Linde have been driving index gains, contributing a significant portion of the upward momentum due to their market capitalization.
ECB Monetary Policy: Multiple rate cuts by the ECB in 2025 supported German and eurozone equities, lowering yields and easing financing for businesses. Expectations of further rate cuts or stability are closely monitored by the market.
Inflation Dynamics: Falling inflation across the eurozone in 2025 enabled the ECB to move from a restrictive to a more accommodative stance. Latest ECB projections see inflation averaging 2% in 2025 and slightly below target in 2026, allowing monetary loosening to persist.
Energy Prices: Declining natural gas and oil prices provided relief to Germany’s energy-intensive industries, aiding profitability and supporting DAX-listed industrials.
Government Policy & Fiscal Stimulus: Increased defense and infrastructure spending by the new German government under Chancellor Friedrich Merz has boosted selective sectors, including defense (e.g., Rheinmetall).
Global and Domestic Economic Conditions: While the eurozone and German economies have shown resilience with modest GDP growth (ECB forecast: 0.9% growth for 2025), there are headwinds from trade tensions, consumer demand, and sectoral shifts (notably auto and chemicals).
Trade Policy/Geopolitics: Ongoing global trade tensions, new tariffs, and geopolitical uncertainty remain sources of risk and volatility for the index. ECB President Lagarde has repeatedly warned that “trade tariffs are a negative demand shock” and could weigh on German growth prospects.
3. Current Outlook for GER40 (August 2025)
The index gained nearly 22% so far in 2025, surpassing 24,000 and even pushing toward record highs around 24,650. AI-based and institutional forecasters project continued bullish momentum, with most calling for stability or gradual increases but noting the potential for a market correction after strong gains.
Rate cuts, lower energy prices, and corporate strength are the main drivers for the recent rally, while persistent trade risks and sectoral weaknesses remain key downside risks.
Despite economic fragility, especially in manufacturing and energy costs, the DAX/GER40 remains resilient thanks to monetary policy support and selective corporate strength.
4. Recent ECB Actions & Commentary
At the July 2025 meeting, Lagarde and the ECB Governing Council kept rates steady after several cuts earlier in the year, citing moderate growth and disinflation as justification for their stance. The ECB remains “cautiously upbeat,” expecting a 2% average inflation rate and slow but positive economic growth.
The ECB noted that further escalation of trade tensions or unexpected inflation swings could prompt new policy responses.
Summary:
The GER40 is currently driven by accommodative ECB policy under Christine Lagarde, robust earnings from key blue-chip companies, lower energy prices, and government fiscal stimulus. Risks include trade uncertainty, sector-specific downturns, and any reversal in global economic momentum. The ECB’s current president, Christine Lagarde, continues to play a central role in shaping the environment for German and eurozone equities.
WATCH MY DEMAND FLOOR
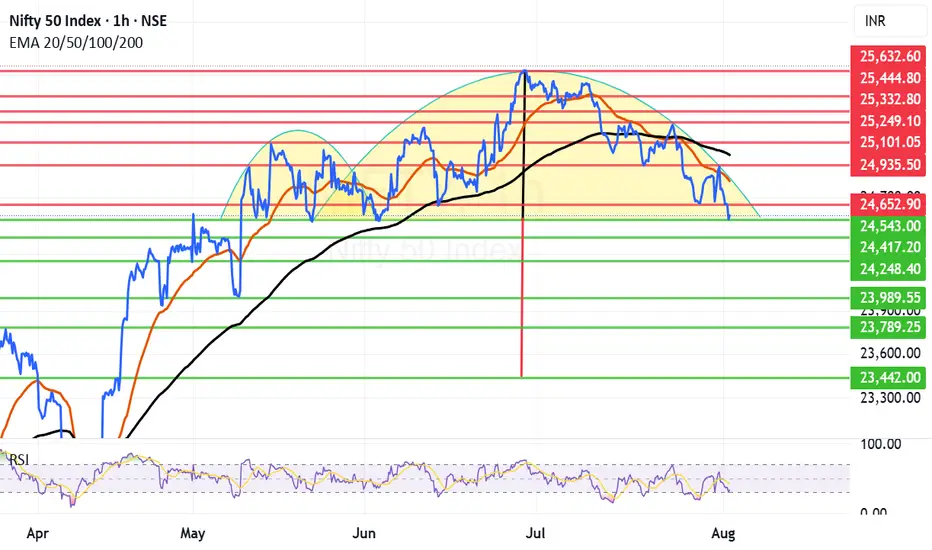
Reverse cup and Handle kind of structure formed in NiftyIn the short term time frame Nifty is seen to be forming reverse cup and handle kind of structure this is considered very bearish structure. However for this bear fest to manifest Nifty needs to close below 24543 or 24417. These 2 levels can save Nifty if not we will see it going into the bear grip.
Thus the most important supports for Nifty remain at 24543 and 24417. Below this level the supports for Nifty will be at 24248, 23989, 23789 and finally major support are is near 23442.
Important resistance areas for Nifty remain at 24652, 24821 (Mother Line Resistance), 24935, 25011 (Father Line Resistance), 25101 and finally 25249. Above 25249 Bulls can become very active.
Till the trade deal chess board and Tariffs do not relent or there is some other very important positive news Nifty will remain under pressure. Let us hope that 24253 or 24417 save us. Long term outlook on Nifty still remains positive. Long term investors should look at the tariff related event as a news that will slowly subside and give way to the Bullish outlook which has been prevailing in the market for decades all together.
Disclaimer: The above information is provided for educational purpose, analysis and paper trading only. Please don't treat this as a buy or sell recommendation for the stock or index. The Techno-Funda analysis is based on data that is more than 3 months old. Supports and Resistances are determined by historic past peaks and Valley in the chart. Many other indicators and patterns like EMA, RSI, MACD, Volumes, Fibonacci, parallel channel etc. use historic data which is 3 months or older cyclical points. There is no guarantee they will work in future as markets are highly volatile and swings in prices are also due to macro and micro factors based on actions taken by the company as well as region and global events. Equity investment is subject to risks. I or my clients or family members might have positions in the stocks that we mention in our educational posts. We will not be responsible for any Profit or loss that may occur due to any financial decision taken based on any data provided in this message. Do consult your investment advisor before taking any financial decisions. Stop losses should be an important part of any investment in equity.
NSDQ100 The Week Ahead Key Support and Resistance Levels
Resistance Level 1: 23050
Resistance Level 2: 43190
Resistance Level 3: 43430
Support Level 1: 22500
Support Level 2: 22333
Support Level 3: 22080
This communication is for informational purposes only and should not be viewed as any form of recommendation as to a particular course of action or as investment advice. It is not intended as an offer or solicitation for the purchase or sale of any financial instrument or as an official confirmation of any transaction. Opinions, estimates and assumptions expressed herein are made as of the date of this communication and are subject to change without notice. This communication has been prepared based upon information, including market prices, data and other information, believed to be reliable; however, Trade Nation does not warrant its completeness or accuracy. All market prices and market data contained in or attached to this communication are indicative and subject to change without notice.

NAS100 - The Stench of Insider Trading on Colossal Scale!!Dear Friends in Trading,
How I see it,
This is just my observation on 12HR TF.
I need Monday's Pre-NYSE data to give a more detailed analysis on smaller TF.
The BEAR signal arrived, and what a monster it is!
Keynote:
Fundamentally something was very off, specifically regarding stocks.
Even though - yes, tariff uncertainty, massively overbought technically.
It had the aroma of serious insider trading profit taking pre-NFP!
I can't help but feel it was a massive exactly timed profit grab
Stocks hardly moved on the event itself...think about it
Also, I believe the labor figures was seriously cooked!!!
I sincerely hope my point of view offers a valued insight
Thank you for taking the time study my analysis.

DowJones The Week Ahead Key Support and Resistance Levels
Resistance Level 1: 44390
Resistance Level 2: 44720
Resistance Level 3: 45100
Support Level 1: 43360
Support Level 2: 43140
Support Level 3: 42800
This communication is for informational purposes only and should not be viewed as any form of recommendation as to a particular course of action or as investment advice. It is not intended as an offer or solicitation for the purchase or sale of any financial instrument or as an official confirmation of any transaction. Opinions, estimates and assumptions expressed herein are made as of the date of this communication and are subject to change without notice. This communication has been prepared based upon information, including market prices, data and other information, believed to be reliable; however, Trade Nation does not warrant its completeness or accuracy. All market prices and market data contained in or attached to this communication are indicative and subject to change without notice.

S&P500 corrective pullback key support at 6200Key Support and Resistance Levels
Resistance Level 1: 6316
Resistance Level 2: 6374
Resistance Level 3: 6430
Support Level 1: 6200
Support Level 2: 6112
Support Level 3: 6073
This communication is for informational purposes only and should not be viewed as any form of recommendation as to a particular course of action or as investment advice. It is not intended as an offer or solicitation for the purchase or sale of any financial instrument or as an official confirmation of any transaction. Opinions, estimates and assumptions expressed herein are made as of the date of this communication and are subject to change without notice. This communication has been prepared based upon information, including market prices, data and other information, believed to be reliable; however, Trade Nation does not warrant its completeness or accuracy. All market prices and market data contained in or attached to this communication are indicative and subject to change without notice.

Dollar Index in Danger: Patterns Point to More DownsideThe dollar index (DXY) is flashing serious warning signs. In this video, I break down the technical evidence behind my bearish outlook on both the monthly and daily charts. The head and shoulders pattern we spotted did work it's way to breaking the neckline BUT the target will Not be achieved as the data on the charts have changed. On the daily charts we have a strong bearish engulfing candle, there is also an RSI divergence in the overbought zone, stochastic indicator has turn down and momentum is also following along. The downtrend on the monthly timeframe has not formed any divergence yet so I expect price to fall below the previous month's low in the coming weeks.
There will be bounces from support zones on the daily and 4 hours, these will be opportunities for good entries.
If you’re holding USD or trading around it, this is a must-watch. The signals are clear—are you prepared?
Cheers and I wish everyone a profitable trade in the coming week.

S&P 500 Daily Chart Analysis For Week of August 1, 2025Technical Analysis and Outlook:
During the trading activity of the previous week, the S&P 500 Index displayed a predominantly bearish movement after completing our Outer Index Rally target of 6420, as highlighted in the prior week’s Daily Chart Analysis, with the primary objective now being to plug our Mean Support at 6200.
It is essential to recognize that the current price movement may trigger a significant further pullback to the Mean Support level of 6090. Following this downturn, it is expected that the index will resume its upward momentum, aiming for a retest of the Outer Index Rally peak at 6420.

NIFTY50.....Miss a final sell-off! Part IIHello Traders,
the NIFTY50 is on track with my forecast! It declined over the course of the week to a level of 24565 points - a loss of almost 271 points, (nearly 1.09%).
The question is, if N50 is declining lower in the coming week. The question is, to what degree will it decline ?
Chart analysis:
Today, I'd like to show you another idea of the count. Here, at the level of 25669, a wave (v), green, has been established, and the following correction is a wave (iv), pink, to the level I have mark with the sky blue rectangle. This rectangle ranges from 24473 to 23934.90. If we reach these levels, wave (iv), whether of wave ((iv)) or wave (iv), should end!
In either case, there is more downside potential and has more room to go, and is not finished yet.
The first sign, that something went wrong would be at the point, when the high @ 23368, wave (i), green, were to be touched! This is because it is not permitted for a wave (iv) to touch the high of any degree of wave (i).
The indicators, too, have much room to decline for the rest of the week.
So, it will be exiting to watch how the market will makes its decision.
Have a great weekend.....
Ruebennase
Please ask or comment as appropriate.
Trade on this analysis at your own risk.

NASDAQ | BEARISHNASDAQ has retraced after hitting its top.A parabolic downward shift and an obvious bearish trend tend to print a LH.It may form an ABCD pattern and a sell stop order may be placed at the breakout of LL.

Nifty levels - Jul 04, 2025Nifty support and resistance levels are valuable tools for making informed trading decisions, specifically when combined with the analysis of 5-minute timeframe candlesticks and VWAP. By closely monitoring these levels and observing the price movements within this timeframe, traders can enhance the accuracy of their entry and exit points. It is important to bear in mind that support and resistance levels are not fixed, and they can change over time as market conditions evolve.
The dashed lines on the chart indicate the reaction levels, serving as additional points of significance to consider. Furthermore, take note of the response at the levels of the High, Low, and Close values from the day prior.
We hope you find this information beneficial in your trading endeavors.
* If you found the idea appealing, kindly tap the Boost icon located below the chart. We encourage you to share your thoughts and comments regarding it.
Wishing you success in your trading activities!

BankNifty levels - Jul 04, 2025Utilizing the support and resistance levels of BankNifty, along with the 5-minute timeframe candlesticks and VWAP, can enhance the precision of trade entries and exits on or near these levels. It is crucial to recognize that these levels are not static, and they undergo alterations as market dynamics evolve.
The dashed lines on the chart indicate the reaction levels, serving as additional points of significance. Furthermore, take note of the response at the levels of the High, Low, and Close values from the day prior.
We trust that this information proves valuable to you.
* If you found the idea appealing, kindly tap the Boost icon located below the chart. We encourage you to share your thoughts and comments regarding it.
Wishing you successful trading endeavors!
Learning#04 : PDH & PDL🎯 Learning#04 : PDH & PDL
- The 2 Levels Every Intraday Trader Must Watch
Turn Yesterday’s Levels into Today’s Profits – PDH/PDL Playbook
In intraday trading, simplicity often beats complexity.
You don’t always need fancy indicators, dozens of lines, or complicated systems. Sometimes, two levels are all it takes to stay in sync with the market:
👉 Previous Day’s High (PDH)
👉 Previous Day’s Low (PDL)
These levels may look basic, but they carry psychological weight and often mark where real action — and opportunity — unfolds.
Let’s break it down into a practical strategy you can start using as early as tomorrow morning 👇
🧠 What Are PDH and PDL?
PDH = The highest price the market reached yesterday
PDL = The lowest price the market reached yesterday
That’s it. No calculations. No indicators. Just two simple levels from the previous session.
But here’s why they matter:
They’re visible to everyone — retail traders, institutional desks, even algo systems. These are “memory zones” where the market often reacts — bouncing, breaking, or trapping traders in fakeouts.
Think of them as psychological boundaries.
When price approaches these levels, traders ask:
“Will it break or bounce?”
That hesitation — that moment of decision — is your opportunity.
⚡ Why These Levels Work So Well
✅ They’re objective — no subjectivity involved. Anyone can mark them.
✅ They’re reaction zones — price often stalls, breaks, or rejects here.
✅ They reflect sentiment — how price behaves around them reveals market strength or weakness.
PDH and PDL often act like turning points — or springboards for continuation. The key is in reading how price behaves when it gets there.
📊 3 Smart Ways to Trade Around PDH/PDL
Let’s look at three powerful setups based on how price behaves near these levels:
1️⃣ Rejection at PDH or PDL (Classic Reversal)
This is the simplest setup — and one of the most effective.
When price tests PDH or PDL but fails to break, it often leaves signs:
Long upper/lower wicks
Rejection candles (like pin bars or inside bars)
Sudden volume drop
💡 Example:
Nifty rallies to PDH at 22,180, prints a long upper wick, then forms a red candle closing below. That’s a reversal clue.
You could enter short below the rejection candle, with a stop just above the high and a target near VWAP or mid-range.
🎯 Why this setup works: Tight risk. Logical context. High clarity.
2️⃣ Breakout and Retest (Trend Continuation)
If price breaks through PDH/PDL with strength, don’t chase it.
Wait for price to pull back and retest the level.
If PDH was broken, wait for a bullish retest — former resistance becomes support.
If PDL was broken, wait for a bearish retest — former support becomes resistance.
💡 Example:
BankNifty breaks PDH, pulls back, then prints a bullish engulfing candle right at the level — confirmation to go long.
📌 This setup works best on trending days and offers cleaner entries than chasing breakouts.
3️⃣ The Failed Breakout (Trap Setup)
One of the most high-probability setups — and one that traps many.
Here’s how it plays out:
Price breaks PDH/PDL
But immediately snaps back inside the range
Traders who chased the breakout are now trapped
💡 Signal to watch:
A candle closes above PDH, followed by a candle that closes back below — that’s your short signal. Reverse for long setups around PDL.
🚨 Even more effective when the breakout happens on low volume — no real conviction behind the move.
🔧 Tools That Amplify These Setups
These setups work great with a clean chart — but a few tools can boost your edge:
VWAP: Check if price is extended or supported near PDH/PDL. When VWAP aligns with these levels — confluence zone!
Candlestick patterns: Look for pin bars, inside bars, or engulfing patterns at the level.
Opening range: If price breaks PDH/PDL early in the day,
especially within the first 30 minutes, it signals directional intent.
Volume: Strong breakouts need volume. Weak volume = likely fakeout.
🔑 Remember: You don’t trade the level — you trade the reaction at the level.
✅ Why This Simple Strategy Works
Don’t underestimate the power of PDH and PDL. These levels:
Show where emotions exist — greed and fear often play out here.
Create natural reaction zones — ideal spots for clean entries and exits.
Let you trade with structure, not guesswork.
Instead of chasing price all day, do this:
Mark PDH and PDL
Wait for price to approach the zone
Watch how it behaves
React with a plan — not emotion
✨ Simple, repeatable, and highly effective — if you stay patient and disciplined.
✍️ Final Thoughts
In a world full of overcomplicated strategies, PDH/PDL trading is a refreshing reminder that clarity often comes from simplicity.
These levels won’t give you 10 trades a day — but they will give you high-quality, context-driven opportunities that align with how real price and volume work.
See you in the next one — and until then:
Keep it simple. Trade with structure. Trust the levels.
— Kiran Zatakia

DXY BULLISH coming weeks Dxy is oversold, and what goes down must go up. Price did a nice retracement, setting up for next week to go higher or the week after, depending on consolidation. For me, DXY will go higher, leaving its cross pairs like EURUSD to go lower.

