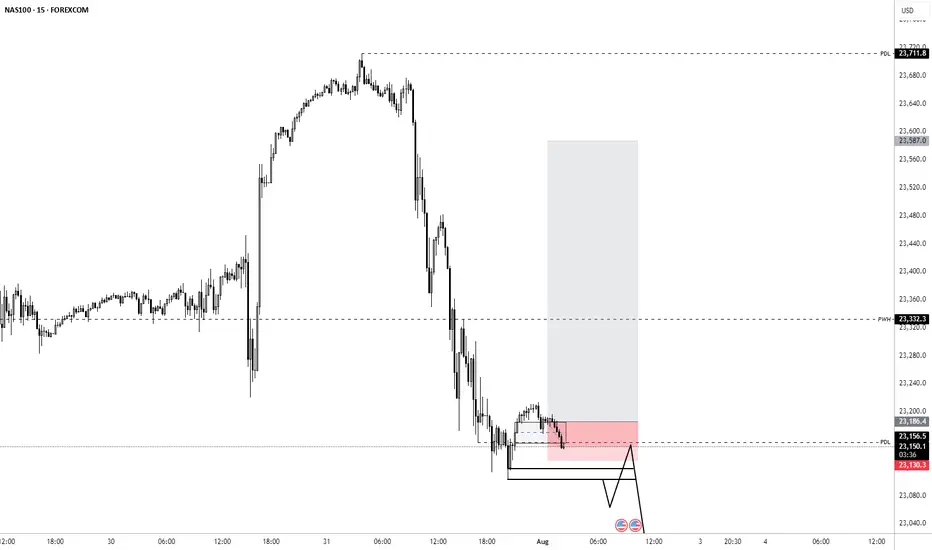
Fibonacci Retrace Strategy NAS100 Trade Idea📈 NASDAQ 100 (NAS100) is holding a strong bullish trend 🚀. After a weekend gap-up 🕳️➡️📈, price retraced back into the gap zone—exactly what you'd expect in a healthy trending market.
🔍 I'm applying my Fibonacci Expansion + Retrace Strategy 🔢, watching closely for a pullback into equilibrium ⚖️ within the previous price swing. That’s where I’ll be waiting for a bullish market structure break 🔓📊 to confirm my long bias.
🧠 Patience is key here—let the setup come to you.
📌 As always, this is not financial advice!
Market indices

SPX500 - Bearish Crab Pattern- Price completed a perfect Crab Pattern, yet we all got to August 1st (second) liberation day
- If bad mood continues, we can expect a correction:
A. (positive) down to 6150-6000
B. (negative) down to 5800
Just my humble opinion

A pullback planThe upper trendline starts from Jan 2022 peak. It was broken on normal scale but still holds on log scale. The price may top here or may go higher. In a very bullish scenario the price may bounce much higher from an upper 1W FVG, but I think it will be broken soon. In any case I see a strong support at 6050-6150 area - a horizontal support and 1M/1W FVG are there. The price should return there sooner or later. No negative daily RSI divergence at the moment, but the price can make 4% correction on 2-4h divergence, which will appear at any new ATH. I gonna hold and increase my short position with low leverage untill the price makes a pullback into this area.

Smart Liquidity in TradingIntroduction: What Is Smart Liquidity in Trading?
Liquidity is the backbone of financial markets—it refers to how easily assets can be bought or sold without causing drastic price changes. But as markets have evolved with the rise of algorithmic trading, decentralized finance (DeFi), and AI, a more sophisticated concept has emerged: Smart Liquidity.
Smart Liquidity isn’t just about having buyers and sellers in a market. It’s about efficient, dynamic, and intelligent liquidity—where technology, data, and algorithms converge to improve how trades are executed, how markets function, and how risks are managed. Whether in traditional stock markets, forex, or blockchain-based platforms, smart liquidity is now central to modern trading strategies.
Chapter 1: Understanding Traditional Liquidity
Before diving into smart liquidity, let's revisit the basics of traditional liquidity:
Bid-Ask Spread: A narrow spread indicates high liquidity; a wide one shows low liquidity.
Market Depth: The volume of orders at different price levels.
Turnover Volume: How frequently assets are traded.
Price Impact: How much a large order moves the price.
In traditional finance, liquidity providers (LPs) include:
Market makers
Banks and financial institutions
High-frequency trading firms
Exchanges
Liquidity ensures:
Stable pricing
Smooth trade execution
Lower transaction costs
Chapter 2: The Evolution Toward Smart Liquidity
What Changed?
Algorithmic Trading: Algorithms can detect, provide, or withdraw liquidity in milliseconds.
Decentralized Finance (DeFi): Smart contracts offer on-chain liquidity pools without intermediaries.
AI & Machine Learning: Predictive models can identify where liquidity is needed or likely to shift.
Smart Order Routing (SOR): Optimizes trade execution by splitting orders across multiple venues.
These technologies gave rise to “smart liquidity,” where liquidity is not static but adaptive, context-aware, and real-time optimized.
Chapter 3: Components of Smart Liquidity
1. Liquidity Intelligence
Advanced analytics track:
Market depth across exchanges
Order flow trends
Latency and slippage statistics
Arbitrage opportunities
This helps institutions dynamically manage their liquidity strategies.
2. Smart Order Routing (SOR)
SOR systems:
Automatically split large orders across venues
Route based on fees, liquidity, latency, and execution quality
Reduce market impact and slippage
SOR is key in both equity and crypto markets.
3. Algorithmic Liquidity Providers
Market-making bots adjust quotes in real-time based on:
Volatility
News sentiment
Volume spikes
Risk exposure
They enhance liquidity without manual intervention.
4. Automated Market Makers (AMMs)
Used in DeFi:
No traditional order book
Prices determined algorithmically via a liquidity pool
Traders interact with pools, not people
Popular AMMs: Uniswap, Curve, Balancer.
Chapter 4: Use Cases of Smart Liquidity
1. HFT Firms and Institutions
Use predictive liquidity models
Deploy SOR to reduce costs and slippage
Balance exposure across markets
2. Retail Traders
Benefit from tighter spreads and faster execution
Use platforms with AI-driven order matching
3. Decentralized Finance (DeFi)
Anyone can provide liquidity and earn fees
Smart liquidity enables 24/7 trading with no intermediaries
New protocols optimize capital allocation via auto-rebalancing
4. Stablecoin & Forex Markets
Smart liquidity ensures 1:1 peg stability
Algorithms prevent arbitrage imbalances
Chapter 5: Key Metrics to Measure Smart Liquidity
Metric Description
Slippage Difference between expected and actual execution price
Spread Efficiency How close bid-ask spreads are to theoretical minimum
Fill Rate How much of an order is filled without delay or rerouting
Market Impact Price movement caused by a trade
Liquidity Utilization How efficiently capital is allocated across pairs/assets
Latency Time taken from order input to execution
These metrics help evaluate the quality of liquidity provided.
Chapter 6: Risks and Challenges of Smart Liquidity
Despite its benefits, smart liquidity isn’t perfect.
1. Flash Crashes
Caused by sudden withdrawal of liquidity bots
Example: 2010 Flash Crash in U.S. equities
2. Manipulation Risks
Predatory algorithms can spoof or bait other traders
"Liquidity mirages" trick algorithms
3. Smart Contract Failures (DeFi)
Vulnerabilities in AMMs can drain entire liquidity pools
Hacks like those on Curve and Poly Network show smart liquidity can be fragile
4. Impermanent Loss (DeFi)
LPs may lose value if asset prices diverge significantly
Complex math and simulations needed to manage it
5. Regulatory Uncertainty
Especially in crypto, regulators still debating on decentralized liquidity protocols
Conclusion
Smart liquidity represents the next evolution of market infrastructure. It's not just about having capital in the market—it's about how that capital moves, adapts, and executes.
From hedge funds deploying intelligent routing systems to DeFi users earning yields through AMMs, smart liquidity touches every corner of modern finance. As technology continues to mature, expect liquidity to become even more predictive, responsive, and intelligent—unlocking a new level of speed, precision, and access for traders around the world.
UKX Trending UpUKX bullish continuation.
It could pull back to 8900 and continue with the Head and Sholder pattern on the weekly time scale with a price target of 9975.
Pattern and breakout confirmed.

23This channel is not providing individualized trading or investment advice, nor is it a banking service, brokerage service, trading service, investment service or money management service

104This channel is not providing individualized trading or investment advice, nor is it a banking service, brokerage service, trading service, investment service or money management service

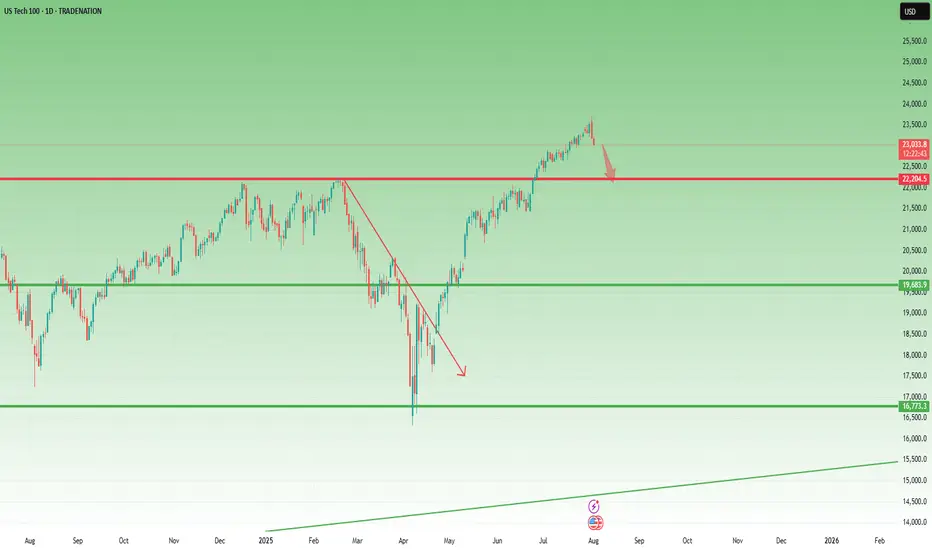
Top in Place? NASDAQ100 Signals Exhaustion After Incredible Run📈 The crazy run since April
NASDAQ100 has had a spectacular run since early April, when the index dipped to 16,300 amid rising tensions caused by Trump’s tax war. From that low, we’ve seen a mind-blowing rally of over 7,000 points, which translates to a 40% gain in just 4 months.
Such a rise is not just impressive— it’s overextended , especially by historical standards. Markets don’t move in straight lines forever, and this one might be showing signs of fatigue.
🕯️ Bearish signal at the top
Fast forward to this week: yesterday, the index marked a new all-time high at 23,700, but closed the day with a strong bearish engulfing candle — one that wipes out the gains of the previous 4 trading sessions.
This is not a small technical detail. Such candles, when appearing after an extended rally, often signal exhaustion and a potential shift in momentum.
❗ Top in place?
In my opinion, there's a high probability that a top has been set, at least temporarily. We might be looking at the beginning of a healthy correction, or even something more meaningful, depending on follow-through in the next sessions.
📉 Where to next?
The first major support to watch is the 22,200 level.
I expect that zone to be tested soon — and honestly, considering how much the index has gone up, this shouldn’t surprise anyone. It’s nothing more than a minor pullback, all things considered.
🧠 Stay smart!
When markets go vertical, it pays to stay disciplined and realistic. Tops rarely announce themselves, but when signals like this appear, it’s wise to listen.
Disclosure: I am part of TradeNation's Influencer program and receive a monthly fee for using their TradingView charts in my analyses and educational articles.
S&P500 for the rest of 2026I am not a professional and this is based on nothing more than blind speculation and feelings.
Probably wrong

SP500 → Countertrend correction before growthFX:SPX500 is correcting against an upward trend. In the second half of the week, the market received fairly positive fundamentals during the reporting period.
S&P 500 futures found support after strong reports from Meta and Microsoft, which exceeded earnings expectations and forecasts thanks to AI. The rise in futures supported demand for the “Magnificent Seven” despite Powell's hawkish comments. The focus is on Apple and Amazon reports in the evening, which could strengthen the tech rally. On Friday, we are seeing a countertrend correction in which the market is testing the 6288 zone of interest.
Support levels: 6288.4, 6262.6
Resistance levels: 6342, 6371
Most likely, the market will form a false breakout of support during the correction. If the bulls keep the index above the key level, we can expect continued growth in the short and medium term.
Best regards, R. Linda!

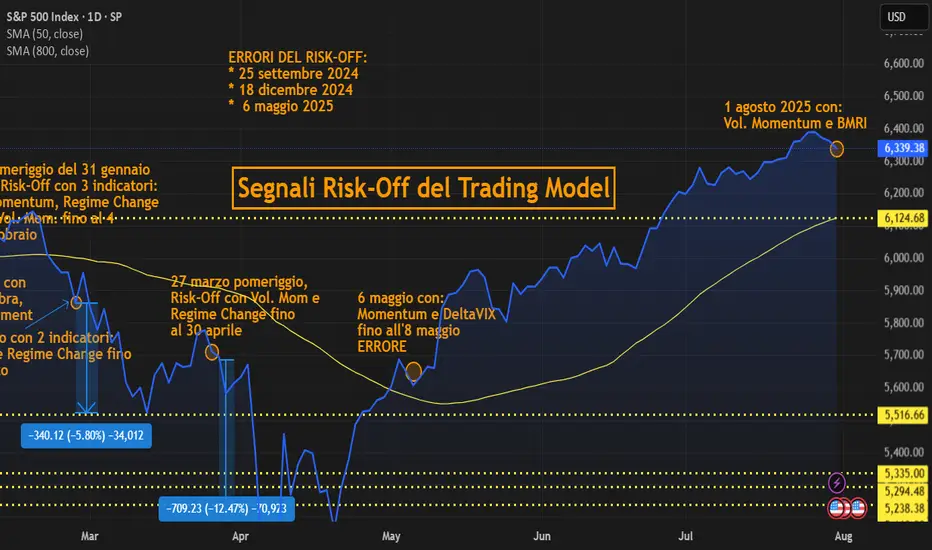
Risk-Off SignalsRisk-Off: 1 August with 2 indicators:
Voil. Momentum and Bear Market Risk Indicators (BMRI)
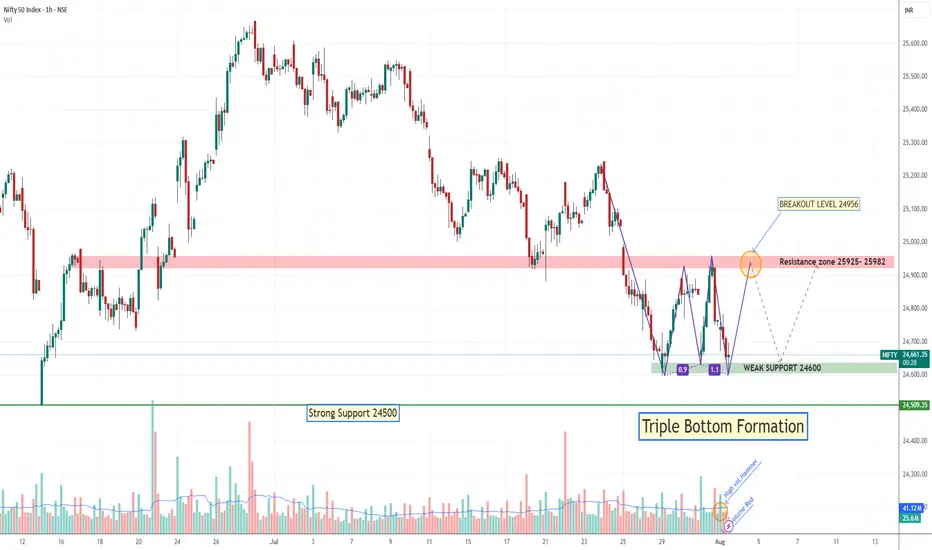
Tripple Bottom Formation if Hold 24600Nifty 3rd Time Tested 24600 level if it Break next Strong support 24500, if hold then may rallied again till 24956. May be Falling red candle is just testing candle of High-volume Hammer.
US100 Index – Potential Bearish Reversal in Key Resistance Zone🧠 US100 Index – Potential Bearish Reversal in Key Resistance Zone
Timeframe: 30-Minute | Chart Published: July 24, 2025
---
🔍 Overview
The US100 (NASDAQ) has been trading in a well-structured ascending channel, forming higher highs and higher lows. However, recent price action suggests that the index is testing a critical supply zone near 23,400, with signs of weakening bullish momentum. This may signal a potential corrective phase or bearish reversal.
---
📈 Technical Analysis Breakdown
🔵 Trend Structure:
Price is respecting a clear ascending trendline (blue), connecting multiple higher lows.
Multiple bullish flag/channel formations have been completed within the uptrend, showing healthy momentum until the current point.
🟥 Resistance Zone:
Strong supply zone marked between 23,250 – 23,450.
Price action shows stalling candles and rejection wicks within this zone, indicating buyer exhaustion.
⚠ Bearish Patterns:
The red path projection suggests a head and shoulders-like structure forming at the top of the channel.
This, along with divergence in wave strength and shrinking momentum, supports a potential reversal.
🔵 Key Support:
First support lies around 23,000 — aligning with the ascending trendline and previous consolidation.
If broken, next demand zone is around 22,835 – 22,900, where historical consolidation took place.
---
🔁 Projected Scenario (as per visual path)
1. Price may attempt one last push into the 23,400–23,450 zone (possible false breakout).
2. Rejection from this level could trigger a fall toward the ascending trendline support.
3. A confirmed break of the trendline can lead to a larger correction toward the 22,800 zone.
---
🧠 Unique Insight
This chart combines multi-timeframe structure recognition with a real-time reversal formation inside a long-standing bullish trend. The analysis doesn’t just rely on textbook patterns—it recognizes real-time price behavior shifts, which makes it valuable for proactive traders.
---
📌 Conclusion
While the trend remains bullish overall, caution is warranted as the US100 approaches a historically significant resistance zone. The setup offers a compelling risk-reward short opportunity for aggressive traders, especially if the price confirms a break below trendline support.
---
🔧 Next Steps for Viewers
> “Watch for a clean rejection candle or lower high at resistance before entering short. If trendline breaks cleanly, 22,835 could be the next target zone.”

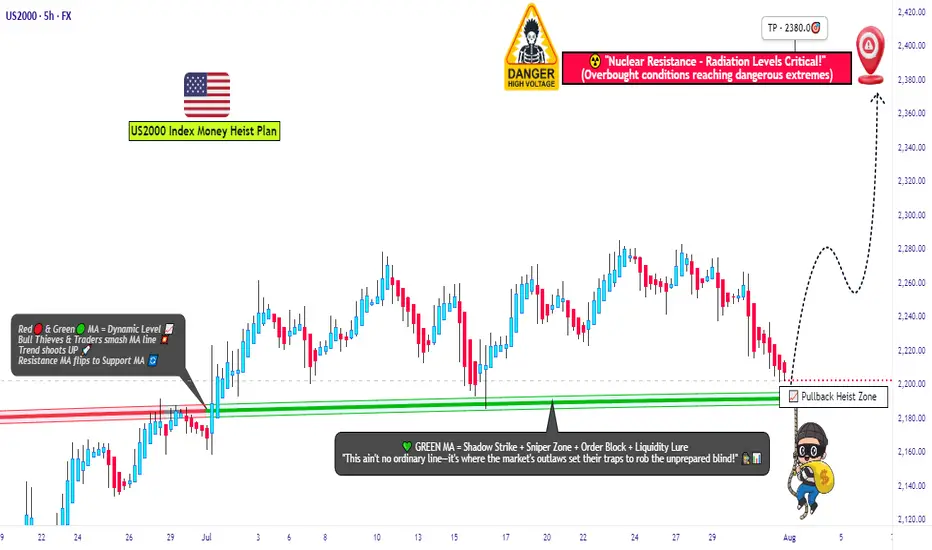
"US2000 THIEF TRADE: SWIPE & ESCAPE BEFORE BEARS!"🚨Russell 2000 Robbery: Pullback to Power Play⚡️💰
🌟Hi! Hola! Ola! Bonjour! Hallo! Marhaba!🌟
Dear Market Robbers & Money Makers, 🤑💰💸✈️
This is a full-blown heist plan on the US2000 (Russell 2000) index using the Thief Trading Style™, a perfect combo of real-time technicals + macro heat.
Get ready to swipe the bull run right after a tactical pullback — let’s rob the market clean and vanish at the high-voltage resistance level ⚡️🚨📊
📈 Entry Plan – The Vault Opens @ 2190.00
Watch for a clean pullback to the zone around 2190.00.
Place buy limit orders after confirmation from 15m or 30m candles – preferably near recent swing lows.
Smart move: Set alerts so you don’t miss the breakout trigger.
🛑 Stop Loss – Escape Hatch @ 2140.00
Use the nearest 4H candle wick or swing low as your SL level.
Thieves scale their lot size & SL based on position stacking and trade confidence.
🎯 Target – 2380.00 (Or Jump Before the Heat Gets Real)
Take profit near the heavy resistance zone. Don’t overstay — market traps ahead! Electric reversals & institutional bears wait there to flip the game ⚡🐻
👀 Scalpers’ Secret:
Only long scalps! 💣
No funds? Follow the swing robbers.
Trail your SL and let the bulls push your bags up.
🧠 What’s Fueling This Bullish Ride?
US2000 is surging with:
• Risk appetite from macro sentiment
• COT data aligning bullish
• Intermarket signals syncing up
• Rotational flows into small-cap strength
⚠️ Thief Trading Alerts – News Impact Zone Incoming!
• Don’t enter fresh trades during red news.
• Use trailing SLs to guard floating profits.
Market spikes are good — if you’re prepared.
💣💥This isn’t just a trade – it’s a mission.
Rob smart, trail hard, and cash out sharp.
📦💼Every move is calculated. Every entry is a chance.
🚀Stay sharp, robbers – next heist plan drops soon! 💼🔐📈
🏆Trade like a thief, win like a boss.
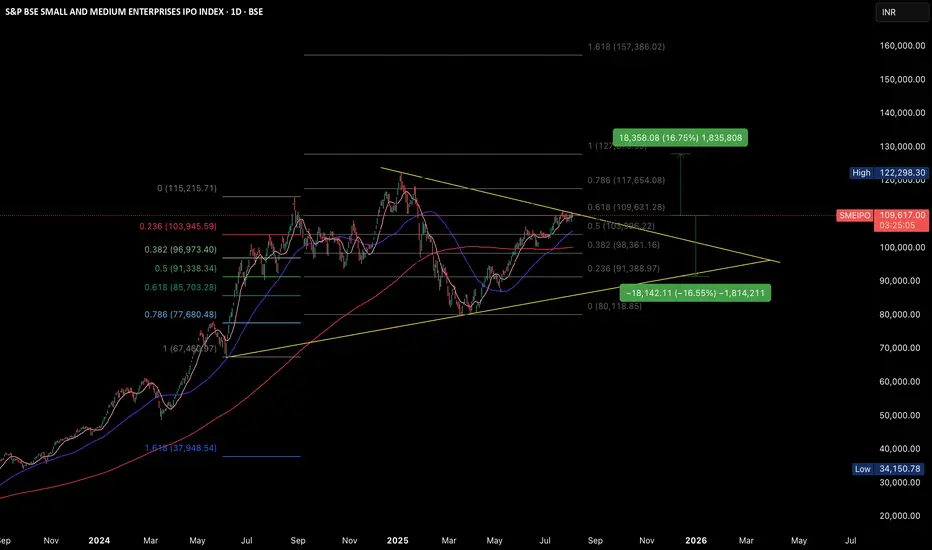
sme ipo make or break position ,be cautious
⸻
🔍 Chart Setup Overview
• Pattern: Symmetrical Triangle (consolidation zone — make-or-break pattern).
• Current Price: ₹109,635 (right at Fibonacci 0.618 level).
• Moving Averages: Clustered, indicating indecision.
• Key Levels (Fibonacci & Triangle) clearly suggest a breakout/breakdown zone.
⸻
📉 Downside Possibility (~60%)
📉 Upside Possibility (~40%)
Based on chart structure and current position near triangle resistance, downside has a higher probability unless a breakout happens soon.
✅ Targets:
1. 1st Downside Target: ₹91,388
• Corresponds to 0.236 Fibonacci level of the entire upmove.
• Drop of ~16.6% → ✔️ Your level is accurate.
2. 2nd Downside Target: ₹85,703
• 0.618 Retracement from the broader previous upmove.
• Drop of ~21.8% → ✔️ Your second target is also valid.
📌 Break below the triangle support would likely trigger both targets.
⸻
📈 Upside Possibility
If it breaks above the triangle resistance, the structure has good momentum potential:
✅ Upside Target:
• ₹127,873 (1.0 Fibonacci extension of previous top)
• Gain of ~16.7% → ✔️ Your upside target is correct.
🚩 But breakout must be confirmed with volume, else it’s a false breakout risk.
⸻
🔺 Conclusion: You are right.
• The risk-reward ratio slightly favors the downside unless there’s a convincing breakout.
• The 60% downside probability estimate is reasonable based on chart pattern, resistance levels, and trend weakening.
Trend Exhaustion Detected – Bearish Structure AheadUS100 (NASDAQ) 30-minute chart as of July 26, 2025, with technical insights based on the visible elements.
🔍 1. Trend Analysis
Primary Trend: Uptrend (bullish structure)
The price has been respecting a rising parallel channel, marked by:
Ascending support (lower boundary)
Ascending resistance (upper boundary)
Market structure shows:
Higher Highs (HH)
Higher Lows (HL)
✅ This indicates continuation of bullish momentum until structure breaks.
📐 2. Market Structure Elements
Structure Type Label on Chart Price Zone (approx.)
Break of Structure (BOS) BOS (center-left) ~22,950
Higher Low (HL) HL (2x) ~22,700 (1st), ~23,050 (2nd)
Higher High (HH) HH (2x) ~23,150 and ~23,300
Resistance Labelled ~23,300–23,320
Demand Zones Labelled ~22,450–22,700
🔁 Break of Structure (BOS)
The BOS occurred after a prior swing low was broken, followed by a new higher high, confirming a bullish shift.
🧱 3. Support / Resistance Analysis
🔼 Resistance Zone
The price is testing strong resistance around 23,300–23,320
Multiple rejections in this area
Trendline resistance also aligns here
A rejection arrow is drawn, indicating potential bearish reaction
🔽 Support Zone (Immediate)
23,180–23,220: highlighted green box is a local support block
If broken, likely to revisit 23,000–23,050, or even down to 22,900 range
🟩 4. Demand Zones
Zone 1:
22,450–22,600: Strong bullish reaction historically — likely to act as a key demand if a deeper pullback occurs
Zone 2:
22,850–22,950: Validated with prior accumulation & BOS event
🧠 5. Key Observations
Price is at a critical inflection zone:
Testing a resistance zone
At the upper trendline of an ascending channel
A bearish reaction is projected (black arrow)
Possibly targeting the green support zone around 23,180–23,220
If that fails, demand at ~23,000 will likely be tested
Ichimoku Cloud:
Currently price is above the cloud → still bullish
Cloud is thin → potential weakness or upcoming consolidation
⚠️ 6. Trading Bias & Setup Ideas
✅ Bullish Bias (if price holds above ~23,180)
Long entries can be considered on bullish reaction from support
Target: retest of 23,300–23,350 or even breakout continuation
❌ Bearish Bias (if breakdown below support)
Short entry valid below 23,180 with:
TP1: 23,050
TP2: 22,900
A breakdown from the ascending channel would signal trend exhaustion
🔚 Conclusion
Current Price: 23,298.4
Trend: Bullish, but at resistance
Next move: Watch for reaction at resistance and support box below
Bias: Neutral-to-bullish unless the structure breaks below ~23,180


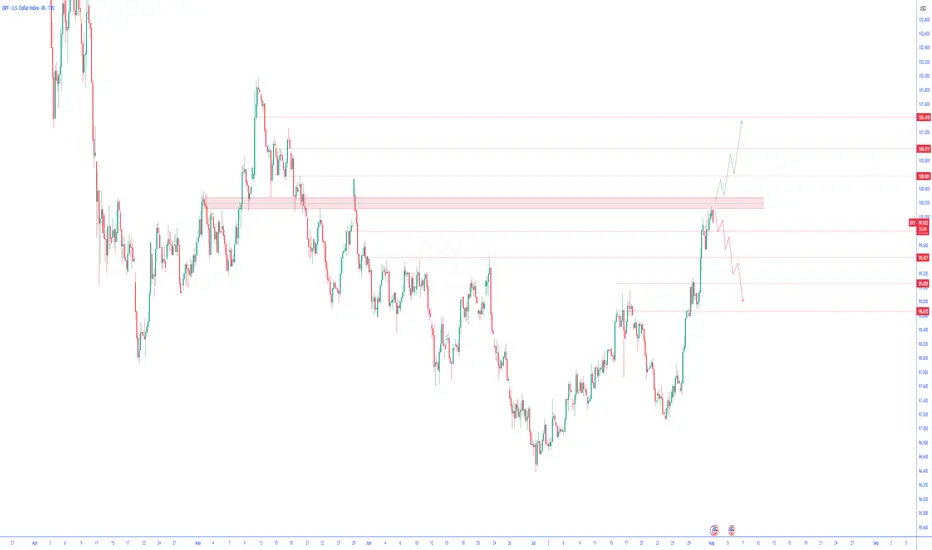
U.S. Dollar Index (DXY) Technical Analysis – 4-Hour TimeframeU.S. Dollar Index (DXY) Technical Analysis – 4-Hour Timeframe
Following yesterday’s economic data from the United States, which included stronger-than-expected GDP growth and consumer confidence figures, the U.S. Dollar Index (DXY) has continued its upward trend with strength. These developments have reinforced expectations for continued monetary tightening—or at least keeping interest rates elevated—which in turn has boosted demand for the dollar.
On the 4-hour chart, after a strong bullish rally, the dollar index has now reached a key resistance zone that previously acted as a major barrier.
Bullish Scenario:
If the current resistance zone is decisively broken and price stabilizes above it, the bullish momentum could extend further toward higher technical levels. This scenario would gain additional strength if upcoming economic data continues to support the dollar.
Bearish Scenario:
However, if the price fails to break through the resistance and signs of buyer weakness begin to emerge, a corrective pullback toward previous support levels may occur. This scenario could be further intensified if weaker economic data is released or if the Federal Reserve signals a more dovish stance.
At the moment, traders are advised to closely monitor the price reaction to the current zone and wait for confirmation before committing to the next move.
NextGenTraders81: My buy and sell limit ideas for NFPI have set these limits for todays NFP, it might go completely wrong but as im only risking 0.5% on each limit, it should be fun.
Buy limit is at the bottom of the channel, where price is bound to make some reaction, the TP is bellow where i believe it would go up to before continuing the downtrend..
The sell limit is where i believe a LH would be made.
Lets have some fun,
Good luck!
NextGenTraders group

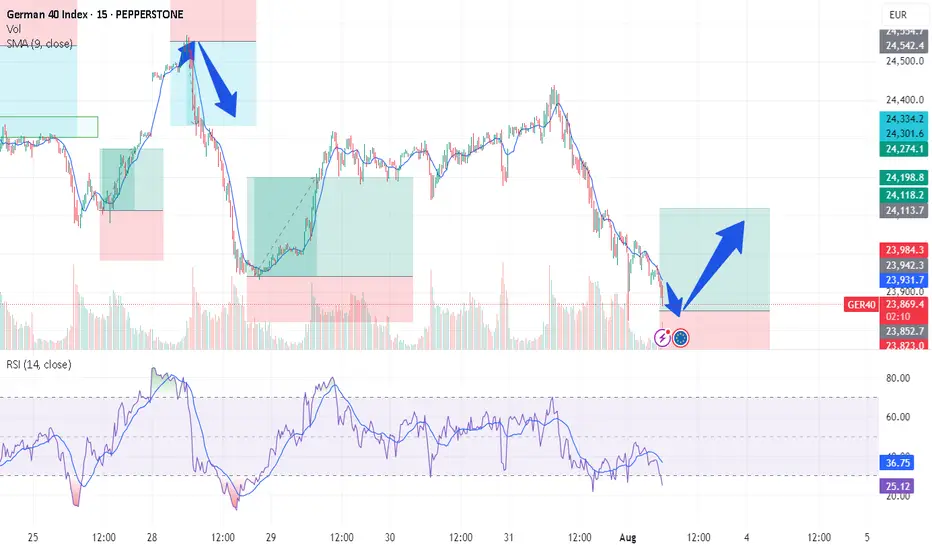
GER/DAX - TIME FOR RECOVERTeam, this morning, the DAX target hit our target 1, we took some profit, we set a stop loss at BE, and it got stopped out
Time for us to re-enter the DAX again at 23880-23855
STOP loss 23780
Once the price move at 23950 - bring STOP LOSS TO BE
Target 1 at 23985-24015
Target 2 at 24065-24096
lets go

$SPX Analysis, Key Levels & TargetsThis is how last night’s members chart played out and it was amazing. We opened at the top of the implied move and all of the spreads at the top paid as we dropped back to the 30in 200MA
The spreads I took at 6420/6435 but every spread shown here would have done well.
