NAS - TIME FOR JUICYTeam, hope you all making a killing on SHORT tonight.
as we expected. Thank you for asking and be patience
TIME TO MAKE NAS100 GREAT AGAIN.
Sorry my entry was 23240, but now the market is 23332
you should entry small volume at the current price 23332 - if a little pull back below 23300 add more
STOP LOSS at 23230-50
TARGET 1 at 23385-23400
TARGET 2 at 23475-23515
LETS go - time to make ACTIVE TRADER ROOM GREAT AGAIN.!
Market indices

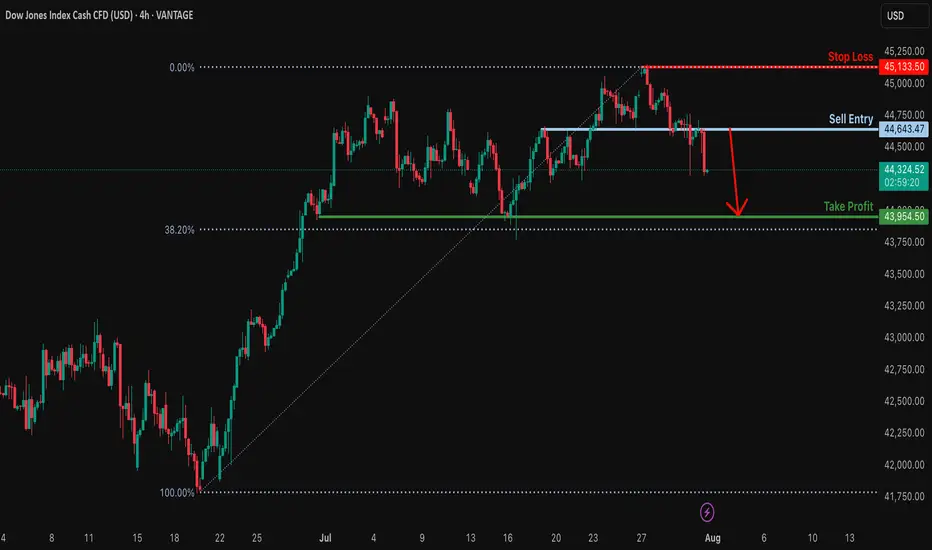
Potential bearish drop?Dow Jones (DJ30) has reacted off the resistance level which is an overlap resitance and could drop from this levle ot our takeprofit.
Entry: 44,643.47
Why we like it:
There is an overlap resistance levle.
Stop loss: 45,133.50
Why we like it:
There is a swing high resistance.
Take profit: 43,954.50
Why we like it:
There is a multi swing low support.
Enjoying your TradingView experience? Review us!
Please be advised that the information presented on TradingView is provided to Vantage (‘Vantage Global Limited’, ‘we’) by a third-party provider (‘Everest Fortune Group’). Please be reminded that you are solely responsible for the trading decisions on your account. There is a very high degree of risk involved in trading. Any information and/or content is intended entirely for research, educational and informational purposes only and does not constitute investment or consultation advice or investment strategy. The information is not tailored to the investment needs of any specific person and therefore does not involve a consideration of any of the investment objectives, financial situation or needs of any viewer that may receive it. Kindly also note that past performance is not a reliable indicator of future results. Actual results may differ materially from those anticipated in forward-looking or past performance statements. We assume no liability as to the accuracy or completeness of any of the information and/or content provided herein and the Company cannot be held responsible for any omission, mistake nor for any loss or damage including without limitation to any loss of profit which may arise from reliance on any information supplied by Everest Fortune Group.
Nifty 50 analysis I have done my nifty analysis as we enter august month expiry. July has been a volatile month with 5 week and corporate results.

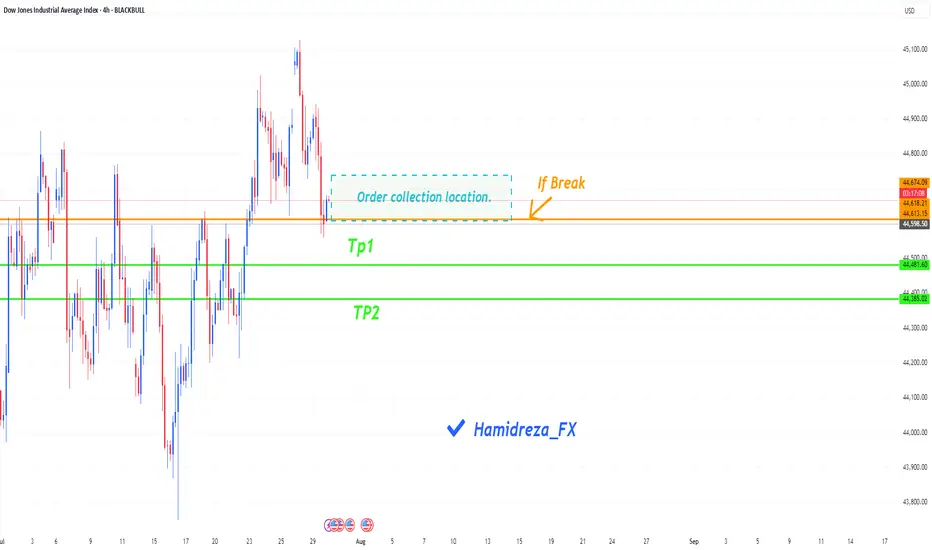
Will the Dow Jones continue its correction?
Hi everyone
The indicator may continue to correct itself by breaking the condition written in the figure (with an orange line). There is a blue box on the figure that shows the place where orders are collected. It is possible that buy orders will be placed in this area and then the downward trend will begin.
What percentage of the probability do you think there is of reaching the specified targets?
Be sure to follow me because you can make good profits from the market.
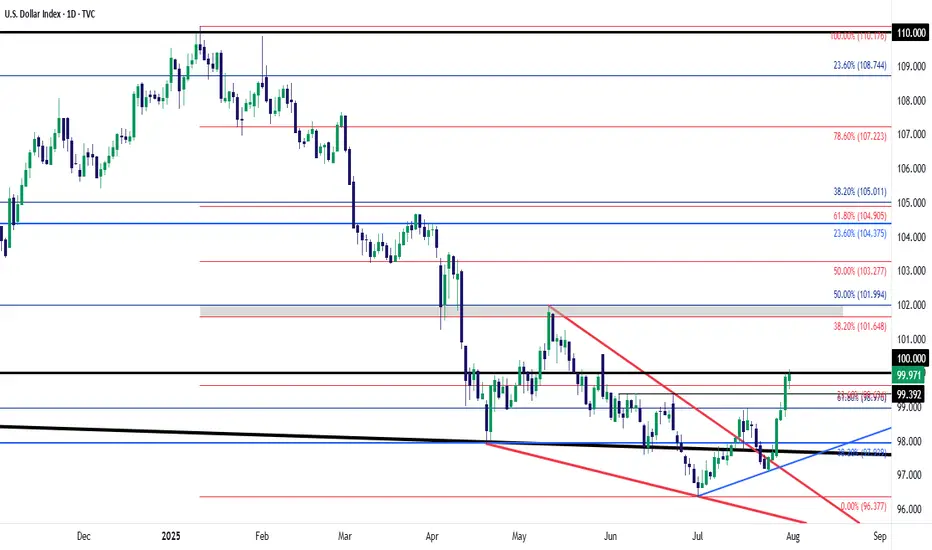
USD Working Strongest Month Since April 2022After a decisive sell-off ran for most of the first-half of the year, USD bulls have stepped up in July and DXY is currently up 3.3% for the month.
That's the strongest monthly outing in the currency since April of 2022- and that's just after the Fed had started their rate hike campaign that year. It led into a massive rally that ran through September as the USD set fresh 20-year highs.
The question now is one of continuation, and motive seems to be fairly clear. I've outlined the technical backdrop as this shift has taken place over the past month, as the Dollar held a higher-low last week and that drove into a higher-high this week.
There's likely some short squeezing contributing to the rally but with U.S. data remaining strong, and inflation on the way back up, the rate cuts that markets had priced-in back in March and April for 2025 are now in question.
This brings attention to the next major item - with Non-farm Payrolls tomorrow morning.
On a short-term basis the USD move has already started to show overbought conditions on the four-hour chart, and daily RSI is getting close to the 70-level. So perhaps ideal would be a soft report tomorrow at which point a pullback could show. It's from that that we can see whether bulls will come in to defend higher-lows, and there's now support potential at prior resistance of 99.40 in DXY.
If we do see a strong report, the 100 level is the spot for bulls to reckon with and at that point, we may be looking at an overbought RSI scenario on the daily chart - which doesn't necessarily preclude bullish continuation although it will make it more difficult to chase topside breakouts. - js
Review and plan for 1st August 2025Nifty future and banknifty future analysis and intraday plan.
Quarterly results.
This video is for information/education purpose only. you are 100% responsible for any actions you take by reading/viewing this post.
please consult your financial advisor before taking any action.
----Vinaykumar hiremath, CMT

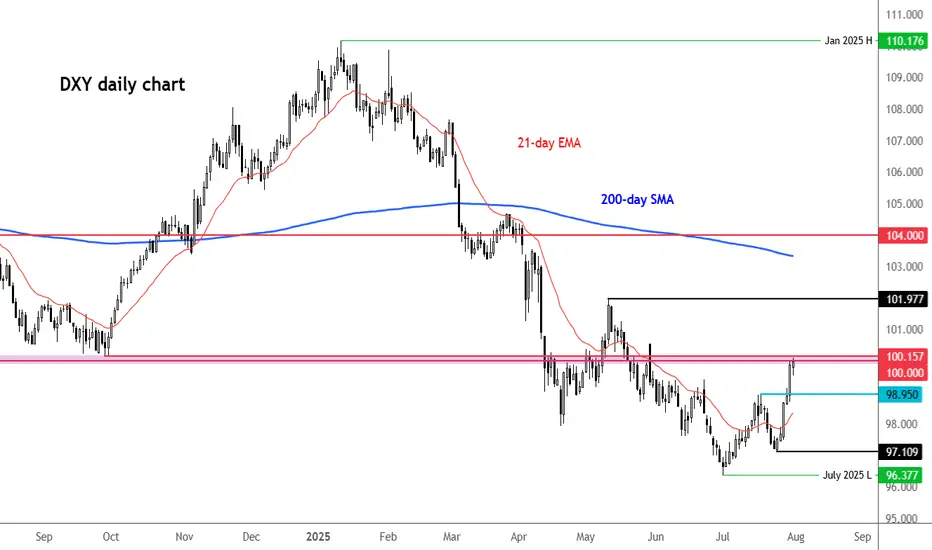
DXY testing 100.00 resistanceThe US dollar index has risen to rest a key resistance area around the 100.00 level. Previously a key support and resistance zone, what happens here could determine the near-term technical direction for the US dollar.
Key support below this zone is at 98.95, marking a prior resistance. Given the short-term bullish price structure, I would expect this level to hold if the greenback were to ease back from here.
If the bullish momentum gathers pace, then 101.00 could be the next stop, followed by the recent high of 101.97.
From a macro point of view, resilient economic data and persistent core inflation concerns continue to support the Federal Reserve’s cautious policy approach. Today’s core PCE inflation reading came in slightly above forecast, at 2.8% year-over-year versus the expected 2.7%. In addition, jobless claims were better than anticipated, registering 218,000 compared to the 224,000 forecast. The Q2 Employment Cost Index also surprised to the upside, rising 0.9% quarter-on-quarter.
These figures follow yesterday’s stronger-than-expected GDP report and a solid ADP private payrolls release, further underscoring the strength of the U.S. economy.
Attention now turns to Friday’s nonfarm payrolls report, which could have a meaningful impact on rate expectations. Fed Chair Jerome Powell has emphasized the importance of the unemployment rate as a key metric, so any upside surprise could reinforce the Fed’s current position.
However, expectations are not very high for the non-farm payrolls report. Current forecasts suggest an increase of 106,000 jobs, with average weekly earnings rising 0.3% month-over-month, and the unemployment rate edging up to 4.2%. Yet, the scarcity of strong leading indicators this month adds a layer of uncertainty to the outlook.
By Fawad Razaqzada, market analyst with FOREX.com
In addition to previous positional trade with targetThis are no buy sell recommendation but sharing for learning purpose only.
DXY Just Broke Resistance – Is This the Start of a Dollar Rally?As per our analysis, DXY has successfully broken above the primary and secondary resistance line.
If the price manages to close above the marked resistance zone, we could see further upside momentum ahead.

#NIFTY August 1st view#NIFTY August 1 st View : NSE:NIFTY Currently doing wave 3, and around buying zone, lets add up Nifty future and Nse Stocks for fresh high from Aprils low

Bullish on The US Dollar Currently short term bullish on the dollar until it gets to the orange box. A retracement lower to accelerate the move higher is permitted. Let's see how this unfolds in the coming weeks

Trend Lines AnalysisThe current target is 22143 and after small correction the price will continue towards 24023 target and will proceed further towards 25000 level. If the price fail to break 22143 and price fall sharply from that level then expect it to fall back to 19800 price level where is the yearly pivot point lying.

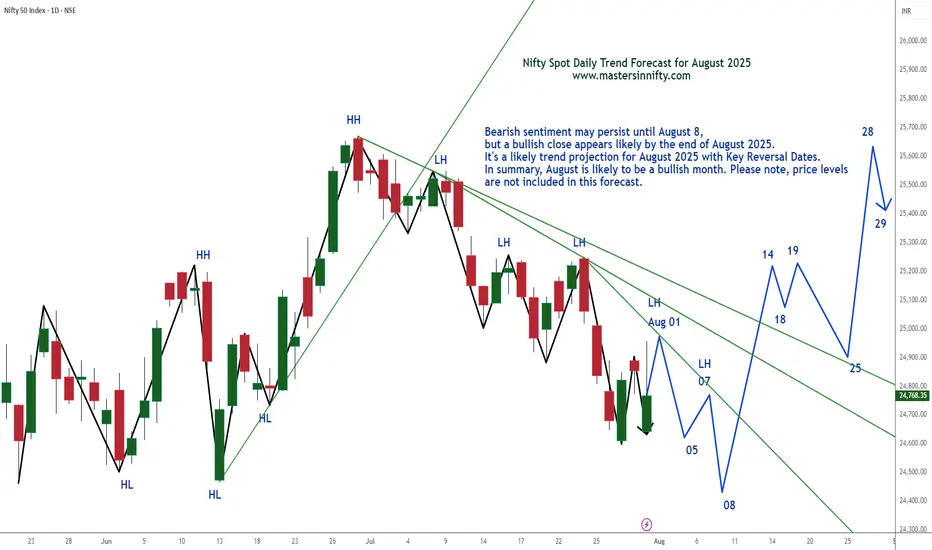
Nifty Spot Index Projection Line for August 2025Bearish sentiment may persist until August 8, but a bullish close appears likely by the end of August 2025.
It's a likely trend projection for August 2025 with Key Reversal Dates. In summary, August is likely to be a bullish month. Please note, price levels are not included in this forecast.
Traders are suggested to conduct own technical studies before entering into the trades and proper risk management is a must.
This is just my personal view.
Best of Luck & Happy Trading.
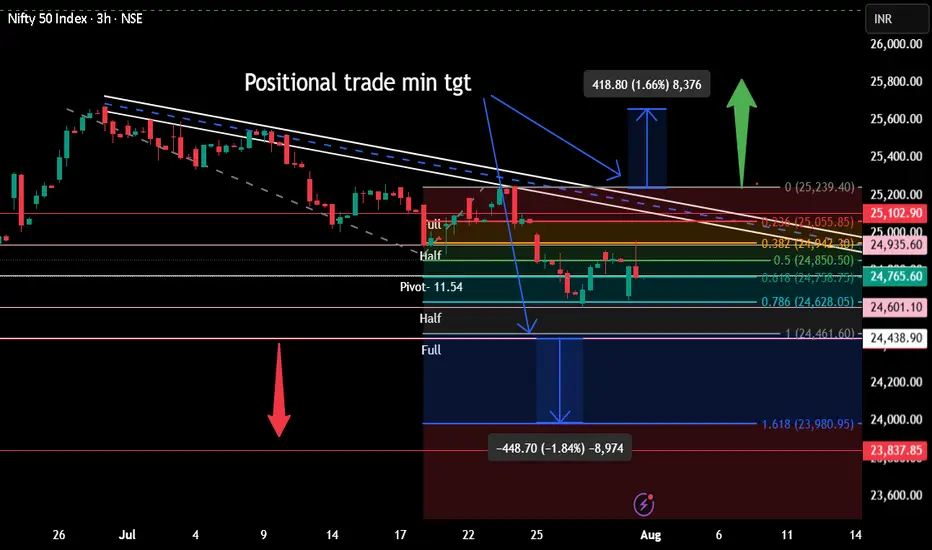
Positional tradeAt present market is for scalper/intraday trader. Positional trade to be done only once,
1. 24438 is crossed on day closing basis. Bearish view
2. 25102 is crossed on day closing basis. Bullish view
Pivot- Half-Full are weekly range and applicable only till 7th August.
Vertical lines are important times for intraday as buyer

NIFTY UPDATE The volume profile on Nifty indicates that up moves will not be smooth, we need some base formation before any meaningful momentum returns to the market. Keep tracking the minor and major pivots marked. This is what I will be tracking to take profits.

SPX defying gravity!It's a BULL market until it's not! Some how some way the markets will set new ATHs? I don't know how or why every macro economic indicator is yelling recession or worse but the chart tells me a different story. Bulls ball.....

Here is WHY SP500 WILL SINK and you should SELL!I already made a techincal analysis on SP500 last week. Here i am again trying to warn you. I have a big convinction that SP500 will sink, and pretty hard. Lot of techincal indicator are showing weakness on the daily timeframe (RSI, MACD, AO, OBV), the political situation is getting complicated day by day, and our frind Powell will proably help to start this big moves soon. Checking the seasonality, it's also clear that a drop like that isn't new, and SP500 is following perfectly the average of previous years, and if history is going to repeat (and usually happens) we will see an exit liquidity from the markets in coming days. If you don't want to go short, at least consider to keep in safe your profits with the longs.
What do you guys think about SP500? Are you bullish on it? Let me know in the commnts, i will be happy to read your ideas!

SPX500 AnalysisThis analysis is based on the 4-Hour timeframe, reversal trading, and trend formation.
If the price breaks below the white line (H&S breakout point) and closes, then my H&S pattern is complete, and I will short on its retest. I will post updates about this trade soon!

SPX500 Buy analysis/ideaThis trade is based on the 4-hour chart and executed using reversal trading, trend formation and an update on the analysis I posted on this instrument yesterday.
Complete explanation in the video!

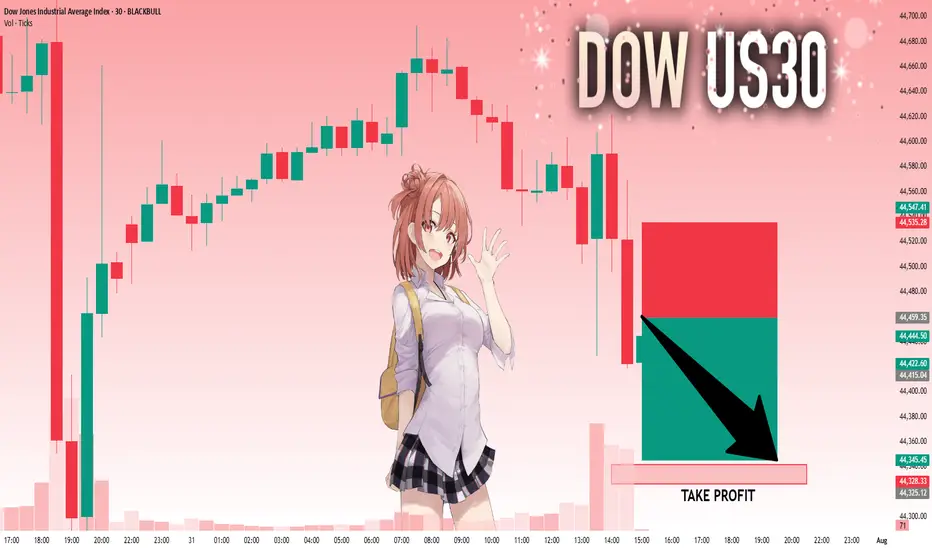
US30: Absolute Price Collapse Ahead! Short!
My dear friends,
Today we will analyse US30 together☺️
The in-trend continuation seems likely as the current long-term trend appears to be strong, and price is holding below a key level of 44,459.35 So a bearish continuation seems plausible, targeting the next low. We should enter on confirmation, and place a stop-loss beyond the recent swing level.
❤️Sending you lots of Love and Hugs❤️
Dollar Index (DXY): Will It Rise More?!
Dollar Index is on its way to 100.4 resistance.
A breakout of a major supply cluster on a daily after FED meeting
yesterday indicates a strong bullish pressure.
I think that growth will continue soon.
❤️Please, support my work with like, thank you!❤️

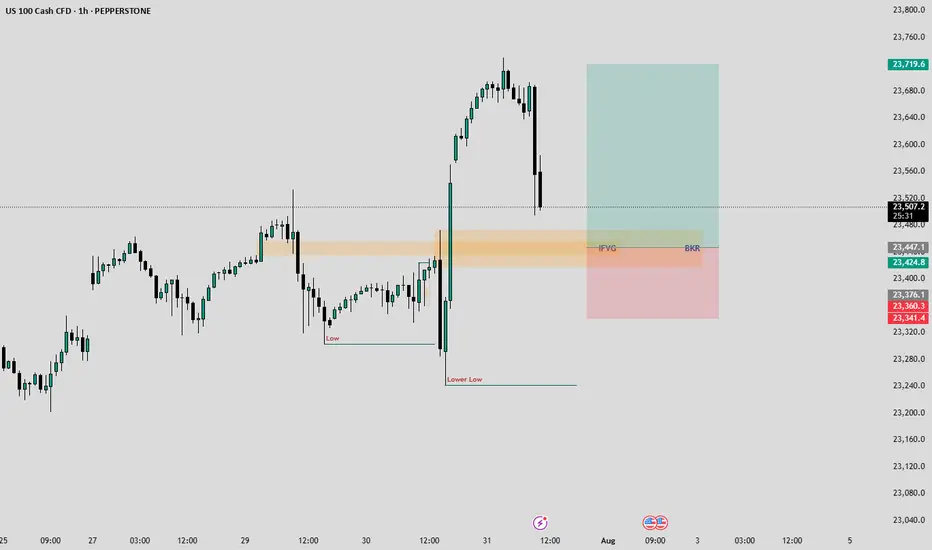
NASDAQ-Lets catch 250 Points togetherHello Fellow Traders,
Nasdaq has been wild since a time now. Today, I have spotted a rade to share with my fellow traders.
Yesterday closed with a good bullish candle. As the NY seesion has begun now, I am anticipating price to retrace to the highlighted breaker block that accurately aligns with an IFVG as well.
I am waiting for the price to fall into my area where I will monitor price's reaction, if we see signs of ejection from the highlighted areas, I wuld love to take a Buy Trade.
Entry= If rice enters the Breaker and IFVG and shows a good rejection.
SL= 23340
TP= Today's highs or 23700.
Manage your risk according toyour capital and only enter the trade if we happen to see a good rejection from the area. Be patient and don't hurry.
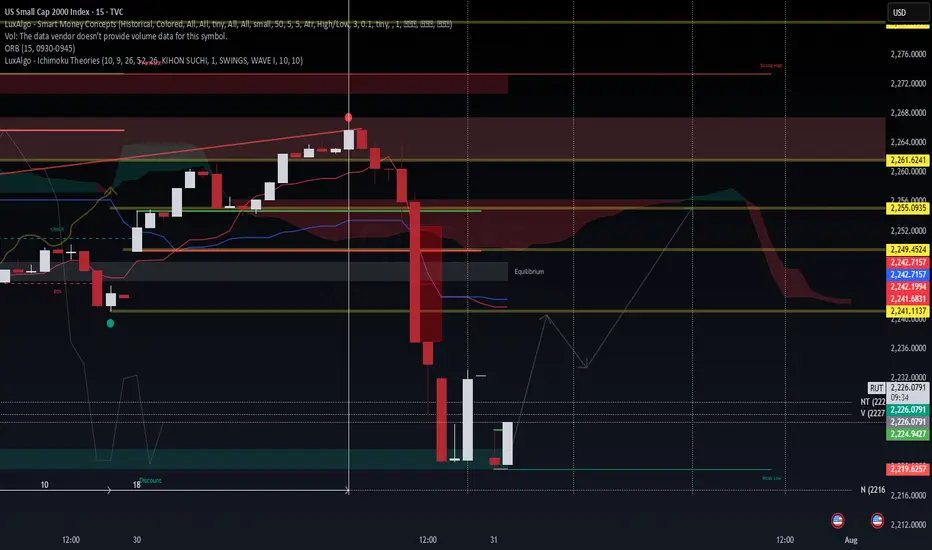
$RUT 15m – Liquidity Sweep + Discount Zone Reaction📉 TVC:RUT 15m – Liquidity Sweep + Discount Zone Reaction
WaverVanir DSS | July 31, 2025
The Russell 2000 just executed a sharp breakdown beneath equilibrium, tapping into our predefined discount zone and weak low near 2,219.62.
🧠 Smart Money Concepts Observed:
BOS (Break of Structure) confirmed → bearish control
Liquidity sweep through prior lows with wick rejection
Rejection forming inside key discount zone = potential demand reaction
Equilibrium now serves as upside magnet (reversion target: ~2,242–2,249)
🔮 VolanX Protocol Forecast:
Scenario A:
Price bounces off 2,219–2,221 zone, retests 2,242.71, and rejects at VWAP/Ichimoku cloud.
Scenario B:
Clean reclaim of 2,242 zone triggers reversion toward 2,255–2,261, but that requires volume conviction.
🚫 Invalidation: Acceptance below 2,219.62 = expansion lower toward 2,212.
⚠️ No volume data on this chart — trade with confirmation from correlated ETFs (IWM) or futures (RTY).
🛡️ VolanX DSS signal only. For educational purposes. Not financial advice.
#SMC #RUT #Russell2000 #SmartMoney #VolanX #WaverVanir #LiquidityHunt #OptionsFlow #MacroTech