S&P500 (CASH500) SHORT - Double top H6Risk/reward = 3.7
Entry price = 6432.6
Stop loss price = 6 454.1
Take profit level 1 (50%) = 6367.7
Take profit level 2 (50%) = 6332.6
Still need confirmation from some variables before entering the trade
Market indices
Nifty levels - Aug 01, 2025Nifty support and resistance levels are valuable tools for making informed trading decisions, specifically when combined with the analysis of 5-minute timeframe candlesticks and VWAP. By closely monitoring these levels and observing the price movements within this timeframe, traders can enhance the accuracy of their entry and exit points. It is important to bear in mind that support and resistance levels are not fixed, and they can change over time as market conditions evolve.
The dashed lines on the chart indicate the reaction levels, serving as additional points of significance to consider. Furthermore, take note of the response at the levels of the High, Low, and Close values from the day prior.
We hope you find this information beneficial in your trading endeavors.
* If you found the idea appealing, kindly tap the Boost icon located below the chart. We encourage you to share your thoughts and comments regarding it.
Wishing you success in your trading activities!

BankNifty levels - Aug 01, 2025Utilizing the support and resistance levels of BankNifty, along with the 5-minute timeframe candlesticks and VWAP, can enhance the precision of trade entries and exits on or near these levels. It is crucial to recognize that these levels are not static, and they undergo alterations as market dynamics evolve.
The dashed lines on the chart indicate the reaction levels, serving as additional points of significance. Furthermore, take note of the response at the levels of the High, Low, and Close values from the day prior.
We trust that this information proves valuable to you.
* If you found the idea appealing, kindly tap the Boost icon located below the chart. We encourage you to share your thoughts and comments regarding it.
Wishing you successful trading endeavors!

FOMC rate decision 30-07-2025FOMC announced no change to interest rate, but the new tariffs is the major player for the upcoming quarter, we shall see its effect on the economy and corporates earnings soon, then the fed can make better judgment whether to lower interest rate or not.
Disclaimer: This content is NOT a financial advise, it is for educational purpose only.

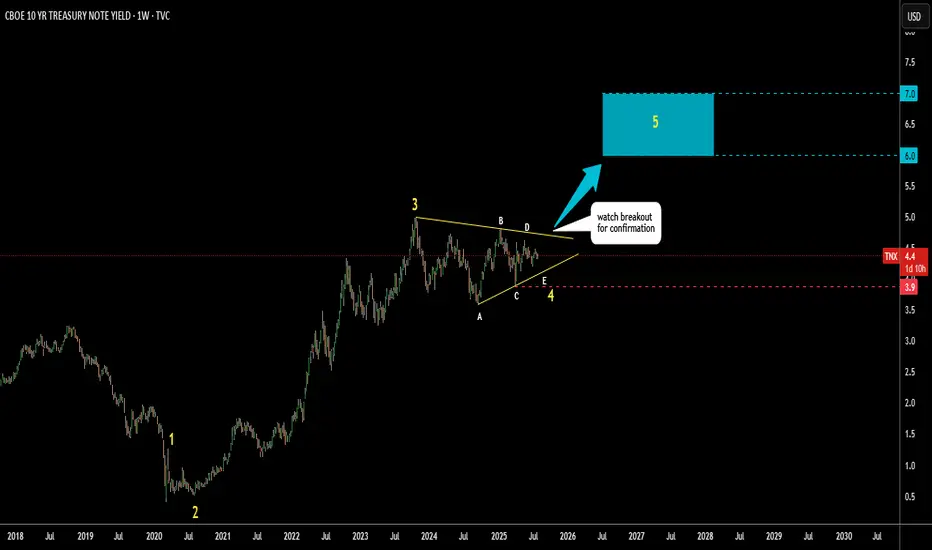
US 10Y yield: Triangular Consolidation, next 6-7%I’ve spotted a well-known triangular pattern forming on the US 10-year Treasury yield.
This appears to be the development of a large Wave 4.
Wave E of Wave 4 may still be unfolding.
Watch to see if it holds above the Wave C low at 3.9%.
A breakout above resistance near 4.7% would confirm the pattern.
The target zone is set between the 38.2% and 61.8% retracement levels of Waves 1 to 3,
highlighted with a blue box between 6% and 7%.
Could tariffs cause a major spike in yields—or will something else trigger it?
Share your thoughts in the comments below.
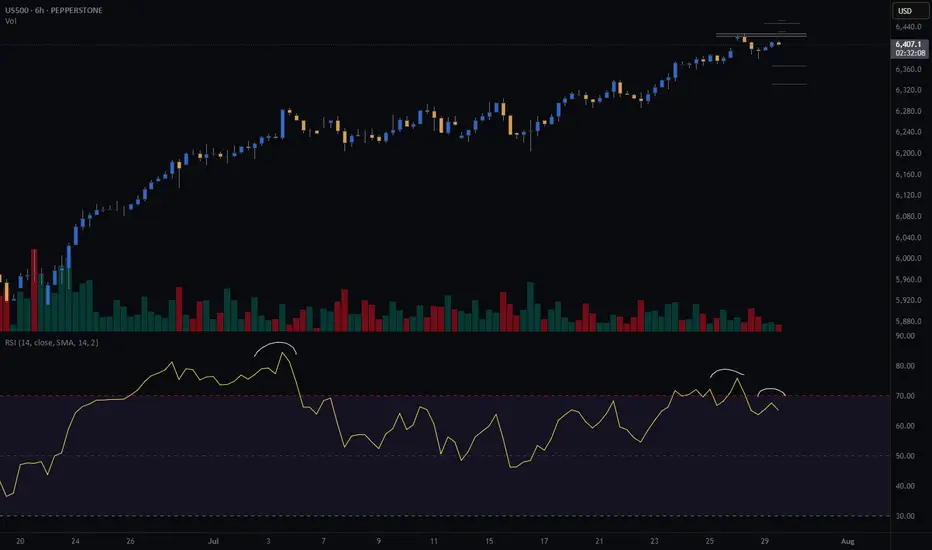
S&P Market Update – Signs of a Short-Term Correction?Although the S&P remains in an uptrend, recent price action suggests that momentum may be fading.
📉 Key Observations:
A Key Day Reversal occurred at 6409 – a potential warning signal.
We're seeing RSI divergence: price made a new high, but RSI didn’t follow suit.
The market is grinding higher, but without conviction.
📊 What to Watch:
The 15-day EMA, currently at 6317, is acting as near-term support. A close below this level could trigger a short-term correction.
Initial downside targets: 6147–6100, the previous highs from late 2024 and early 2025.
✅ To negate this bearish bias, the market would need to break above 6409 and continue higher with stronger momentum.
Stay alert — the technicals are flashing red flags. Always manage risk accordingly.
Disclaimer:
The information posted on Trading View is for informative purposes and is not intended to constitute advice in any form, including but not limited to investment, accounting, tax, legal or regulatory advice. The information therefore has no regard to the specific investment objectives, financial situation or particular needs of any specific recipient. Opinions expressed are our current opinions as of the date appearing on Trading View only. All illustrations, forecasts or hypothetical data are for illustrative purposes only. The Society of Technical Analysts Ltd does not make representation that the information provided is appropriate for use in all jurisdictions or by all Investors or other potential Investors. Parties are therefore responsible for compliance with applicable local laws and regulations. The Society of Technical Analysts will not be held liable for any loss or damage resulting directly or indirectly from the use of any information on this site.

Nifty again back towards the upper rangeNifty’s recent rise can be attributed to short covering ahead of the monthly expiry, which often results in a surge as traders close their short positions.
Currently, the index faces a strong resistance zone around 25,000–25,100. A clear move above this range could indicate a trend change or a shift towards a more bullish outlook. If Nifty does not decisively cross this resistance, the market is expected to remain neutral to sideways, meaning price action could stay range-bound without a clear direction.
Additionally, 24,600 will act as a strong support level. As long as Nifty stays above 24,600, market sentiment should remain stable, supporting a constructive stance. A break below this level could signal increased caution.
Summary:
Rise driven by short covering ahead of expiry.
Strong resistance at 25,000–25,100.
24,600 will act as strong support.
Above 25,100: Trend change or bullish breakout likely.
Below 25,100: Market remains neutral/sideways.
Above 24,600: Sentiment stays steady; below may warrant caution.
Unless Nifty crosses above the resistance zone or drops below strong support, the outlook remains stable and sideways.

DXY Outlook – From Bias to Execution Previous day closed bullish on DXY, leading me to look out for a bullish bias, On the 1H, I identified a familiar bullish pennant forming within the uptrend.

Nifty 24780 Pullback possible on next 1-2 days On 31 July, if someone watch closely price action he could capture Today up move coz Nifty gave almost same price action as 13 June let's try to find what is the Same thing: -
(A)31 July 2025: gap down is (-70%)
volume around 97 million
Bounce Back after gap down around +1%
(B) 13 June: gap down was (-80%)
Volume around 93 million
Bounce back after gap down around +1
On 13 June Nifty faced resistance of 24980 level then retraced. Due to such similarities, we can conclude that it could be pullback around 24780 level although I don't say market will behave same as before, I know every second of market is very dynamic and different from past days, but technical analysis always based on historical data. so, this is just assumption. take the trade on your own analysis & research.

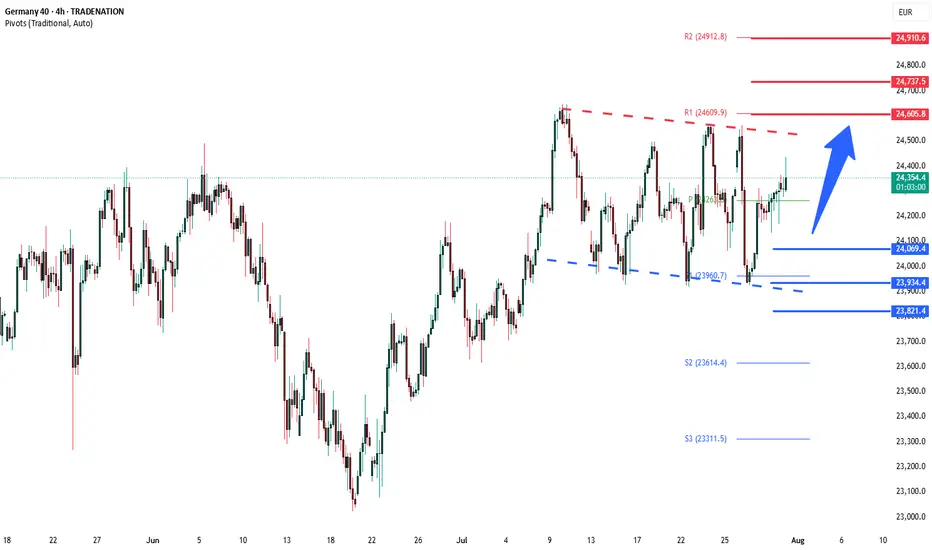
DAX sideways consolidation support at 24070The DAX remains in a bullish trend, with recent price action showing signs of a corrective pullback within the broader uptrend.
Support Zone: 24070 – a key level from previous consolidation. Price is currently testing or approaching this level.
A bullish rebound from 24070 would confirm ongoing upside momentum, with potential targets at:
24605 – initial resistance
24740 – psychological and structural level
24910 – extended resistance on the longer-term chart
Bearish Scenario:
A confirmed break and daily close below 24070 would weaken the bullish outlook and suggest deeper downside risk toward:
23935 – minor support
23820 – stronger support and potential demand zone
Outlook:
Bullish bias remains intact while the DAX holds above 23925. A sustained break below this level could shift momentum to the downside in the short term.
This communication is for informational purposes only and should not be viewed as any form of recommendation as to a particular course of action or as investment advice. It is not intended as an offer or solicitation for the purchase or sale of any financial instrument or as an official confirmation of any transaction. Opinions, estimates and assumptions expressed herein are made as of the date of this communication and are subject to change without notice. This communication has been prepared based upon information, including market prices, data and other information, believed to be reliable; however, Trade Nation does not warrant its completeness or accuracy. All market prices and market data contained in or attached to this communication are indicative and subject to change without notice.
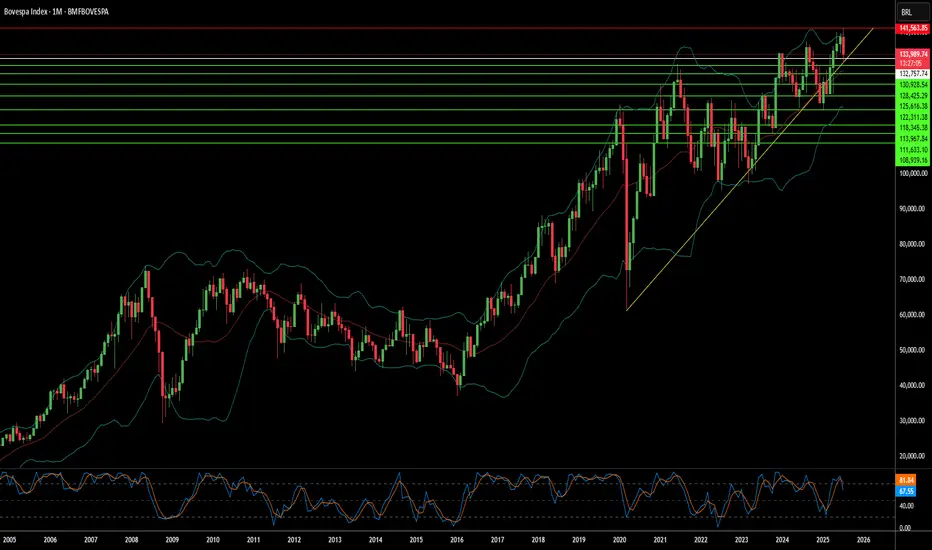
Has Geopolitics Clouded Brazil's Market Horizon?The Bovespa Index, Brazil's benchmark stock market index, faces significant headwinds from an unexpected source: escalating geopolitical tensions with the United States. Recent decisions by the US administration to impose a steep 50% tariff on most Brazilian imports, citing the ongoing prosecution of former President Jair Bolsonaro, have introduced considerable uncertainty. This move, framed by the US as a response to perceived "human rights abuses" and an undermining of the rule of law in Brazil's judiciary, marks a departure from conventional trade disputes, intertwining economic policy with internal political affairs. Brazilian President Luiz Inácio Lula da Silva has firmly rejected this interference, asserting Brazil's sovereignty and its willingness to negotiate trade, but not judicial independence.
The economic repercussions of these tariffs are multifaceted. While key sectors like civil aircraft, energy, orange juice, and refined copper have secured exemptions, critical exports such as beef and coffee face the full 50% duty. Brazilian meatpackers anticipate losses exceeding $1 billion, and coffee exporters foresee significant impacts. Goldman Sachs estimates an effective tariff rate of around 30.8% on total Brazilian shipments to the US. Beyond direct trade, the dispute dampens investor confidence, particularly given the US's existing trade surplus with Brazil. The threat of Brazilian retaliation looms, potentially exacerbating economic instability and further impacting the Bovespa.
The dispute extends into the technological and high-tech realms, adding another layer of complexity. US sanctions against Brazilian Supreme Court Justice Alexandre de Moraes, who oversees Bolsonaro's trial, directly link to his judicial orders against social media companies like X and Rumble for alleged disinformation. This raises concerns about digital policy and free speech, with some analysts arguing that regulating major US tech companies constitutes a trade issue given their economic significance. Furthermore, while the aerospace industry (Embraer) received an exemption, the broader impact on high-tech sectors and intellectual property concerns, previously highlighted by the USTR regarding Brazilian patent protection, contribute to a cautious investment environment. These intertwined geopolitical, economic, and technological factors collectively contribute to a volatile outlook for the Bovespa Index.

From Demand to Glory: Nifty’s Bullish March to 25,220 Nifty Bullish Outlook
-Current Price: 24,905 (approx)
- Key Demand Zone: 24,620 – 24,660
- Key Supply Zone: 25,200 – 25,240
Technical View
- Strong Demand Bounce: Nifty reversed sharply from the demand zone (24,620–24,660),
indicating strong buying interest.
- Trend Breakout Potential: Price is approaching resistance near 24,920; a breakout could push
towards the supply zone at 25,220 (target).
- Momentum Structure: Higher lows formed after the demand zone test, showing bullish
strength.
News & Data Supporting Bullish Bias
- India’s Q1 GDP Growth: The latest estimates show strong economic growth, supporting equity
market sentiment.
- FIIs Turning Buyers: Foreign Institutional Investors (FIIs) have been net buyers over the past
few sessions, supporting index upside.
- Global Market Tone: US and Asian equities are stable, and crude oil prices are moderating,
supporting risk appetite.
- RBI Policy Outlook: Market expects no immediate rate hikes, keeping liquidity positive for
equities.
Expectation
If Nifty sustains above 24,900, we expect a bullish move towards 25,220 in the short term.
Stop-loss: Below 24,780 (to manage risk).

Nasdaq Short: multiple reasonsOver here, I present to you the Nasdaq short idea again. For my previous idea, it was stopped out at 23500. This time, I changed the wave counts again, mainly merging the previous wave 5 into wave 3, allowing for the new high to be a wave 5.
On top of that, here are the few other reasons for the short:
1. Fibonacci extension levels: Wave 5 is slightly more than Wave 1.
2. RSI overbought for the 3rd time on the hourly timeframe.
3. Rising wedge false breakout.
4. Head-and-shoulders on the 1-min timeframe.
As usual, the stop for this idea is slightly above the recent high, around 23700.
Thank you.

US30 Technical Breakdown – 07/31/2025📍 US30 Technical Breakdown – 07/31/2025
US30 is currently trading at 44,624, showing signs of weakness after failing to hold gains near 45,100. The index has broken down from its recent consolidation range and is hovering just above mid-range support at 44,600.
Momentum has shifted slightly bearish, and price action remains choppy within the broader 44,700–45,000 range. Bulls must defend the 44,600 level to avoid a deeper move into the demand zone below.
📊 Current Market Behavior:
🔄 Choppy consolidation near the lower end of the range
📉 Repeated rejection at 45,100
🧱 Support currently holding around 44,600
⚠️ Downside pressure increasing – caution warranted
📌 Key Levels:
🔹 Resistance Zones:
44,745–44,800 → Immediate intraday ceiling
45,000 → Psychological resistance
45,100 → Previous swing high / heavy rejection area
🔹 Support Zones:
44,600 → Immediate support (currently testing)
44,326 → Strong historical support
44,171–43,929 → Broader demand zone
🧠 Bias:
🔽 Slightly Bearish Intraday
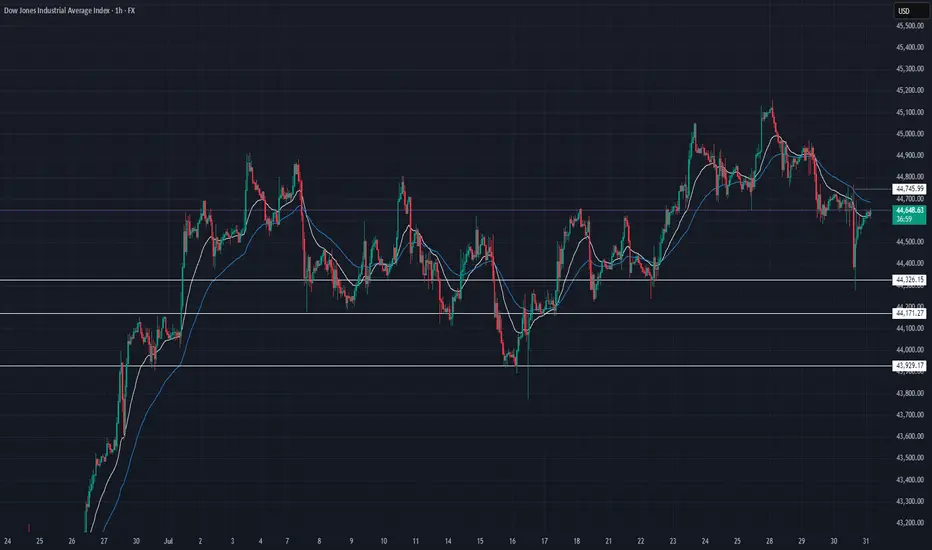
Dow Jones Industrial Average (DJI) – 1H Chart Analysis 1. Structure: Broad Range Consolidation
Price remains within a wide horizontal range between 45,137 resistance and 43,792 support. This shows indecision and distribution at highs.
2. Key Rejection Zone
The yellow zone around 45,001–45,137 acted as a strong supply area. Multiple rejections indicate heavy selling interest here.
3. Mid-Zone Compression
Current price is hovering just below 44,765 resistance — acting as a decision point. Break above it may retest the supply zone; rejection could send price lower.
4. Demand Holding at 44,280
The strong bounce from 44,280.25 shows buyers defending this demand zone. It's the key support to watch for bulls.
5. Next Play
Bullish: Break and hold above 44,765 targets 45,001–45,137.
Bearish: Failure leads to 44,280, then 43,973 → 43,792.
Neutral bias unless a clean breakout confirms direction.

UK100 - TIME TO DESTRUCTION UK TO HELLTeam, UK100 market is tank,
the economy is SH*T, not in a great shape
unemployment rising, crime increasing, jobless
inflation is out of control, but the market has not recognised the effect.
TIME TO PUT AN END TO THIS ERA - short range at 9175-9186
STOP LOSS AT 9225
EASY target 1 at 9152-42 - take 50% profit and bring stop loss to BE
Target 2 at 9128-9112
GOOD LUCK


UK 100 – Moving Back Into the Spotlight It’s been a while since we covered the UK 100, but it feels like recent moves and the fact there is a Bank of England (BoE) rate decision next Thursday (August 7th) means it warrants some extra attention.
For much of 2025 the UK 100 has been the under achiever when compared to other European indices, but things have changed slightly in July as a result of the breakout above the previous all-time high at 8909 (more on this below in technical update) which has led to multiple record peaks all the way up to the most recent one registered on July 28th at 9177.
This up move has been aided by bullish technical momentum, a weaker GBPUSD exchange rate, which can add support to the index given that UK 100 companies are multi-national, earning over 60% of their revenue outside of the UK, and increased expectations for a BoE rate cut of 25bps (0.25%) at their next rate meeting on Thursday August 7th.
Now, looking forward, before traders get ready for that BoE meeting, they must contend with the challenges presented by President Trump’s trade policy and two key US economic data releases that could impact sentiment towards the UK 100 into the weekend. The first piece of data is the US PCE Index inflation print, released later today at 1330 BST and the second is tomorrow’s Non-farm Payrolls update at 1330 BST.
Once traders have more clarity on the outlook for global trade after President Trump’s August 1st tariff deadline has passed, alongside the fresh insight into the current path of US inflation and the health of the labour market provided by these two pivotal pieces of economic data, their preparation can begin for a potential 25bps (0.25%) rate cut in the UK, as the market expects and the accompanying commentary from BoE Governor Bailey in the press conference on whether more cuts could be in the pipeline across the remaining months of 2025.
Technical Update: Assessing the Current Uptrend
Since posting a low of 7525 on April 7th it has been a positive period of trading for the UK 100 index, a move that has seen a near 22% advance. As the chart below shows, except for the decline down to 8692 on June 26th, this has been an almost uninterrupted phase of price strength, as a positive pattern of higher price highs and higher price lows has materialised.
Of course, there is no guarantee that this type of positive pattern will extend and continue to see new all-time highs posted, but traders may be anticipating further attempts at upside price extension, especially while support below current price levels remains intact.
So, with this in mind, let’s look at what could be the relevant support and resistance levels that might influence trader sentiment over upcoming sessions.
Potential Support Levels:
While Monday did see a new all-time high posted at 9177, a price sell-off then materialised to register a low for the day at 9060, but with support being found at this level, it might be suggested this now represents a higher low within the positive trend and as such, is potentially now the first support focus, as the chart below shows.
Traders may find it useful to monitor how 9060 performs as a support on a closing basis, as if it were to give way over coming sessions, a more extended phase of price weakness may result. Such downside support breaks could then see the focus shift to the 38.2% Fibonacci retracement of June 26th to July 28th strength which stands at 8990, possibly even the 50% level at 8933.
Potential Resistance Levels:
Having been capped by the July 28th high at 9177, the UK 100 index may now need to see successful closing breaks above this level to suggest a continuation of the recent positive price trend.
Successful closing breaks above the 9177 high, may be an indication of continued price strength, opening potential for moves to the next possible resistance at 9253, which is the 161.8% Fibonacci extension, even 9335, the higher 200% extension level.
The material provided here has not been prepared accordance with legal requirements designed to promote the independence of investment research and as such is considered to be a marketing communication. Whilst it is not subject to any prohibition on dealing ahead of the dissemination of investment research, we will not seek to take any advantage before providing it to our clients.
Pepperstone doesn’t represent that the material provided here is accurate, current or complete, and therefore shouldn’t be relied upon as such. The information, whether from a third party or not, isn’t to be considered as a recommendation; or an offer to buy or sell; or the solicitation of an offer to buy or sell any security, financial product or instrument; or to participate in any particular trading strategy. It does not take into account readers’ financial situation or investment objectives. We advise any readers of this content to seek their own advice. Without the approval of Pepperstone, reproduction or redistribution of this information isn’t permitted.

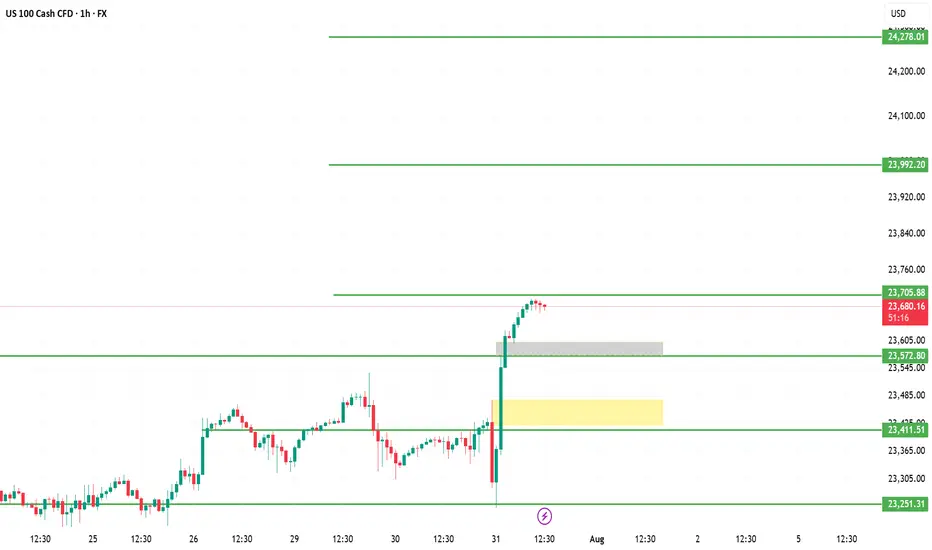
US100 (NASDAQ) Analysis – 1H Chart | July 31, 20251. Vertical Bullish Rally
Price exploded upward from 23,251 to 23,705 with strong bullish momentum and no meaningful retracement, indicating a short-term overbought scenario.
2. Fresh Supply at 23,705
The current candle shows hesitation just below 23,705.88 — forming a possible short-term top or reaction zone where sellers might step in.
3. Imbalance Zone Below
A visible Fair Value Gap (FVG) is left between 23,572–23,600 and the yellow highlighted demand zone (23,411) is untested. Price may revisit to fill that imbalance.
4. Projection: Pullback Possible
If price fails to break and hold above 23,705, we may see a pullback toward 23,600 → 23,411 before the next move.
5. Key Levels
Resistance: 23,705 → 23,992 → 24,278
Support: 23,572 → 23,411 → 23,251
Structure remains bullish unless 23,411 breaks.

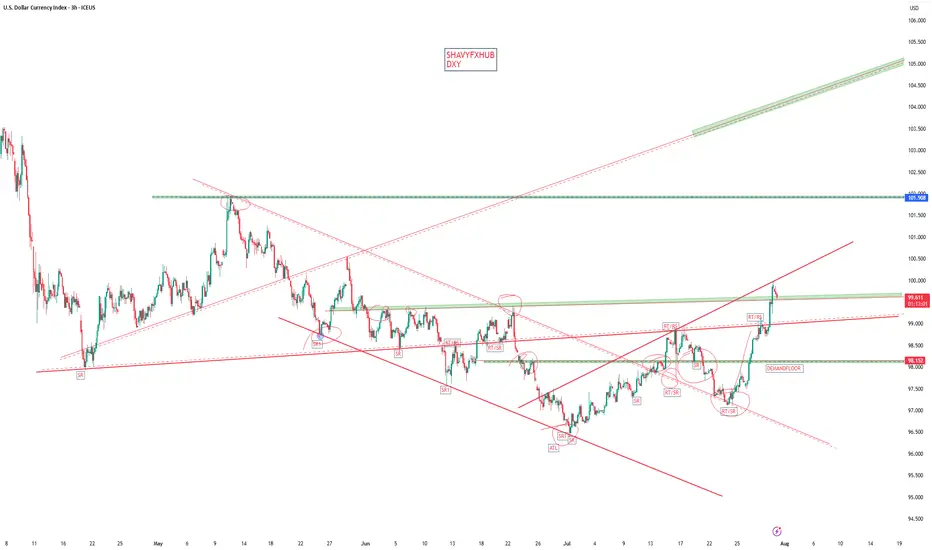
DXYThe Federal Open Market Committee (FOMC) announced on July 30, 2025, that it will maintain the federal funds rate at the current target range of 4.25% to 4.50%. This keeps the rate unchanged from previous meetings, continuing a "wait-and-see" approach amid mixed economic signals. The decision was supported by a 9-2 vote. The committee highlighted that recent data suggests economic activity growth has moderated in the first half of the year, with low unemployment and somewhat elevated inflation. The FOMC indicated it would carefully assess incoming data, the evolving economic outlook, and the balance of risks before making further adjustments. There is no rate cut at this meeting, but the Fed remains attentive to risks on both sides of its dual mandate of maximizing employment and achieving inflation around 2%.
Federal Reserve Chair Jerome Powell emphasized the need for additional data, particularly regarding the impact of tariffs on inflation and economic conditions, before changing policy. The economy showed stronger-than-expected second-quarter growth, but inflation remains above the Fed's 2% target, contributing to the decision to hold rates steady. The committee's stance reflects caution despite pressure from political sources to cut rates.
The next FOMC meeting after this one will be in September 2025, and some economists predict a possible rate cut then depending on economic developments. Powell's press conference and the FOMC statement will be closely analyzed for any subtle shifts in policy tone or outlook.
In summary:
Federal funds rate maintained at 4.25% - 4.50%
Economic growth moderated but remains solid
Low unemployment, inflation somewhat elevated
Fed is data-dependent and cautious
No rate cut for now but possible in September
This is consistent with the ongoing approach since late 2024 of holding rates steady to balance inflation control and support for the labor market.
#NIFTY50 Analysis 31st July#NIFTY50 currently seems to be correcting the rally from April low. Any rally is a buy in 3-7 swings. However we see second leg formation in progress.
