DXY has finally arrived at our final POI. What next?DXY has finally arrived at a point I marked out for you since. I called it out and I was called a madman.
We may experience some downwards pressure and it already started during the Asian session. We have to wait for further confirmation to know if it wants to continue the bullish movement or fall.
Let's be patient for now.
Market indices
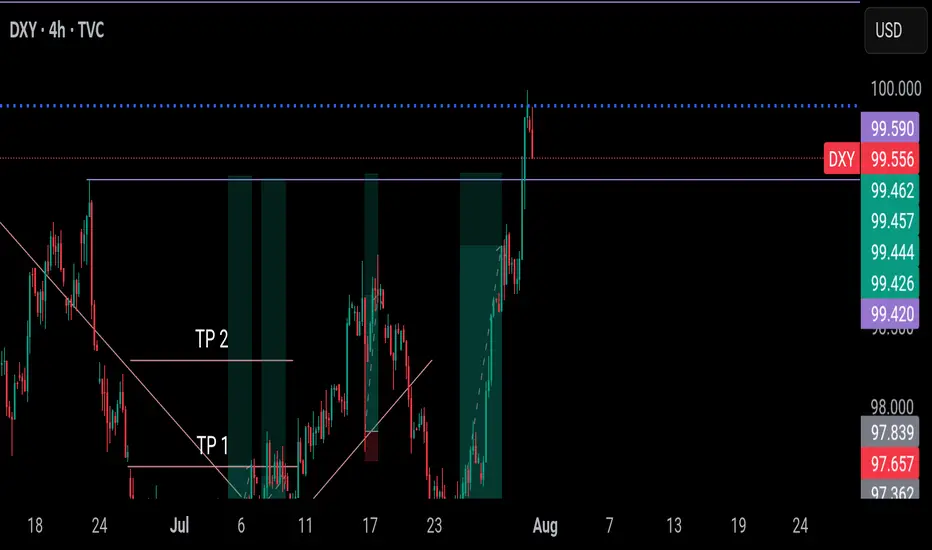
Decision Zone for DXY This Week: Around 97.600After a significant downward expansion in DXY, we observed a consolidation around last week's low. This week, the market opened with a pullback.
The first stop for this pullback appears to be the current daily fractal high candle and the weekly bearish FVG on the chart. We can assess potential selling pressure from this area on lower timeframes. We'll be monitoring the wicks within this zone, along with any newly forming FVGs.
If the price breaks above this area, our next points of interest will be the gaps within the zone above the 0.5 swing level, and ultimately the swing high itself as the final target.
Given the current setup, we believe there are promising trading opportunities on EURUSD.
Take care until the next update!

NASDAQ price dropAfter the Nasdaq price reaches around 23642.2, a historic drop will occur and the target is to drop to 16308.
Whatever happens at the highest price, the final destination is towards 16308.
I have identified the price levels in the middle of this expected drop that can cause the price to correct.
IG:NASDAQ

U.S. Dollar Index (DXY) – Pro Analysis | 1H Chart |1. Strong Bullish Momentum
DXY broke out sharply above the 99.41 resistance, showing clear strength from bulls with minimal pullbacks during the rally.
2. Short-Term Rejection at Supply
Price was rejected from the 99.978 zone — a key supply area. This indicates the presence of active sellers near the psychological 100 level.
3. Retesting Breakout Structure
Currently hovering just above 99.669, the DXY is retesting the previous breakout level. This could act as short-term support if bullish momentum resumes.
4. Next Key Zones
Resistance: 99.978 → 100.534
Support: 99.411 → 98.92
Break below 99.411 may invalidate the breakout.
5. Outlook
Bias remains bullish above 99.41. However, failure to reclaim 99.978 soon may signal temporary exhaustion or consolidation before next leg up.

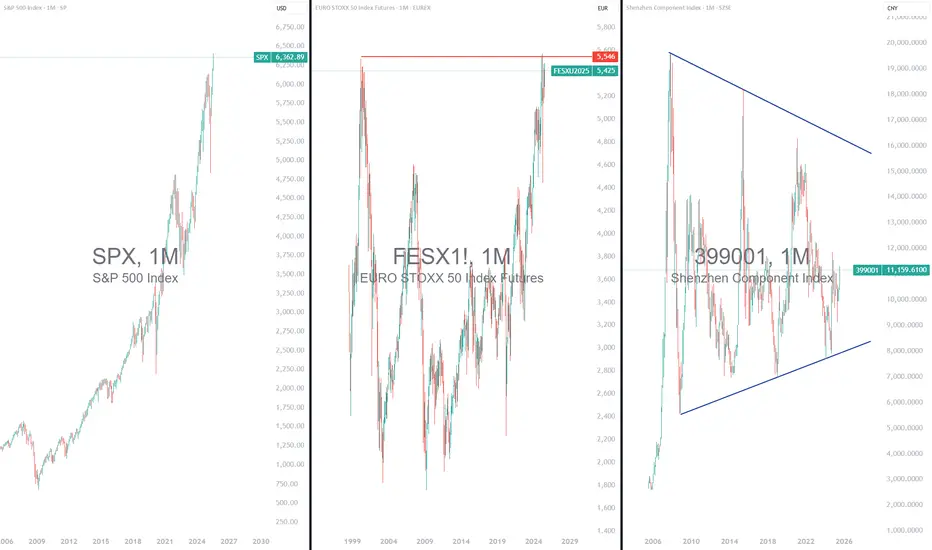
Wall Street Very Expensive: Time for Europe and China?1) The S&P 500 valuation has reached its late 2021 record
In the second quarter of 2025, the valuation of the U.S. market, represented by the S&P 500, returned to its record levels of late 2021. The S&P 500 has been reaching new all-time highs consistently since early July. In contrast, European and Chinese markets appear undervalued. In Europe, indices such as the Stoxx 600 and the Eurostoxx 50 remain below their historical highs. There is catch-up potential, especially as valuation remains reasonable. Technically, these markets offer attractive setups. In China, the potential is even more pronounced. Chinese markets are significantly behind, both technically and fundamentally. It would simply be a matter of returning to their former peaks.
Although U.S. corporate earnings remain strong, the current valuation of the S&P 500 limits its short-term upside potential. Conversely, Europe—and especially China—offers a more attractive risk/reward profile at this point in the cycle, both in terms of market valuation and technical analysis. While the S&P 500’s long-term trend remains bullish, it may therefore be wise to rebalance slightly in favor of European and Chinese equities.
The first chart below shows monthly candlesticks for the flagship Shenzhen stock exchange index.
The second chart below shows monthly candlesticks for the EuroStoxx 50 futures contract, with a market that has not yet exceeded its historical high—unlike the S&P 500 index.
2) The Shiller PE (or CAPE Ratio) is the best option to compare U.S., European and Chinese equity market valuations
The CAPE ratio (Cyclically Adjusted Price-to-Earnings ratio), also called the Shiller PE, is a financial indicator that measures stock market valuation. It compares the current price of an index, such as the S&P 500, to average inflation-adjusted earnings over the past ten years. Unlike the standard PE ratio based on a single year’s earnings, the CAPE smooths out cyclical fluctuations to provide a more stable, long-term view of valuation.
While the Shiller PE of the S&P 500 has returned to its 2021 record, that of the European and especially Chinese equity markets remains well behind. There is therefore still significant catch-up potential for Chinese and European stocks compared to U.S. stocks according to this fundamental valuation metric.
The chart below, produced by Barclays Research, shows a comparison of equity market valuations using the CAPE ratio between China, the United States, and Europe.
The Warren Buffett indicator, for its part, proposes a valuation comparison using the ratio of market capitalization to GDP. Here too, the message is clear: the Chinese equity market is significantly cheaper than the U.S. equity market. The table below is taken from the website Gurufocus.
DISCLAIMER:
This content is intended for individuals who are familiar with financial markets and instruments and is for information purposes only. The presented idea (including market commentary, market data and observations) is not a work product of any research department of Swissquote or its affiliates. This material is intended to highlight market action and does not constitute investment, legal or tax advice. If you are a retail investor or lack experience in trading complex financial products, it is advisable to seek professional advice from licensed advisor before making any financial decisions.
This content is not intended to manipulate the market or encourage any specific financial behavior.
Swissquote makes no representation or warranty as to the quality, completeness, accuracy, comprehensiveness or non-infringement of such content. The views expressed are those of the consultant and are provided for educational purposes only. Any information provided relating to a product or market should not be construed as recommending an investment strategy or transaction. Past performance is not a guarantee of future results.
Swissquote and its employees and representatives shall in no event be held liable for any damages or losses arising directly or indirectly from decisions made on the basis of this content.
The use of any third-party brands or trademarks is for information only and does not imply endorsement by Swissquote, or that the trademark owner has authorised Swissquote to promote its products or services.
Swissquote is the marketing brand for the activities of Swissquote Bank Ltd (Switzerland) regulated by FINMA, Swissquote Capital Markets Limited regulated by CySEC (Cyprus), Swissquote Bank Europe SA (Luxembourg) regulated by the CSSF, Swissquote Ltd (UK) regulated by the FCA, Swissquote Financial Services (Malta) Ltd regulated by the Malta Financial Services Authority, Swissquote MEA Ltd. (UAE) regulated by the Dubai Financial Services Authority, Swissquote Pte Ltd (Singapore) regulated by the Monetary Authority of Singapore, Swissquote Asia Limited (Hong Kong) licensed by the Hong Kong Securities and Futures Commission (SFC) and Swissquote South Africa (Pty) Ltd supervised by the FSCA.
Products and services of Swissquote are only intended for those permitted to receive them under local law.
All investments carry a degree of risk. The risk of loss in trading or holding financial instruments can be substantial. The value of financial instruments, including but not limited to stocks, bonds, cryptocurrencies, and other assets, can fluctuate both upwards and downwards. There is a significant risk of financial loss when buying, selling, holding, staking, or investing in these instruments. SQBE makes no recommendations regarding any specific investment, transaction, or the use of any particular investment strategy.
CFDs are complex instruments and come with a high risk of losing money rapidly due to leverage. The vast majority of retail client accounts suffer capital losses when trading in CFDs. You should consider whether you understand how CFDs work and whether you can afford to take the high risk of losing your money.
Digital Assets are unregulated in most countries and consumer protection rules may not apply. As highly volatile speculative investments, Digital Assets are not suitable for investors without a high-risk tolerance. Make sure you understand each Digital Asset before you trade.
Cryptocurrencies are not considered legal tender in some jurisdictions and are subject to regulatory uncertainties.
The use of Internet-based systems can involve high risks, including, but not limited to, fraud, cyber-attacks, network and communication failures, as well as identity theft and phishing attacks related to crypto-assets.
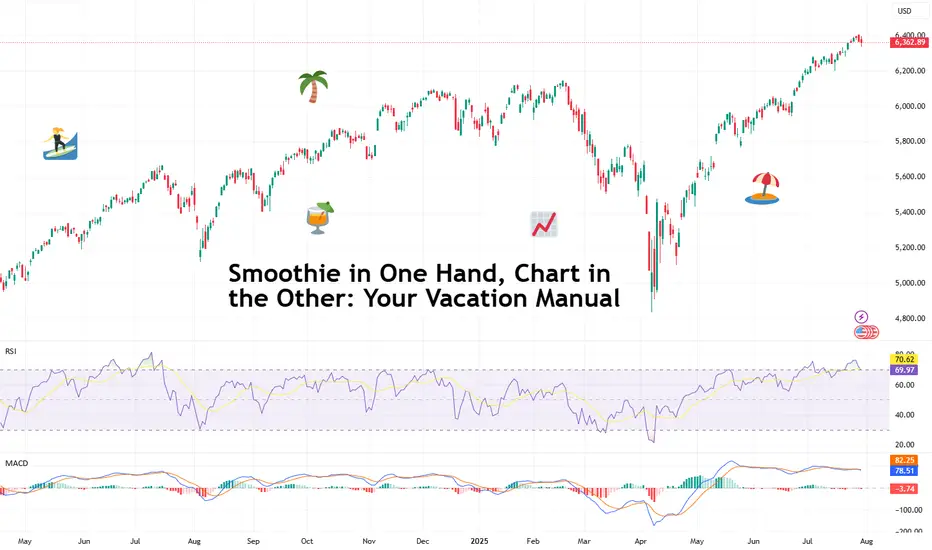
Smoothie in One Hand, Chart in the Other: Your Vacation ManualSome traders bring a beach read. Others bring their TradingView charts.
It’s the heat of the summer and we figured, why not take it easy with a breeze of lightweight lines to pair with your mezcal espresso martini? Let’s talk about how to relax while still watching the markets.
🏄♂️ Market Never Sleeps… But You Should
Vacations are supposed to be about unplugging, but for traders, that’s just code for “I’ll switch to the app instead.”
And we don’t blame you. With all that’s going on — US-EU tariff deal, stocks at record highs, and Ethereum BITSTAMP:ETHUSD outperforming Bitcoin BITSTAMP:BTCUSD in a monster July run — it’s only natural for market participants to be hooked at this time.
But watch for those signs of getting overly attached. Studies show performance suffers when you're overcooked — like your last scalp trade on Powell Day. So yes, that mojito matters. Just don’t place a leveraged position on a pool float.
📅 Timing the Market… and Your Booking
Let’s talk timing. The pros know not to schedule getaways during Nonfarm Payrolls week or FOMC decision day. (Unless your idea of relaxing is explaining yield curves to your kids on a ferry across lake Como.)
Instead, try planning your time off during historically low-volatility periods. Summer often sees volume dry up like your skin without sunscreen. Think August’s fairly dry weeks — when even the algorithms seem to be on holiday. As always, consult with the Economic Calendar to know when these are.
Bonus tip: if you’re flying and you wanna stay wired in, go for premarket or after-hours shifts. Nothing says “seasoned trader” like placing an order while the flight attendant gathers everyone’s attention for the safety demo.
🧴 SPF 50 and the S&P 500: Know Your Risk Exposure
In these scorchers outside, you wouldn’t step out without sunscreen, right? But would you let your positions roast unsupervised?
Use stop losses like you use sunblock: generously and repeatedly. Even better — scale back. Summer’s thin liquidity (and other summer trading traps ) can turn minor market moves into full-on tidal waves. No one wants to explain to their friends why they lost 40% of their portfolio during a snorkeling trip.
Adequate position sizing is your beach umbrella. It doesn’t stop the storm, but it’ll stop the burn.
🧭 Wi-Fi, but Make It Secure
Public Wi-Fi is great for scrolling memes, not executing trades. One accidental login from a beachside café in Mykonos and boom — your brokerage account may become a group project.
Trading from your vacation spot shouldn’t be a flex (no matter how much you want to look cool to the bunch of people around you). Focus on your game, trade in silence, and bask in sunlight and success.
☀️ Pack Light, Trade Lighter
The golden rule? If you’re not at your desk, don’t trade like you are.
Scale back positions, minimize leverage, and don’t try to outperform the market while someone’s kid is throwing a beach ball at your head. This is a maintenance phase, not a moonshot month.
Think: protect capital, avoid drawdowns, maybe sneak in a swing trade between sunscreen applications.
📲 Must-Have Apps for Sand-and-Screen Trading
You’re not bringing a full setup, but your phone can still do the heavy lifting. Load it with TradingView (obviously), your broker, ideally paired with TradingView, and a solid news feed . Bonus points for noise-canceling headphones that can drown out both market panic and crying toddlers.
Set up push notifications smartly — only the alerts you actually need. You don’t want your wrist buzzing every time Nvidia NASDAQ:NVDA moves 0.1%.
Question for the road : What’s your best summer trade… and was it worth checking your phone at dinner to place it?
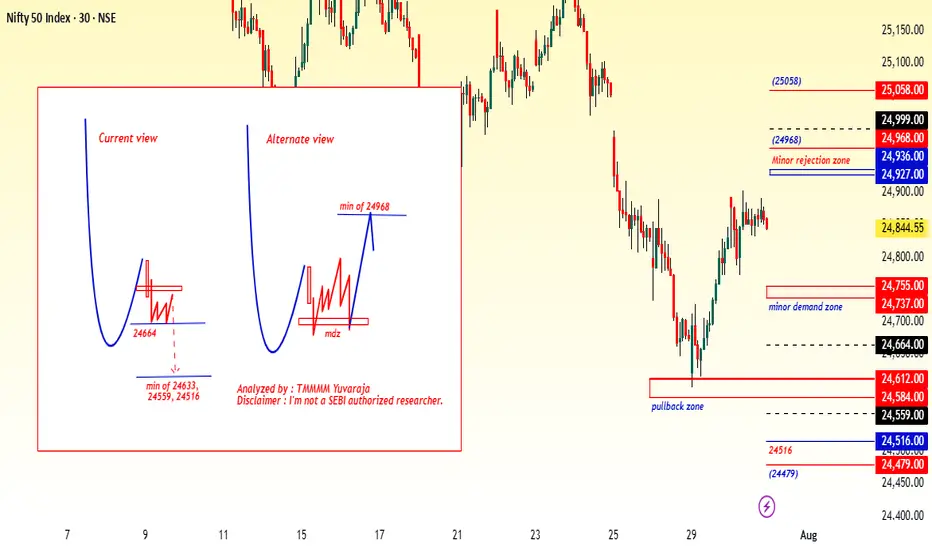
What's Nifty Next?With rising tensions between countries, market sentiment is becoming increasingly cautious. This geopolitical uncertainty is likely to weigh heavily on investor confidence in the coming weeks.
Based on the current scenario, a realistic target for Nifty seems to be around 21,000 by July, especially if the negative sentiment continues and foreign institutional investors (FIIs) remain net sellers. Global cues, crude oil prices, and currency fluctuations could further impact the index's performance.
📌 However, if by any chance Nifty manages to close above 25,500, it would indicate an extremely strong bullish breakout, defying current market fundamentals. Given the present conditions, this seems highly unlikely, unless there is a sudden positive catalyst such as:
A major resolution in geopolitical issues
Strong corporate earnings
Aggressive policy support from the government or RBI
🧠 My Take:
For now, it’s wise to remain cautious and watch key support/resistance levels. Volatility may remain high, and short-term traders should manage their positions carefully.
💬 Let me know your thoughts in the comments below. Do you think 21k is coming soon, or can the bulls surprise us all?

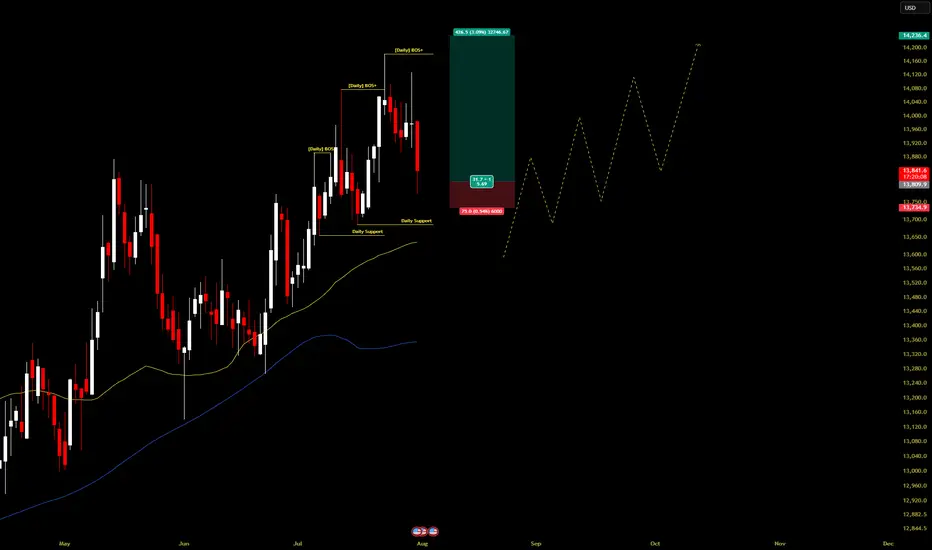
Simple Price Action HH, HL , HH , HL , HHSimple price action. Higher high, Higher low, Break higher high, Higher low, Another higher high.
around 5.75rr
#Nifty directions and levels for July 31st:Good morning, friends! 🌞
Here are the market directions and levels for July 31st:
In the past two sessions, the global market (based on Dow Jones) has shown a moderately bearish sentiment,
while the local market continues to reflect a bearish tone.
Today, Gift Nifty indicates a gap-down opening of around 160 points (as per the chart).
What can we expect today?
In the previous session, both Nifty and Bank Nifty went through consolidation.
Structurally, we are still in a bearish tone, and with Gift Nifty indicating a gap-down start,
if the market breaks the immediate support levels with a solid candle, we can expect further correction.
On the other hand, if it finds support there, then the range-bound movement is likely to continue.
Which means, if the initial market takes a pullback, we can expect consolidation within the previous day’s range.
#Banknifty directions and levels for July 31st:
What can we expect today?
In the previous session, both Nifty and Bank Nifty went through consolidation.
Structurally, we are still in a bearish tone, and with Gift Nifty indicating a gap-down start,
if the market breaks the immediate support levels with a solid candle, we can expect further correction.
On the other hand, if it finds support there, then the range-bound movement is likely to continue.
Which means, if the initial market takes a pullback, we can expect consolidation within the previous day’s range.

SPX500USD | Retesting All-Time HighsThe index has extended its bullish rally, printing a new local high at 6,286.5 before showing signs of slight hesitation with consecutive small-bodied candles.
Support at: 6,134.5 / 6,026.0 / 5,926.2 🔽
Resistance at: 6,286.5 🔼
🔎 Bias:
🔼 Bullish: Sustains above 6,134.5 and breaks 6,286.5 for new highs.
🔽 Bearish: Break below 6,134.5 could trigger a retracement toward 6,026.0.
📛 Disclaimer: This is not financial advice. Trade at your own risk.

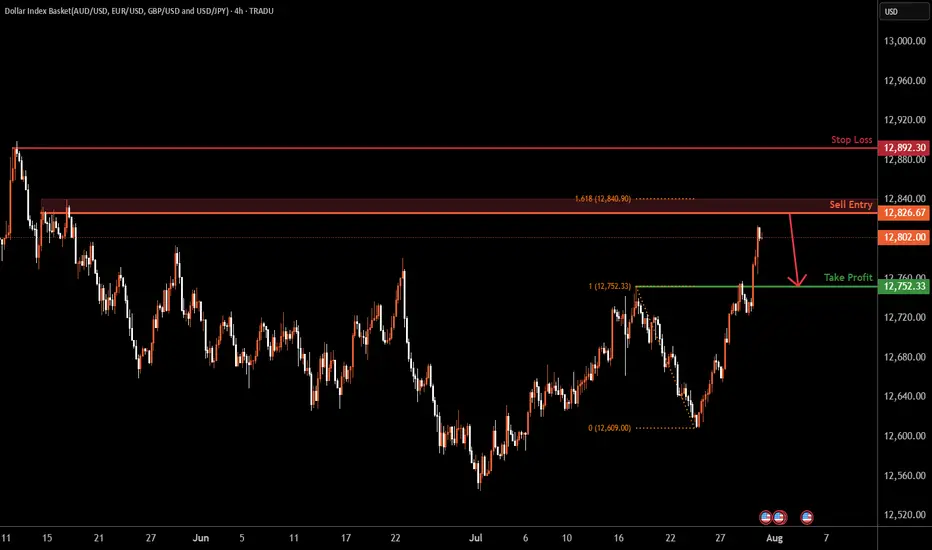
USDOLLAR H4 | Bearish reversalBased on H4 chart analysis, we can see the price rising towards the sell entry at 12,826.67, which is a swing high resistance.
Stop loss is at 12,892.30, which is a swing high resistance.
Our take profit will be at 12,752.33, which is a pullback support.
High Risk Investment Warning
Trading Forex/CFDs on margin carries a high level of risk and may not be suitable for all investors. Leverage can work against you.
Stratos Markets Limited (tradu.com ):
CFDs are complex instruments and come with a high risk of losing money rapidly due to leverage. 65% of retail investor accounts lose money when trading CFDs with this provider. You should consider whether you understand how CFDs work and whether you can afford to take the high risk of losing your money.
Stratos Europe Ltd (tradu.com ):
CFDs are complex instruments and come with a high risk of losing money rapidly due to leverage. 66% of retail investor accounts lose money when trading CFDs with this provider. You should consider whether you understand how CFDs work and whether you can afford to take the high risk of losing your money.
Stratos Global LLC (tradu.com ):
Losses can exceed deposits.
Please be advised that the information presented on TradingView is provided to Tradu (‘Company’, ‘we’) by a third-party provider (‘TFA Global Pte Ltd’). Please be reminded that you are solely responsible for the trading decisions on your account. There is a very high degree of risk involved in trading. Any information and/or content is intended entirely for research, educational and informational purposes only and does not constitute investment or consultation advice or investment strategy. The information is not tailored to the investment needs of any specific person and therefore does not involve a consideration of any of the investment objectives, financial situation or needs of any viewer that may receive it. Kindly also note that past performance is not a reliable indicator of future results. Actual results may differ materially from those anticipated in forward-looking or past performance statements. We assume no liability as to the accuracy or completeness of any of the information and/or content provided herein and the Company cannot be held responsible for any omission, mistake nor for any loss or damage including without limitation to any loss of profit which may arise from reliance on any information supplied by TFA Global Pte Ltd.
The speaker(s) is neither an employee, agent nor representative of Tradu and is therefore acting independently. The opinions given are their own, constitute general market commentary, and do not constitute the opinion or advice of Tradu or any form of personal or investment advice. Tradu neither endorses nor guarantees offerings of third-party speakers, nor is Tradu responsible for the content, veracity or opinions of third-party speakers, presenters or participants.
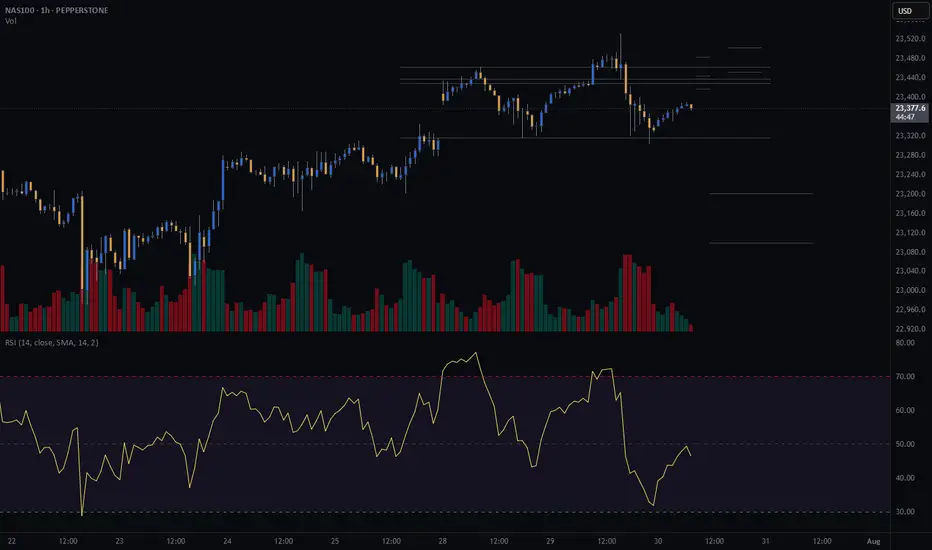
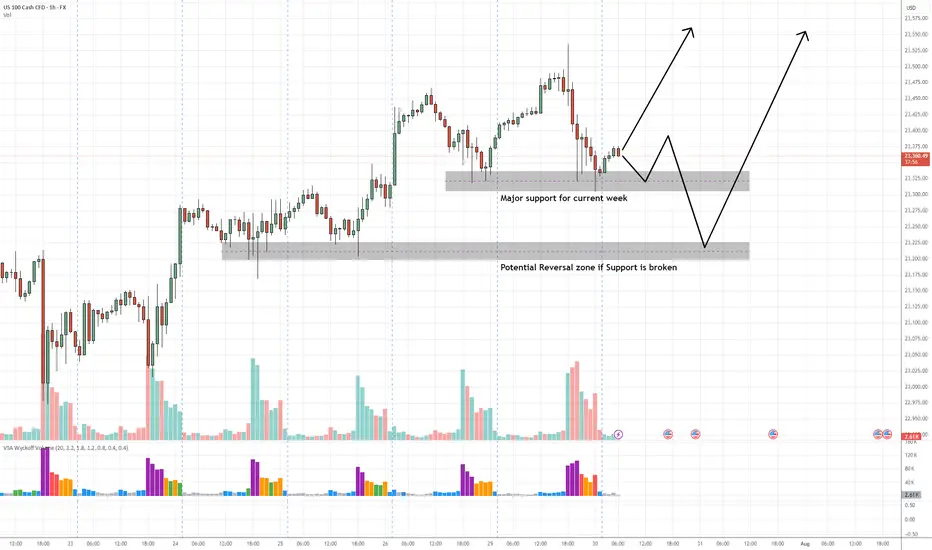
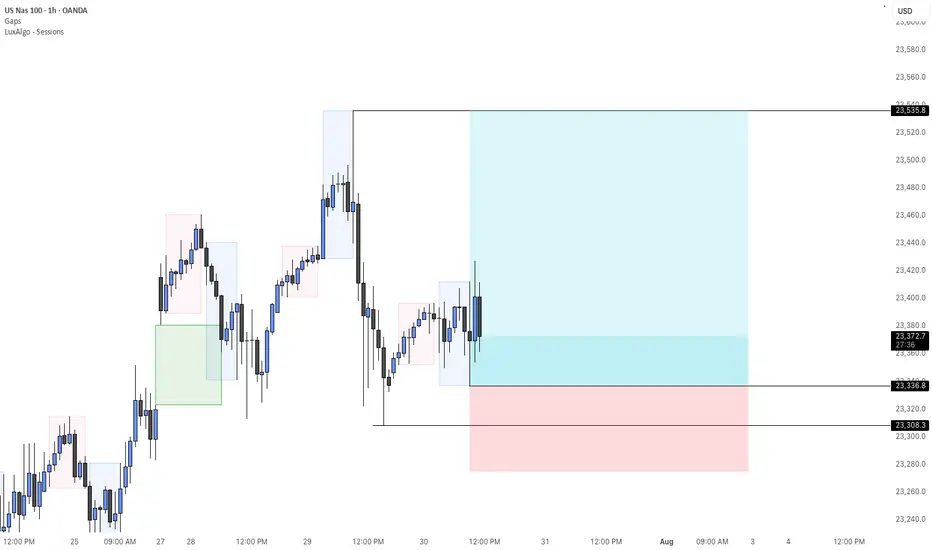
NAS100 Buy Setup – VSA & Multi-Zone Demand Analysis✅ Primary Entry Zone: Major support for current week (around 23,325–23,350)
✅ Secondary Entry Zone: Potential reversal zone if primary support is broken (around 23,200–23,230)
🎯 Target 1 (TP1): Previous swing high near 23,500
🎯 Target 2 (TP2): Extension above 23,550
🛑 Stop Loss (SL): Below 23,170 (beyond secondary reversal zone to avoid false breaks)
📊 Technical Insight (VSA & Price Action Structure)
Support Structure:
The current major support zone has been tested multiple times with no follow-through selling, indicating strong buying interest from larger players.
Volume Spread Analysis Observations:
On the recent decline into the major support zone, we see wider spreads on high volume followed by narrow range candles on lower volume, a classic sign of stopping volume and supply exhaustion.
Within the secondary reversal zone, historical reactions show climactic volume spikes leading to sharp reversals, suggesting this level is watched closely by smart money.
Any test back into the zone on low volume would confirm the No Supply (NS) condition.
Trade Pathways:
Scenario 1: Price respects the major support and begins to climb, confirming demand dominance → target TP1 then TP2.
Scenario 2: Support is temporarily breached, triggering a liquidity grab into the secondary reversal zone, followed by a bullish reversal bar on high volume → strong buy signal with potentially faster move toward TP levels.
📍 Bias: Bullish as long as price holds above the secondary reversal zone.
📌 Execution Tip: Wait for a wide spread up-bar on increased volume from either zone to confirm the start of the markup phase.
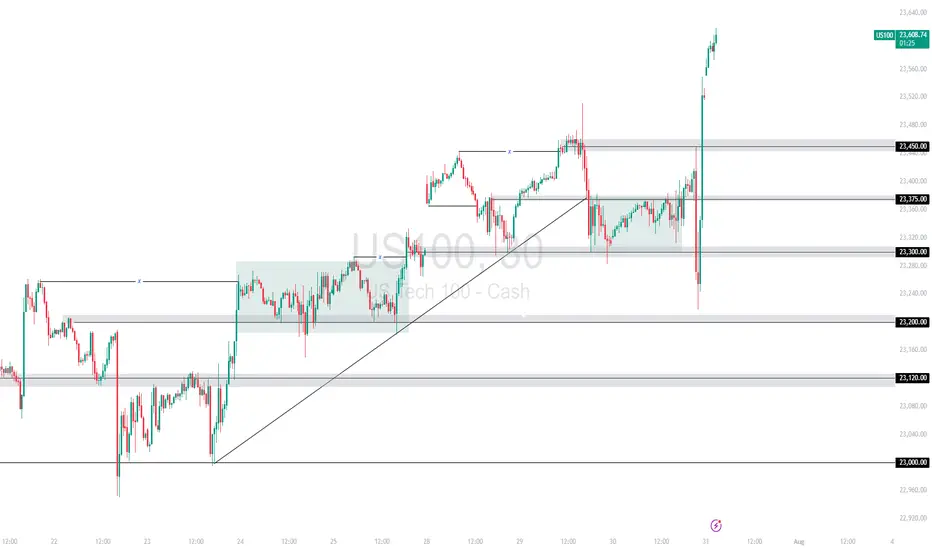
US100 Surges on Strong Fed Data and Trump Trade Deals A combination of upbeat economic data from the Fed and renewed optimism from Trump’s trade announcements fueled a powerful bullish rally on the US100. Price broke above the 23,450 🔼 resistance after reclaiming the 23,300 🔽 zone, leaving behind a strong V-shaped recovery from 23,200 🔽.
Support Levels: 23,450 🔽, 23,375 🔽, 23,300 🔽
Resistance Levels: None locally – price is printing new highs
Bias:
🔼 Bullish: Holding above 23,450 could support further upside. A clean retest may offer continuation entries.
🔽 Bearish: A drop back below 23,450 would weaken the rally and may open the path to 23,375 or 23,300.
📛 Disclaimer: This is not financial advice. Trade at your own risk.
NAS - LET'S MAKE MILLIONS Team, last night NAS I was expect the FALL BACK as I predicted rate un-change will get NASTY on both DOW AND NAS.
So I have a set up entry LONG, i didnt expect the NAS flying to the moon.
both target hit so fast in 15 minutes
However, today is another opportunity to SHORT NAS on the current market at 23613-23625
STOP LOSS AT 23720
Once the NAS pull back toward 23580-65 - BRING STOP LOSS TO BE
TARGET 1: at 23540-20
TARGET 2: at 23480-65
LETS GO

SPY back in the trendlineFrom a technical stand point, the expectation was that the trend line will be respected and sellers will force price to close back inside.
Today's daily close can ignite further downward movement which can align with August seasonality that typically sees Indices pull back within this period.
Target still remains 6108 at previous ATH

NAS - LONGWaiting to see how news affects the markets today. IF we hold this area and we get confirmation that buyers are taking over. I will enter long and target previous highs.
USD Dollar Index (DXY): Pushing Higher As Forecast!Welcome back to the Weekly Forex Forecast for the week of July 30 - Aug1
In this video, we will analyze the following FX market:
USD Index
In my last USD video, the forecast was for higher prices. Check the related links below to see that video forecast. It played out exactly as analyzed. The +FVG was used to push for higher prices. The FOMC decision to keep the rate unchanged only pushed it further along.
Enjoy!
May profits be upon you.
Leave any questions or comments in the comment section.
I appreciate any feedback from my viewers!
Like and/or subscribe if you want more accurate analysis.
Thank you so much!
Disclaimer:
I do not provide personal investment advice and I am not a qualified licensed investment advisor.
All information found here, including any ideas, opinions, views, predictions, forecasts, commentaries, suggestions, expressed or implied herein, are for informational, entertainment or educational purposes only and should not be construed as personal investment advice. While the information provided is believed to be accurate, it may include errors or inaccuracies.
I will not and cannot be held liable for any actions you take as a result of anything you read here.
Conduct your own due diligence, or consult a licensed financial advisor or broker before making any and all investment decisions. Any investments, trades, speculations, or decisions made on the basis of any information found on this channel, expressed or implied herein, are committed at your own risk, financial or otherwise.

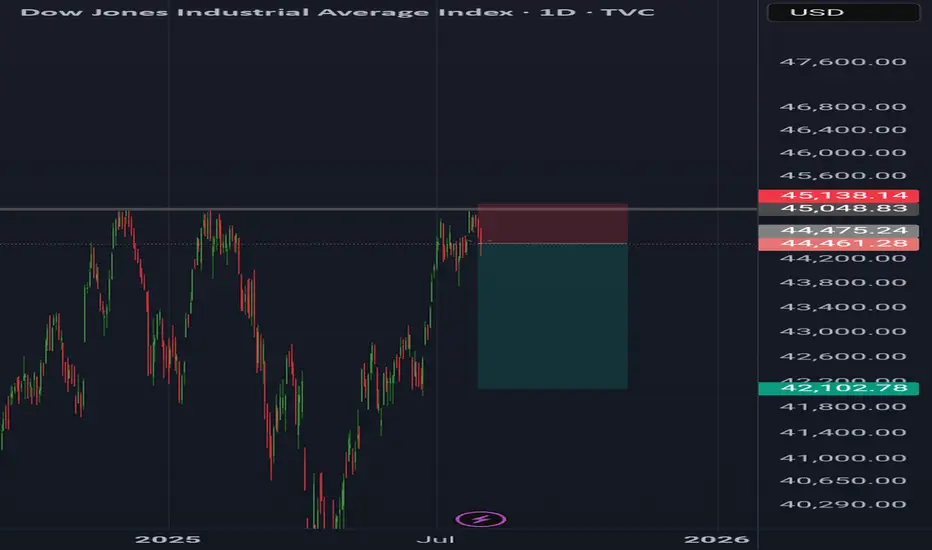
Dow jonesDow Jones daily analysis
Time frame daily
Risk rewards ratio >3.5
Short position
Because price couldn't break the 45.048 again and earthquake in 5he east of Russia and Japan makes the markets drop down
DXY attempting an inverse H&S breakoutSeeing a big green candle today on dxy after confirming the neckline of the inverse head and shoulders pattern as support on the previous daily candle.
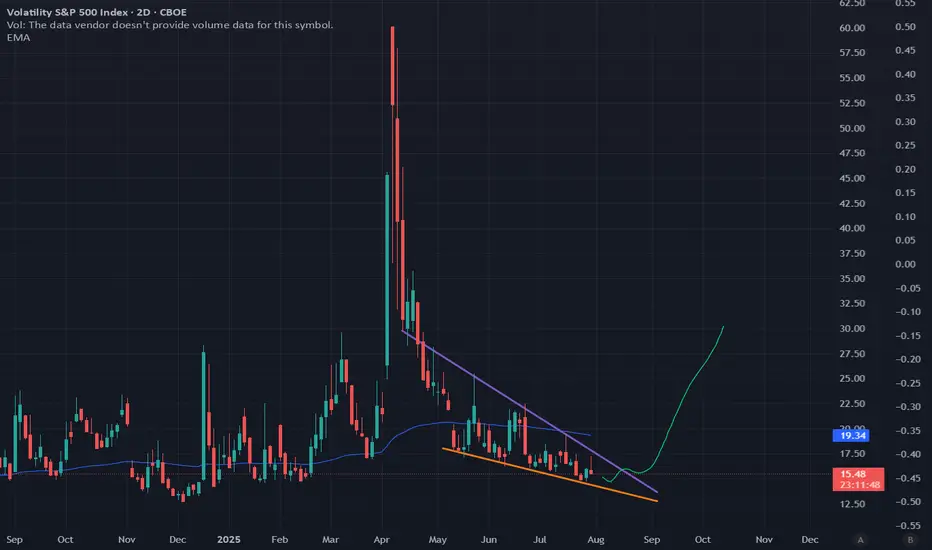
Unprecedented VOL suppression will lead to VIX October explosionAccording to my discussions with ChatGPT and analyzing various metrics we are currently in one of the longest periods, if not *the longest* period, of Vol suppression in the entire history of volatility.
Zooming out and looking at the current chart pattern VIX is very clearly in a falling wedge, which means its falling days are numbered.
Once you see a daily close breach of the upper boundary of the upper wedge channel, I would consider buying some VIX 30 calls for Oct 22 expiration.
Once VIX pierces 25, take profit and close the option.
Good luck and happy trading!
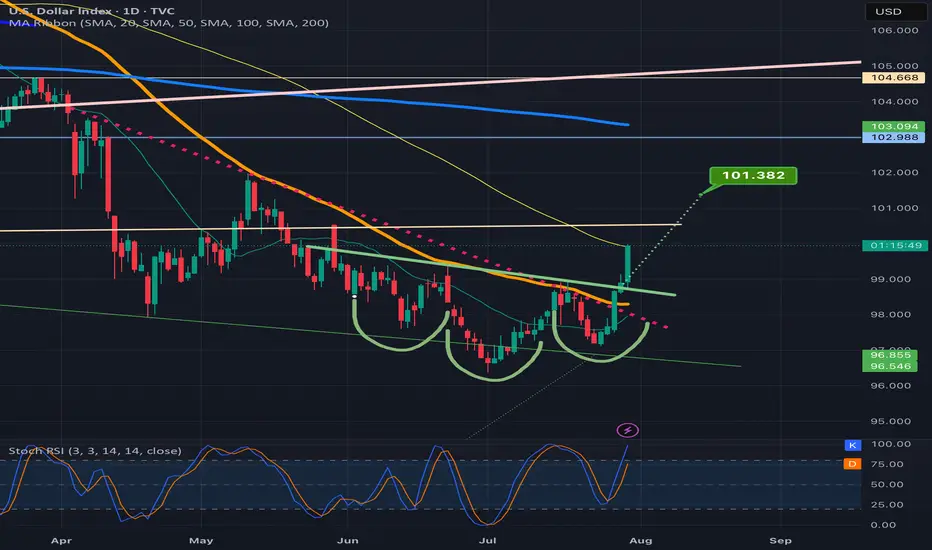
DXY with interest rates With interest rates remaining steady, the U.S. Dollar is currently moving in a bullish direction.
As shown in the chart, it seems likely that price will break the previous high and form a bullish Quasimodo (QM) pattern. The price may then reach the 50% Fibonacci level.
After that, we should wait and observe the market's reaction.
If price gets rejected from the 103 zone — especially if accompanied by a rate cut or bearish price action — we could see a sharp decline toward the 95 area.
This 95 zone also aligns with a key weekly Fibonacci support level on the Dollar Index.
As long as the Federal Reserve maintains its hawkish stance, the U.S. Dollar may continue its upward momentum. However, the 103–104 zone — which aligns with the 50% Fibonacci retracement and a significant supply area — could serve as a strong resistance.
If price gets rejected from this area and we simultaneously see signs of a rate cut or weakening U.S. economic data, a trend reversal and corrective phase could begin. In that case, lower targets around 95 or even 93 could become likely in the medium term.
good luck

CASH100 (NASDAQ) CRASH - Head and shoulders Risk/reward = 3.7
Entry price = 23 430
Stop loss price = 23 503.2
Take profit level 1 (50%) = 23 202
Take profit level 2 (50%) = 23 099
Still waiting for some variables to confirm before entering the trade